the Creative Commons Attribution 4.0 License.
the Creative Commons Attribution 4.0 License.
 | 08 Jun 2026
Nonlinear quantitative relationship between the duration and occurrence frequency of droughts
Pengcheng Yan
Guolin Feng
Cailing Zhao
Ping Yang
Hao Wu
Dongdong Zuo
This study aims to quantify the relationship between the duration and occurrence frequency of droughts in China, particularly focusing on different drought intensities. By analyzing daily meteorological drought composite index (MCI) data from 1897 meteorological stations across China spanning from 1961 to 2020, the study reveals a significant double-logarithmic relationship between drought duration and occurrence frequency. The results show that shorter drought durations are associated with higher occurrence frequencies, while longer durations correspond to lower frequencies. This relationship is characterized by parameter k or b. Spatially, the values of the parameter exhibit a gradient from northwest to southeast, with higher values in arid and semi-arid regions and lower values in humid and semi-humid regions. Notably, the parameter k aligns well with precipitation isolines, effectively distinguishing arid, semi-arid, and humid regions. Additionally, droughts in arid and semi-arid regions tend to last longer (often exceeding 60 d), while those in humid and semi-humid regions are shorter but more frequent. These findings provide critical insights for optimizing water resource management, agricultural planning, and disaster mitigation strategies, enhancing societal resilience to drought impacts.
- Article
(1093 KB) - Full-text XML
- BibTeX
- EndNote


Under the comprehensive influence of human activities and global climate change, the global precipitation has become increasingly uneven in recent years. Particularly, the precipitation concentration period has remarkably changed (e.g. Zhang et al., 2021; Xue and Xue, 2022), thereby causing the variation in the duration of drought events. Severe drought events occur on smaller time scales, such as days to weeks, known as flash droughts (e.g. Wang et al., 2017; Yuan et al., 2020), which often cause more severe social and economic losses. Such climatic nonlinearities are by no means unprecedented, having been revealed in the seminal work of Lorenz (1963). Subsequently, hydroclimatic variables – including precipitation and temperature – have been widely documented to exhibit chaotic dynamics characterized by positive Lyapunov exponents and limited predictability horizons (Tsonis and Elsner, 1988; Li et al., 2020, 2023, 2026). Against this backdrop, drought processes have increasingly been recognized as manifesting pronounced nonlinear behaviors. So far, there has been limited studies on the quantitative relationship between the occurrence frequency and duration of drought events at different intensities based on the daily drought index. Therefore, revealing this relationship is critical to understanding persistent drought processes and further explore the variation characteristics of drought duration under different climate backgrounds.
Generally, drought events occur on various time scales, including inter-decadal (Xu et al., 2017), inter-annual (e.g. Wang and Yuan, 2018; Zhang et al., 2020), seasonal (e.g. Zhang et al., 2020; Hou et al., 2013; Wang and Yuan, 2018) and shorter time scales such as days and weeks (e.g. Mo and Lettenmaier, 2015; Wang et al., 2016). Specifically, drought events on long time scales often occur on the national or intercontinental spatial scales. During the period from the 1960s to the 1980s, a severe drought event struck the African continent, causing millions of deaths (Qian et al., 2017). Droughts on inter-annual and seasonal time scales often occur on regional scale. For instance, severe droughts lasting for several seasons generally occurred in Northwest China, North China and Southwest China, resulting in great damages to agriculture, forestry and ecological environment in these regions (Huang and Zhai, 2024). Drought events on shorter time scales, known as flash droughts, mostly occurred in a smaller area, which brought huge losses to food production and economic development (such as enterprises relying on hydropower) due to rapid water losses. In 2022, a severe flash drought occurred in the upper and middle reaches of the Yangtze River in China (Zhang, 2022). As it can be seen, this demonstrates that droughts can occur across different time scales, with shorter drought events expected to occur more frequently, while prolonged droughts should be relatively rare. However, the precise mathematical form governing this relationship and its regional variability across diverse climate regimes have not been systematically established. This knowledge gap limits our ability to (i) probabilistically assess drought risks based on expected persistence times, (ii) differentiate climate zones through their drought duration-frequency signatures, and (iii) develop duration-dependent early warning thresholds that account for local climatic backgrounds. Hence, it is necessary to further clarify the threshold of drought duration and study its relationship with drought occurrence frequency.
Existing indexes depicting drought events are mostly defined based on the data at monthly or even longer time scales, such as the standard precipitation index (SPI) and palmer drought severity index (PDSI). Although these indexes have played an essential role in studying the characteristics of drought events at long time scales, they are insufficient to meet the requirement of refined monitoring and research. In recent years, a daily drought index named the meteorological drought composite index (MCI) developed by the China Meteorological Administration (CMA) for the region of China has been proved to be effective in describing daily drought conditions. Specially, this index adopts self-adaptive sensitivity coefficients for different climate zones of China. In previous studies, MCI has exhibited excellent application potential (e.g. Yu et al., 2023; Feng et al., 2023).
Therefore, this study uses the MCI data calculated based on the data from national observation stations in China. Firstly, the drought duration at each station is calculated, and its relationship with drought occurrence frequency is analyzed. Next, a parameter equation is used to determine the nonlinear relationship between the duration and occurrence frequency of droughts. Finally, the ability of the parameters to characterize this nonlinear relationship is analyzed.
2.1 Meteorological drought composite index
In this study, MCI is adopted to investigate the characteristics of drought processes. It is calculated based on the moisture index in recent 30 d (MI30), SPI in recent 90 and 150 d (SPI90 and SPI150), and the standardized weighted precipitation index in recent 60 d (SPIW60). The specific equation is as follows.
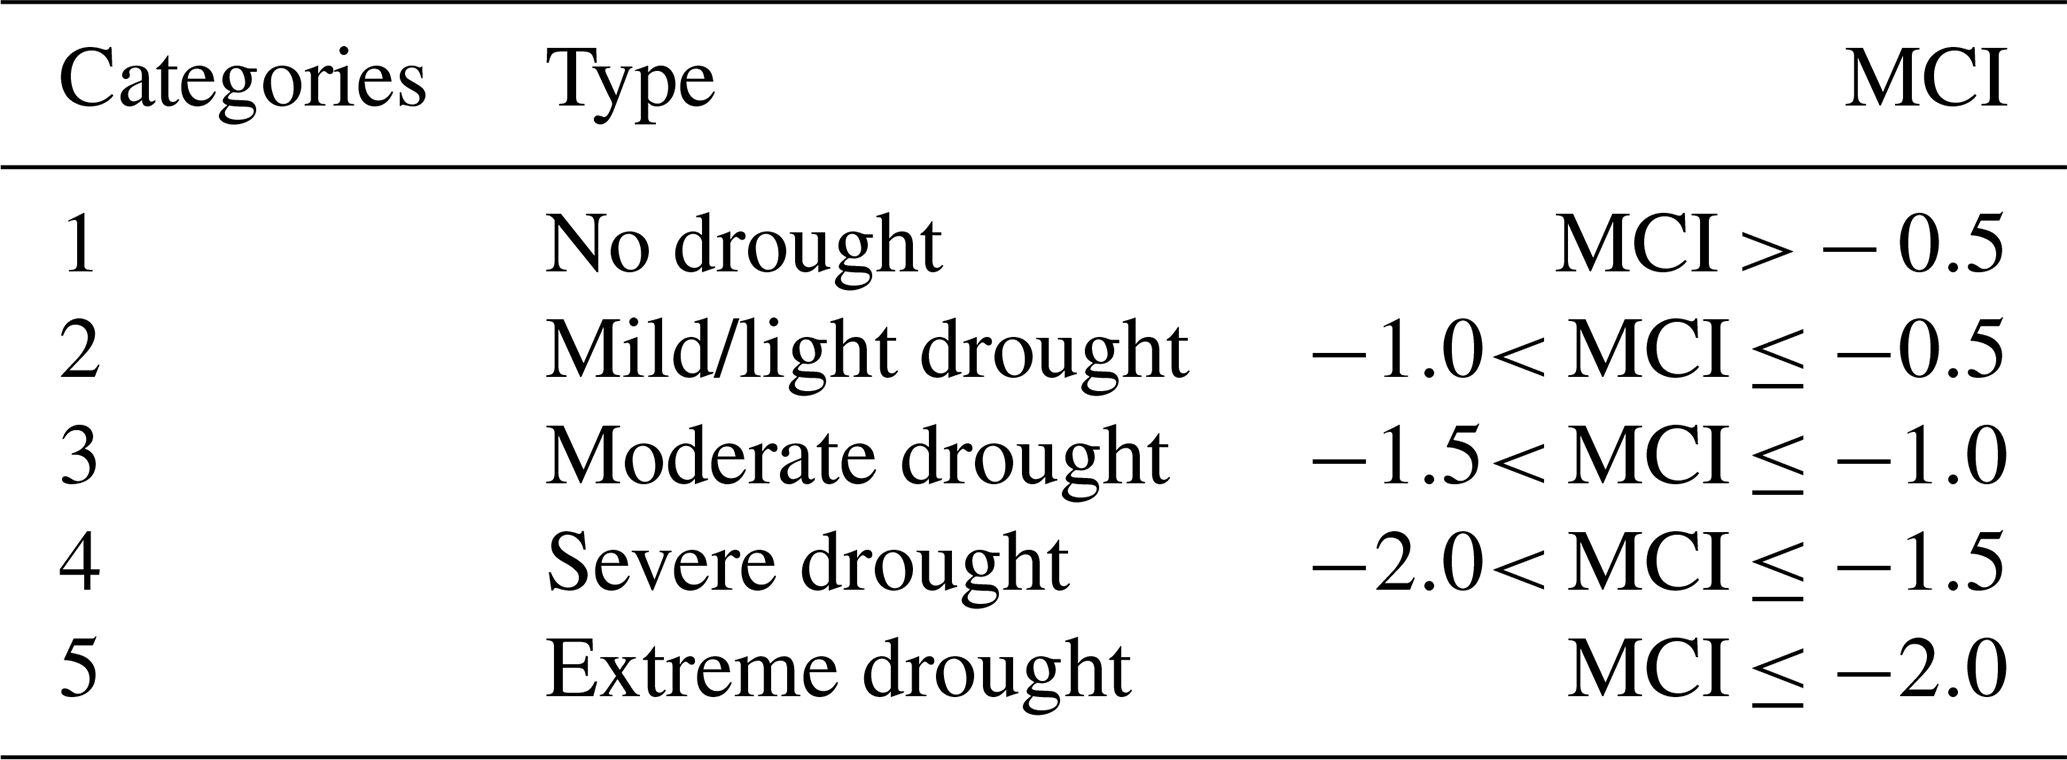
where a, b, c and d are weight coefficients that vary with regions. Ka is the seasonal adjustment coefficient, and its value varies with regions and seasons. The details can refer to the Chinese national standard (GB/T 20481, 2017). The smaller the MCI, the severer the drought is. The grade of MCI refers to Table 1. MCI makes it possible to analyze the evolution features of drought processes on daily time scale. Currently, it has been applied in the daily monitoring operation of drought events by the CMA.
The study period spans from 1 January 1961 to 31 December 2020. After the quality control procedure, observation data from 1897 stations with data validation exceeding 95 % are selected. As shown in Fig. 1, the selected stations distribute in most regions of China except Hainan and Taiwan. Additionally, the Qinghai-Tibet Plateau (gray area in Fig. 1) region is not included in our study due to sparse station data.
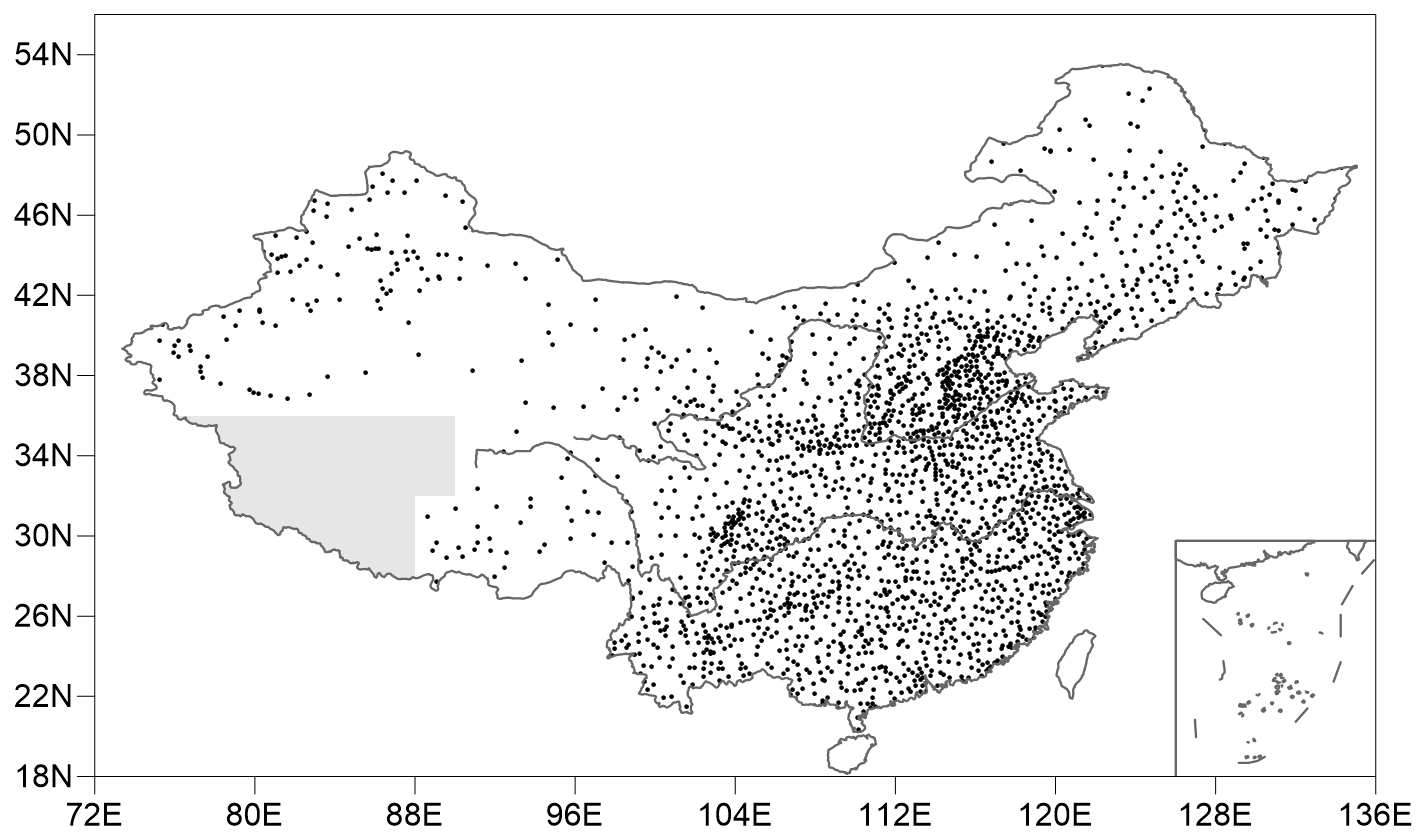
Figure 1Distribution of stations.
2.2 Identification of drought processes
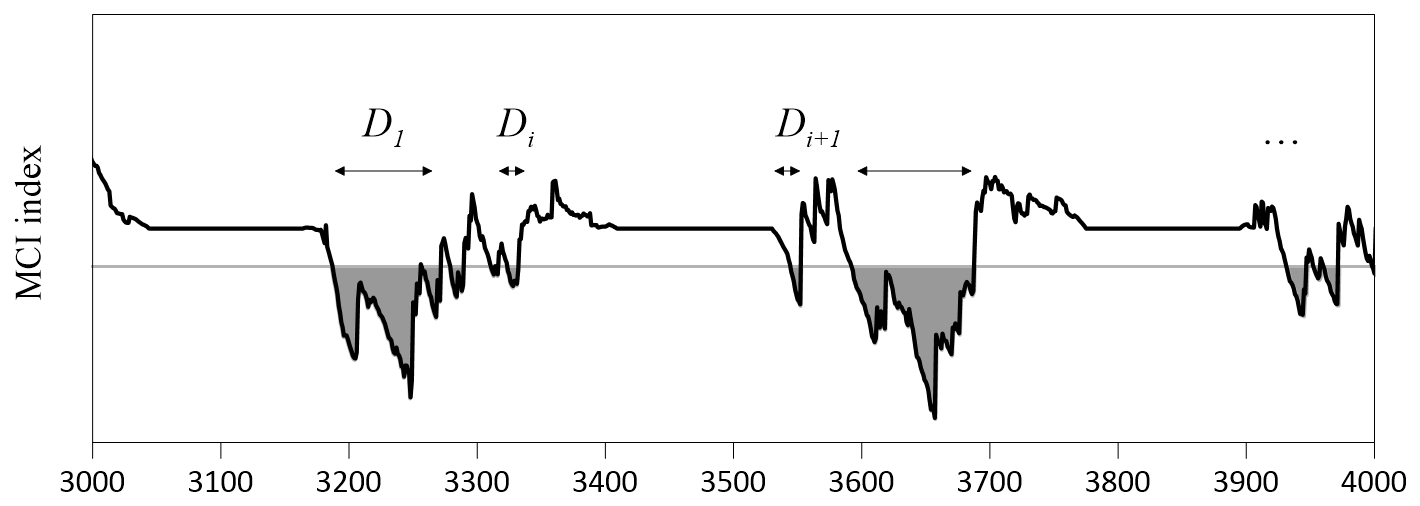
Figure 2 demonstrates the evolution of droughts with time at individual stations. The black line represents the daily MCI, and the gray line denotes the MCI thresholds. The value of MCI lower than the threshold indicates the occurrence of droughts, and the gray shaded region demonstrates the drought period. Di represents the ith drought process. Based on MCI thresholds of different grades (i.e., mild, moderate, severe and extreme drought), drought processes at different intensities are identified for this study. The drought duration was obtained from the daily drought index time sequence and marked as D1,D2…Dn. For each drought duration, the start moment, end moment, and the intensity were recorded.
2.3 Relationship between the duration and occurrence frequency of droughts
Previous study has revealed that there is a nonlinear relationship between the duration and occurrence frequency of drought processes. According to Şişman (2020), this relationship can be expressed in a double-logarithmic form as follows.
where τ and f denotes the duration and occurrence frequency of droughts, respectively. Parameters k and b can be determined through linear fitting of the logarithm values of duration and occurrence frequency of droughts at each station. The R-squared (R2) value is applied to evaluate the performance of linear fitting, where a larger value of R2 corresponds to a stronger linear relationship between the duration and occurrence frequency of droughts.
It is worth noting that through a mathematical derivation on Eq. (2), a function of drought occurrence frequency expressed by drought duration can be obtained, and the equation is as follows.
Equation (3) uses parameters k and b to reveal the nonlinear relationship between the drought duration parameter τ and the frequency parameter f.
Based on the drought processes identified at all meteorological stations in China, the occurrence frequencies of droughts at the grade of mild and above with different durations are statistically analyzed, and the results are displayed in Fig. 3a. It is revealed that the shorter (longer) the drought duration, the higher (lower) the drought occurrence frequency. A significant negative correlation is observed in the double logarithmic values between drought duration and occurrence frequency, with the value of R2 reaching 0.88 (Fig. 3b), demonstrating a markedly significant double logarithmic relationship between the duration and occurrence frequency of droughts. Figure 3c further illustrates that there are 98.31 % stations with the value of R2 exceeding 0.6, suggesting that most stations exhibit a significant double logarithmic relationship between the drought duration and occurrence frequency. This implies that the double logarithmic relationship between the duration and occurrence frequency of droughts is applicable to drought processes in China. Figure 4 reveals that the values of R2 present a distribution pattern of “higher in the east and lower in the west” in China. Specifically, the lowest R2 is observed in Kashgar of southern Xinjiang, with the value below 0.4, followed by Hexi of Gansu Province and western Inner Mongolia, with the value ranging between 0.5 and 0.7. In the western part of Southwest China, central and eastern Inner Mongolia and Northeast China, the value spans from 0.7 to 0.8. The areas with R2 value exceeding 0.8 are located south of the Yellow River.
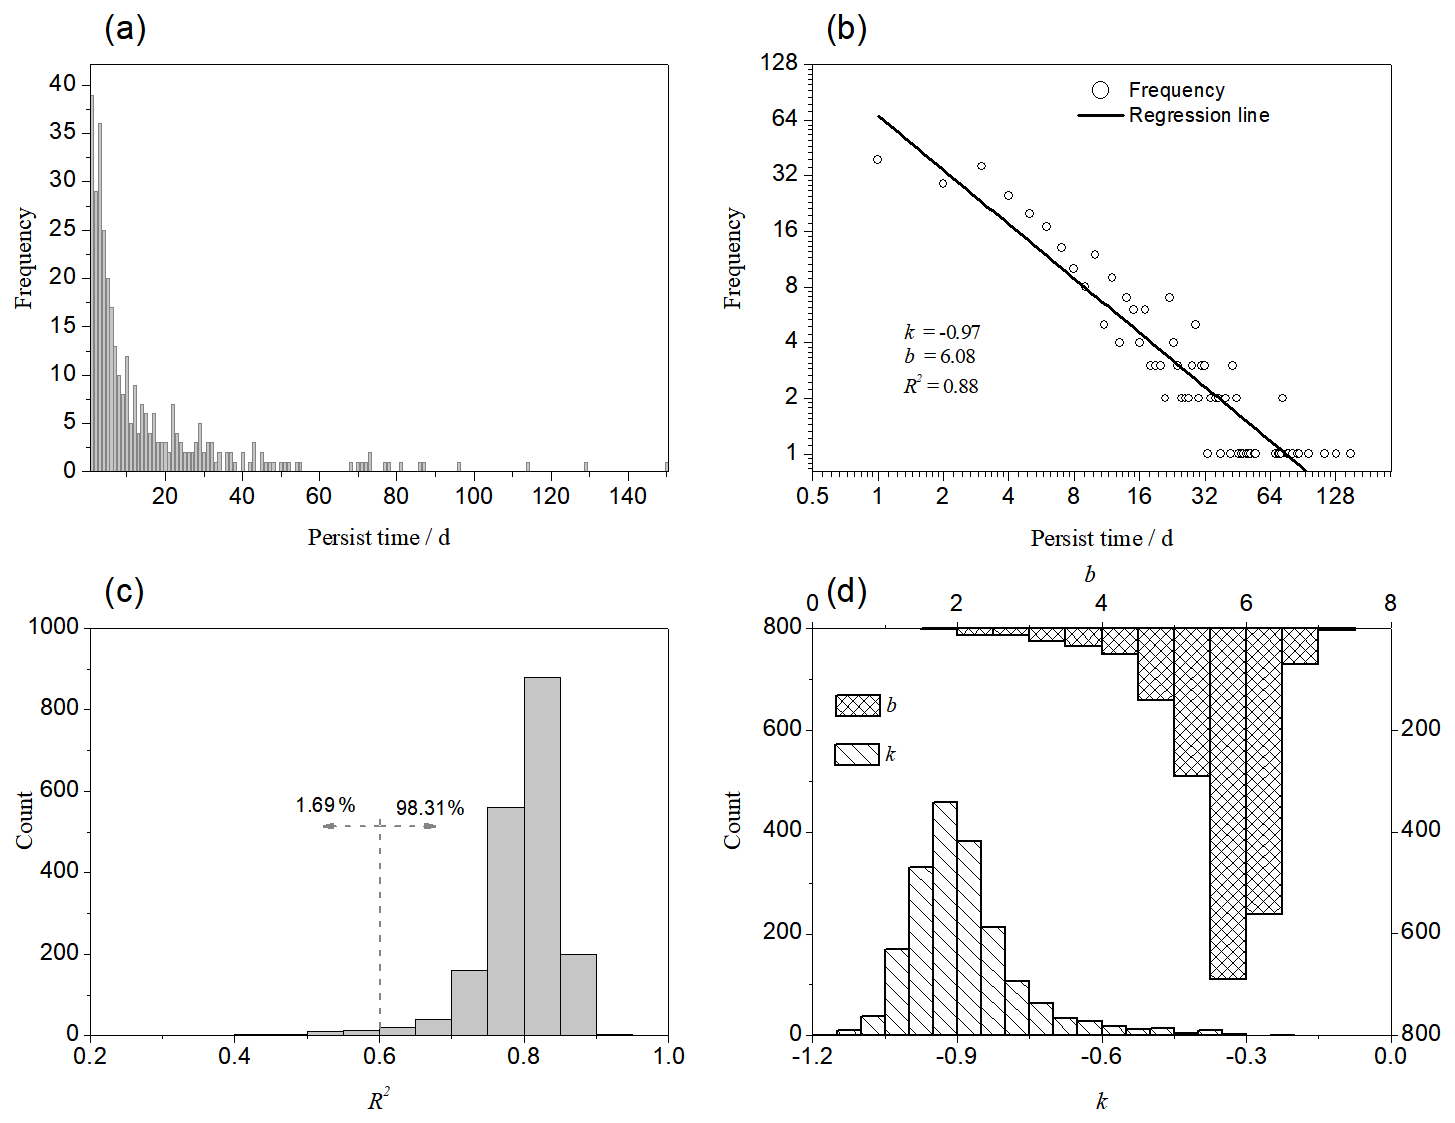
Figure 3Linear relationship of frequency and drought duration and the PDF of parameters of relationship. (a) The frequency of drought persist time. (b) The linear relationship between the frequency and drought persist time. (c) The PDF of R2. (d) The PDF of parameters k and b.
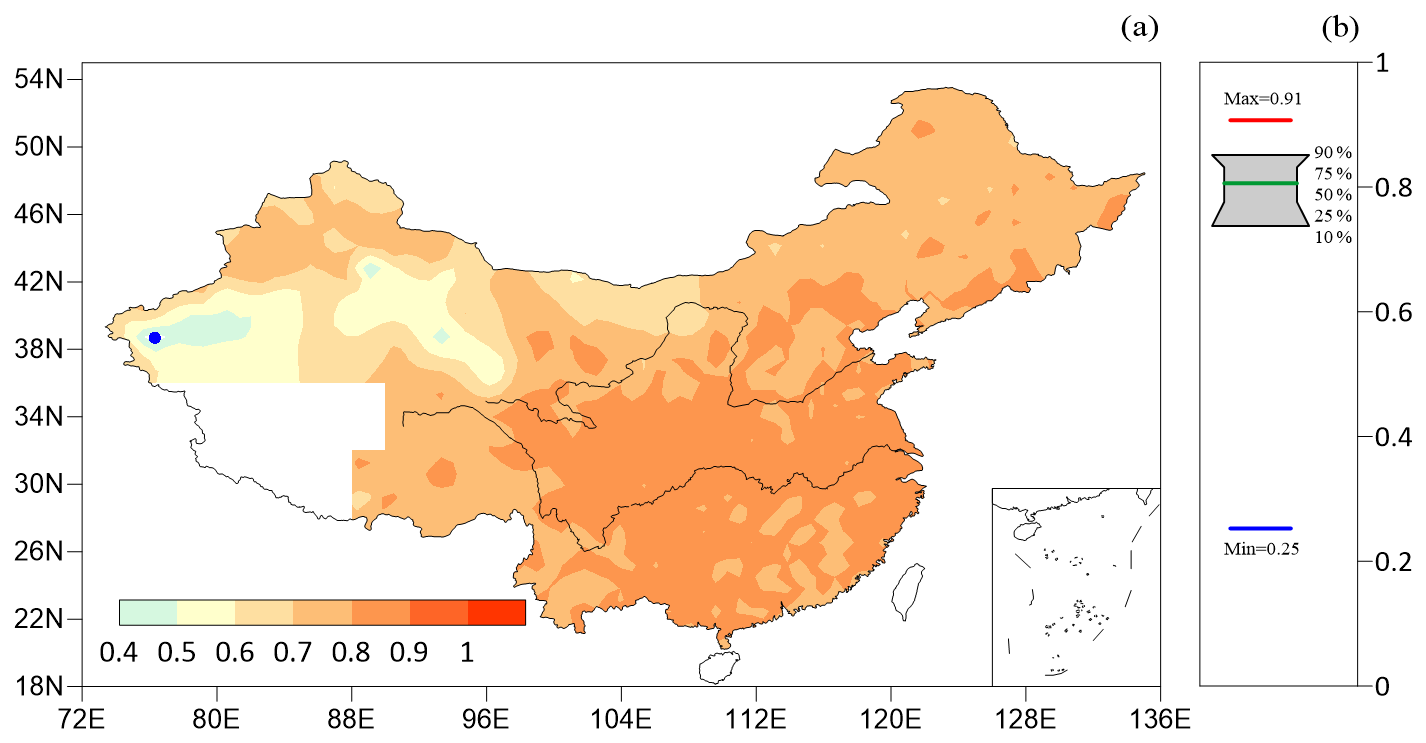
Figure 4Distribution of R2 (a) and the box chart (b).
Figure 3d illustrates the statistical distributions of fitting parameters k and b. The value of k mainly ranges from −1.2 to −0.6, and b is mainly between 4 and 7. It can be seen that the values of k and b are centralized. Figure 5a displays that there is a significant linear relationship between k and b. Here, two red scattered points in Fig. 5a are taken as examples. For the station on the left side of the figure, the maximum drought occurrence frequency exceeds 100 times, with the values of parameters k and b reaching −1.06, 6.78, respectively. The R2 is 0.83, demonstrating an evident double logarithmic relationship between the duration and occurrence frequency of droughts at the stations under this parameter setting. For the station on the right side, the relationship between the duration and occurrence frequency of droughts is shown in Fig. 5c. The maximum drought occurrence frequency at this station is less than 20 times, with the values of parameters k and b being −0.63, 3.74, respectively. The R2 is 0.80, indicating that the double logarithmic correlation between the drought duration and occurrence frequency is also obvious at the stations under this parameter setting. In addition, it is also revealed that parameters a and b can feature drought processes. The larger the fitting parameters, the higher the drought occurrence frequency.
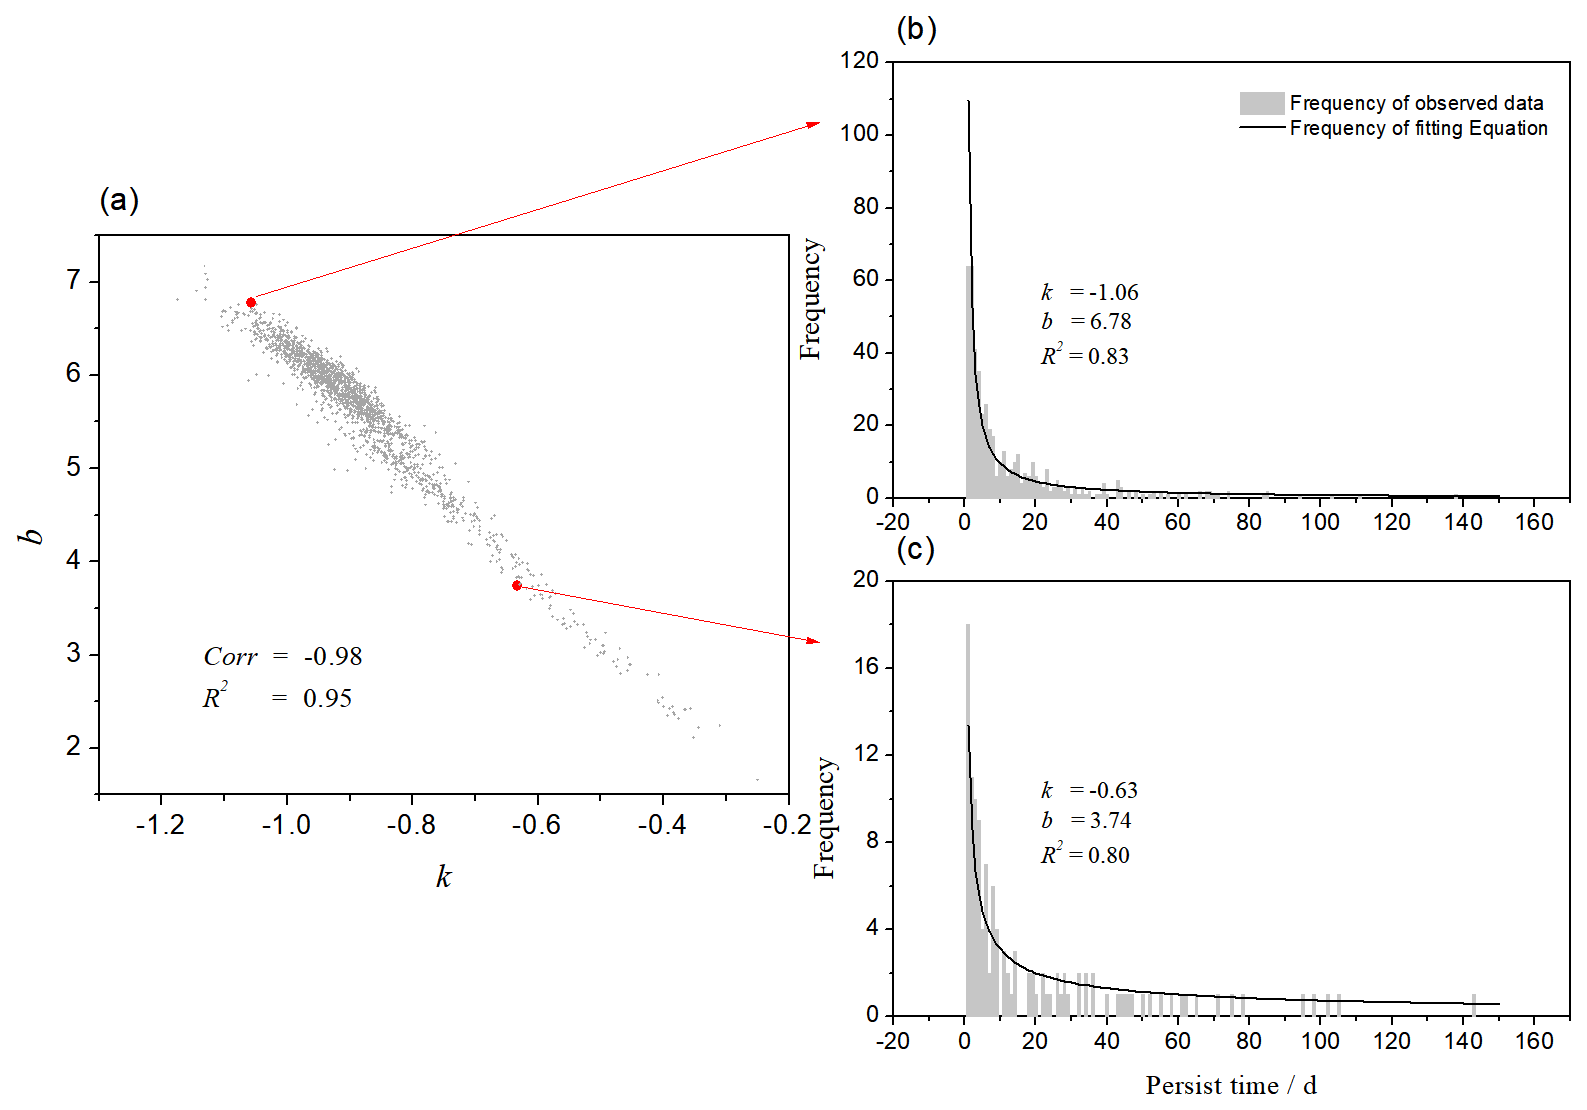
Figure 5Relationship between parameter k and parameter b (a) and the relationship between the drought duration and its frequency with different parameters (b, c).
According to Fig. 5, the linear relationship between k and b can be solved, with R2 of 0.95 and correlation coefficient of −0.98, which can be substituted in Eq. (3) to obtain the equation as follows.
Equation (3) characterizes the nonlinear relationship among drought duration, parameter k and drought occurrence frequency. Figure 6a shows this relationship based on observation data, and Fig. 6b is the relationship between them according to Eq. (3). It can be seen that Fig. 6a is almost consistent with Fig. 6b, which indicates that the deterministic relationship between the duration and occurrence frequency of droughts can be only controlled by parameter k. Besides, according to the linear ship between parameter k and parameter b, we can also only use the parameter b to characterize the nonlinear relationship between drought frequency and duration (equation omitted). Meanwhile, Fig. 6 also presents an inverse-proportional relationship between the occurrence frequency and their duration.
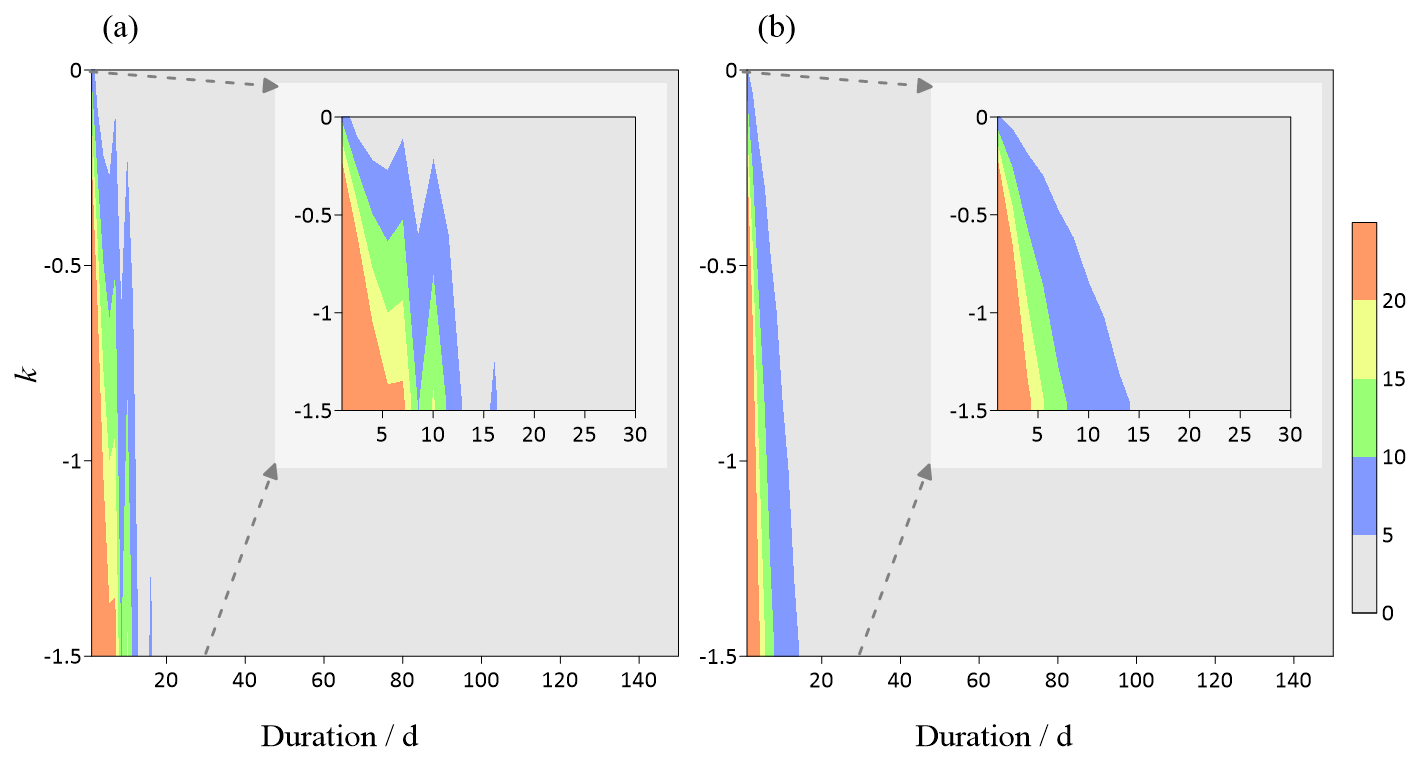
Figure 6Relationship among the drought duration, the frequency and the parameter k based on the observed data (a) and the numerical equation (b).
The above section revealed that the parameter k can be used individually to characterize the nonlinear relationship between the duration and occurrence frequency of droughts. Figure 7a illustrates the spatial distribution of k, where the purple and red lines respectively denote the 200 and 400 mm precipitation isolines, which also serve as the boundaries of arid region, semi-arid region, and humid and semi-humid region. Notably, the value of k is relatively larger in arid regions, followed by that in semi-arid regions, and the lower value of k is mainly located in humid and semi-humid regions. As mentioned above, the smaller the k, the higher the drought occurrence frequency. Consequently, the occurrence frequency of droughts in humid and semi-humid regions is much higher than that in arid and semi-arid regions. It is worth noting that the contour lines of k with the values of −0.6 (−0.8) align well with those of 200 mm (400 mm) precipitation isolines. According to the parameter k, the regions are classified into three types, namely, arid region, semi-arid region, and humid and semi-humid region. On this basis, the relationship between the duration and occurrence frequency of droughts in each region is further explored (Fig. 7b). In humid and semi-humid regions, the drought occurrence frequency exceeds 50 times. While in semi-arid regions, the occurrence frequency is 30 times, and it is only about 10 times in arid regions. However, taking the drought duration into consideration, especially for durations above 90 d, the drought occurrence frequency is higher in arid regions and semi-arid regions. For droughts with the duration exceeding 120 d, the occurrence frequencies in semi-arid regions and arid regions are substantially higher than those in humid and semi-humid regions. It is indicated that although the drought occurrence frequency in humid and semi-humid regions is relatively higher, the corresponding drought duration is generally shorter, whereas drought duration in arid and semi-arid regions is generally longer.
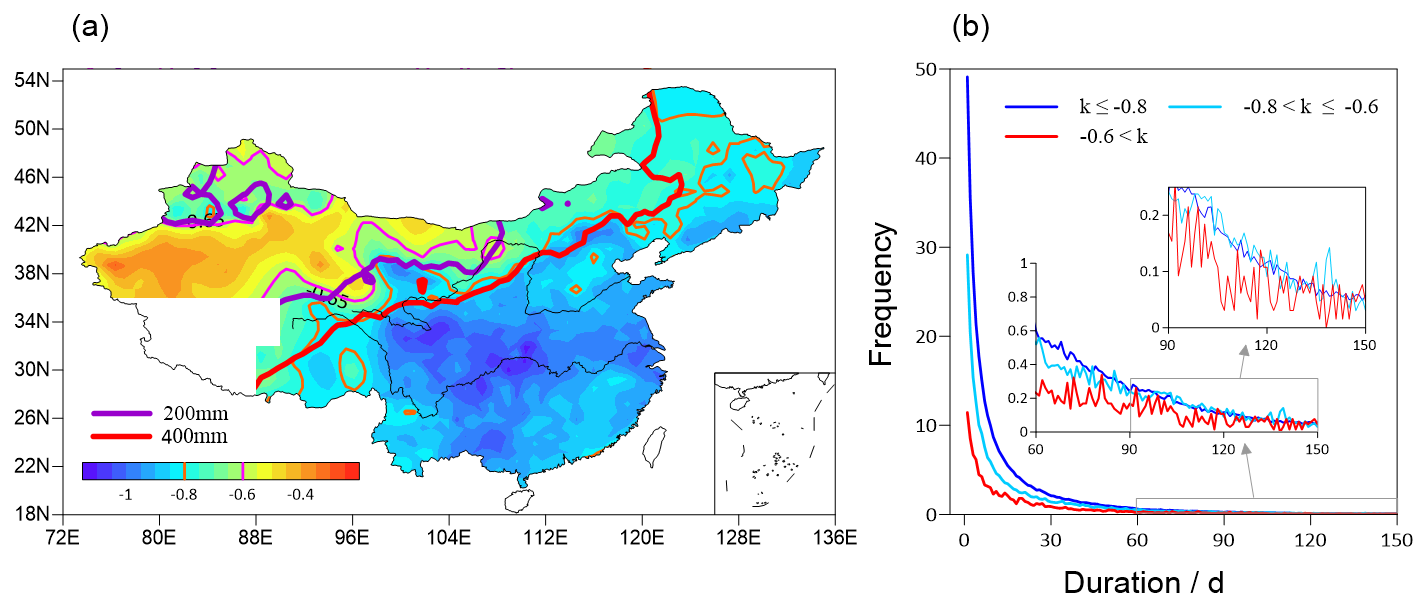
Figure 7Distribution of parameter k (a) and the relationship between the drought duration and its frequency with different parameters (b).
In order to clarify the distribution characteristics of drought duration in different regions, the initial time and duration of droughts in arid regions (Fig. 8a), semi-arid regions (Fig. 8b), and humid and semi-humid regions (Fig. 8c) are further analyzed. In arid regions, droughts predominantly occur in spring and summer, a period with less precipitation, high temperature and strong evaporation. The droughts are relatively obvious during this period, with the duration generally exceeding 60 d in most areas, even above 90 d in some area. In semi-arid regions, drought conditions are the most obvious in spring, followed by those in summer. The drought durations basically exceed 60 d, and it is above 90 d and even reaches 120 d in some areas. In humid and semi-humid regions, the droughts mostly occur in autumn, winter and spring. The durations of most drought processes are less than 40 d, while the longest duration rarely exceeds 60 d. Therefore, arid region and semi-arid region are prone to droughts with longer durations (exceeding 60 or even 90 d).
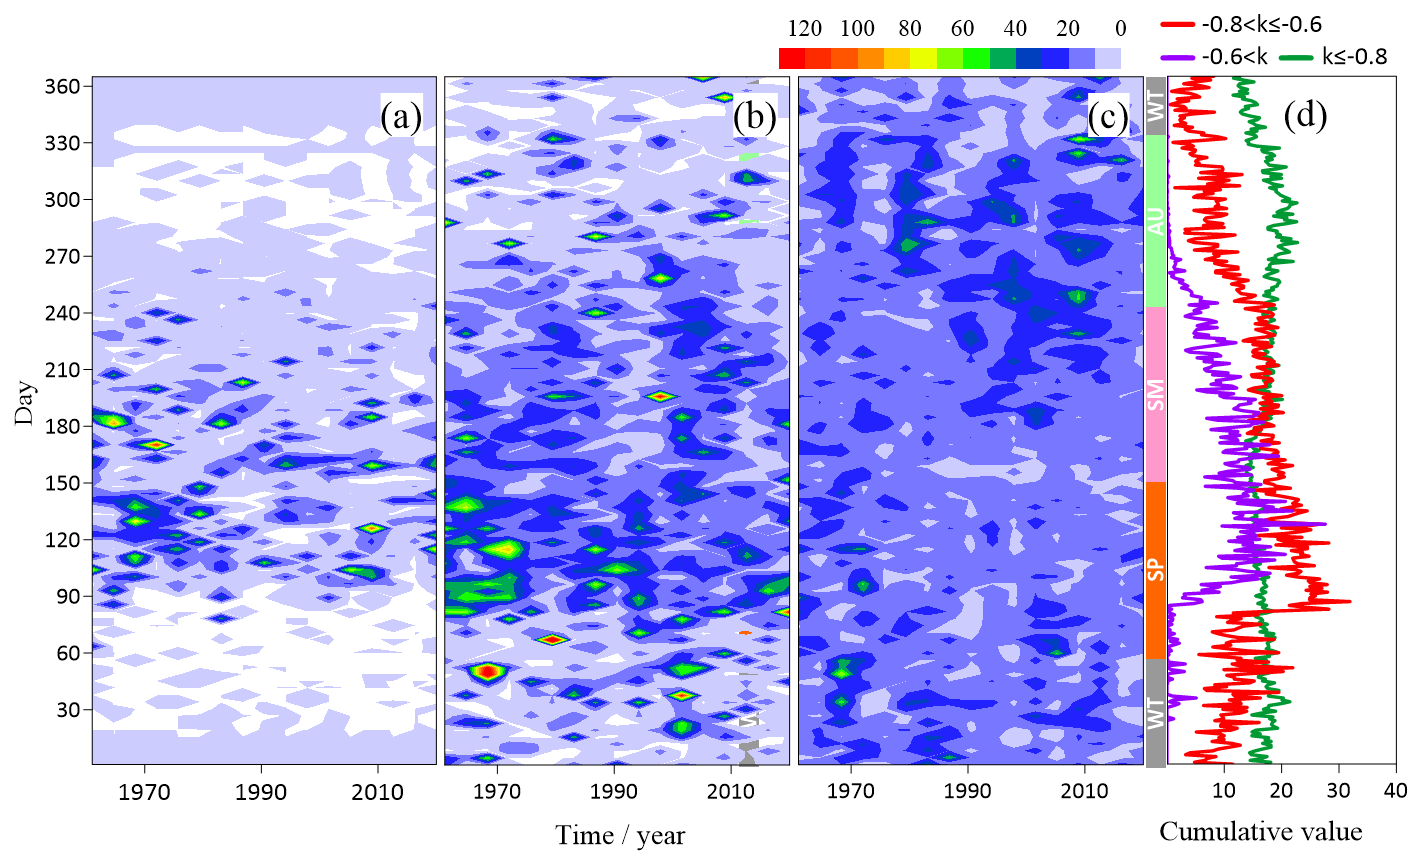
Figure 8The relationship between the drought duration and the start moment in (a) arid region, (b) semi-arid region, (c) humid-semi humid region. (d) Distribution of drought start moments with days in different regions.
The above section mainly focuses on the relationship between the duration and occurrence frequency of droughts at categories of mild and above. Subsequently, the droughts at stronger intensities are analyzed, including those at grades of moderate droughts and above, severe droughts and above, and extreme droughts and above. As shown in Fig. 9a–c, the distributions of parameter k for the three types of droughts are highly consistent with that of droughts at grades of mild and above, exhibiting a decreasing trend from northwest to southeast. In view of moderate or stronger droughts, the absolute values of k are relatively smaller in southern Xinjiang, northern Gansu and western Inner Mongolia, most of which are desert areas with fewer occurrences of droughts. The larger absolute values of k are mainly located in the Yangtze River Basin. Particularly, there are three marked large-value centers in Sichuan and Chongqing region in the upper reaches, Hunan and Hubei provinces in the middle reaches, and Jiangsu and Zhejiang provinces and western South China in the lower reaches. These are also the areas with more frequent droughts. The results indicate that the parameter k can effectively characterize the occurrence frequency of droughts. For heavy and extreme droughts (Fig. 9b and c), the absolute values of k are relatively small, since the corresponding occurrence frequencies are lower than those of mild and moderate droughts. The spatial distributions of k for severe and extreme droughts are in good accordance with those for mild and moderate droughts.
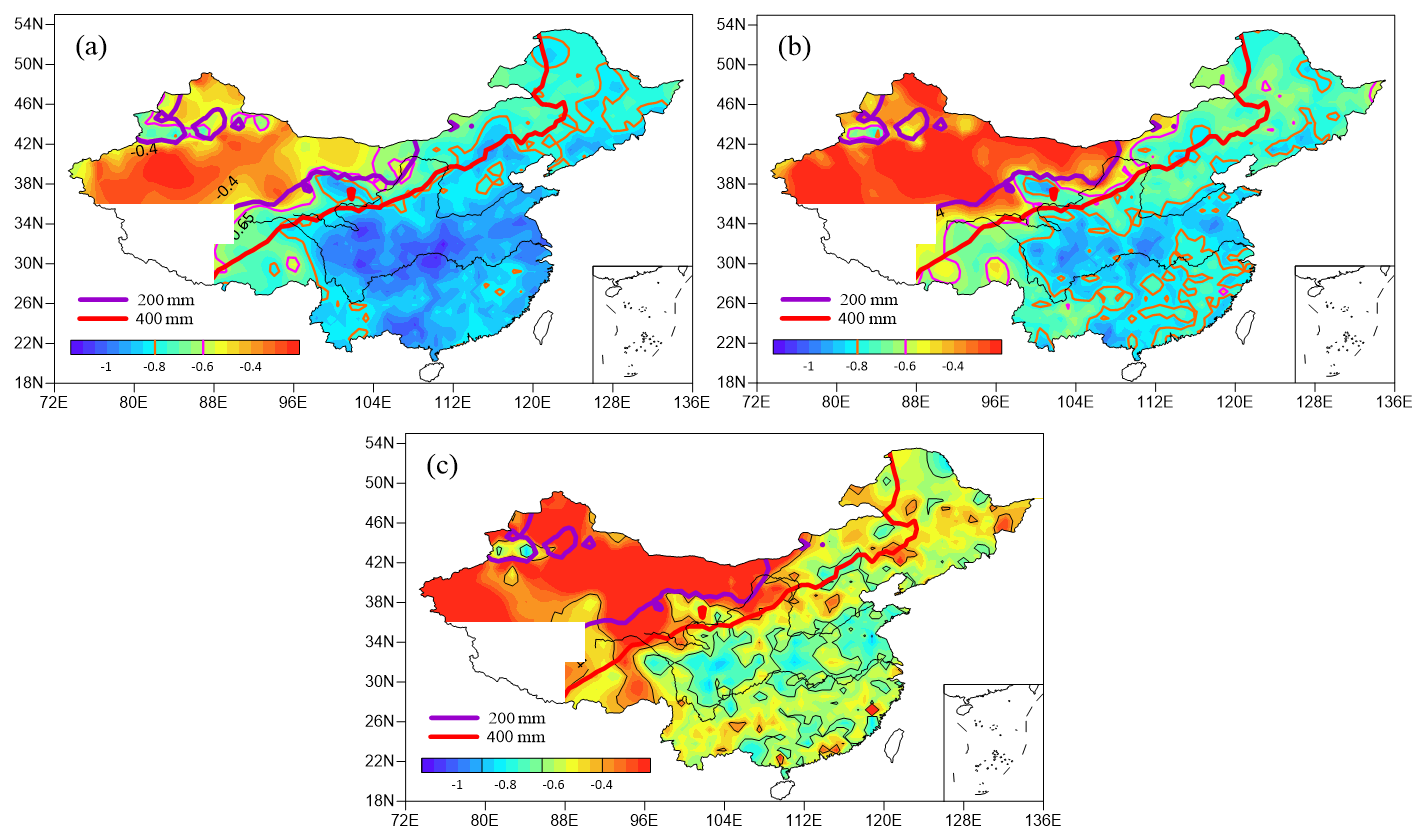
Figure 9Distribution of parameter k of Moderate drought (a), Severe drought (b) and Extreme drought (c).
Subsequently, the parameter differences in the double logarithmic relationship between the duration and occurrence frequency of droughts at different intensities are further investigated (Fig. 10). Regarding the R2 value, the distributions for all types of droughts are relatively centralized, with the standard deviations and means for R2 being 0.06 and 0.80 for mild droughts and above, 0.08 and 0.78 for moderate droughts and above, and 0.12 and 0.73 for severe droughts and above, respectively. Comparatively, the distribution for goodness of fit of extreme droughts is relatively more dispersed, with the variance and mean being 0.15 and 0.63 (exceeding 0.6) (McKelvey and Zavoina, 1975), respectively. This suggests that the droughts at different intensities all follow a double logarithmic relationship.
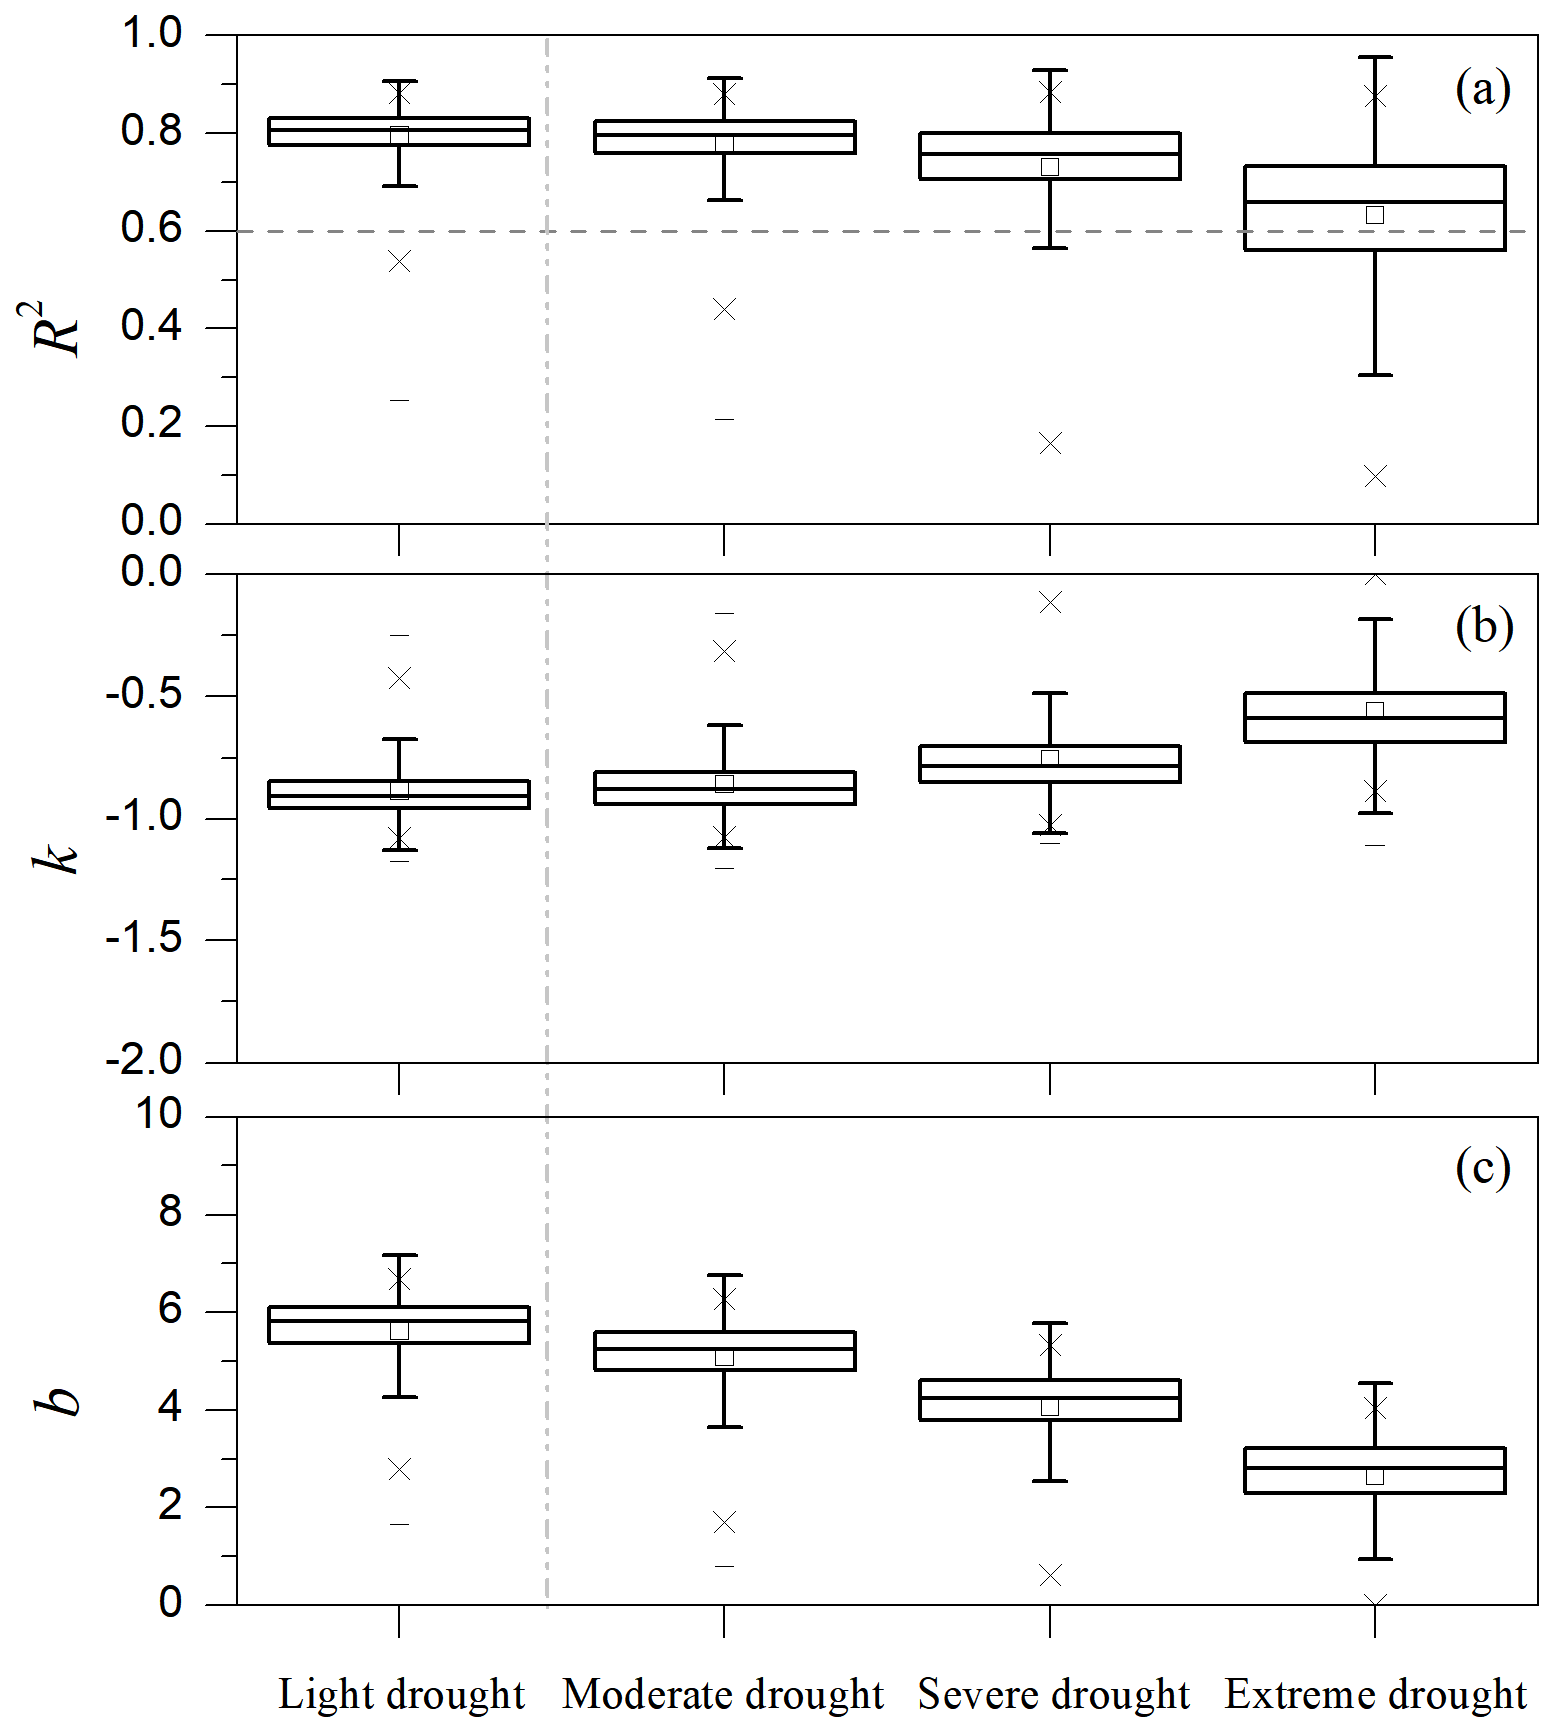
As for parameters k and b, the absolute values of parameters for mild droughts and above are the largest, followed by moderate droughts and above and severe droughts and above, while the parameters for extreme droughts are the smallest. This aligns with that of the occurrence frequency of droughts at different grades, indicating that these parameters can well characterize the drought occurrence frequency. Additionally, the spatial distributions indicate that the occurrence frequencies of all types of droughts increase from northwest to southeast. In other words, the drought occurrence frequency in humid and semi-humid regions is higher than those in arid regions and semi-arid regions. This relationship can be quantified by the parameter k or b.
Consequently, the double logarithmic relationship commonly exists in droughts between their duration and occurrence frequency, which can be observed not only in mild droughts and above, but also in droughts at stronger intensities. Moreover, the spatial distribution characteristics of this relationship can be expressed by one parameter.
Quantifying the relationship between drought duration and occurrence frequency provides critical insights for optimizing water resource management, agricultural planning, and disaster mitigation strategies, thereby enhancing societal resilience to drought impacts. In particular, the revealed nonlinear relationship not only quantifies the characteristics between drought duration and frequency, but also provides new insights for research on drought predictability and disaster severity. While previous studies relying on pentad, monthly, or longer-scale drought indices have successfully characterized long-term drought intensity patterns, the adoption of daily-scale monitoring in this study reveals finer temporal dynamics of drought persistence, which indicates that the double-logarithmic linear relationship exhibits a certain degree of self-organization in drought events on the daily scale. This finding also facilitates the identification of flash drought events with greater precision. As evidenced by the spatial distribution of parameter k, rapid droughts persisting for several days to several tens of days occur more frequently in humid southern regions, where higher absolute values of k correspond to elevated occurrence frequencies of short-duration droughts. This methodological advancement enables three key applications: (1) precise identification of drought initiation/termination thresholds for adaptive water allocation; (2) crop-specific irrigation scheduling based on duration-dependent vulnerability profiles; (3) data-driven insurance product design through probabilistic drought risk quantification. Industries such as hydropower and forestry may leverage these findings to develop climate-adaptive operational protocols, while public health sectors could utilize drought duration statistics to formulate water rationing policies mitigating health risks during prolonged droughts. Beyond the foregoing, whether this double-logarithmic relationship undergoes temporal evolution merits equal scrutiny, as this determines the reliability of our findings under changing climate baselines.
Notably, several limitations should be acknowledged. First, the exclusion of the Qinghai-Tibet Plateau due to sparse station data may affect the completeness of the spatial pattern in western China. Second, MCI's climate-adaptive coefficients are calibrated for China and may not be directly applicable to other regions without recalibration. Third, the double-logarithmic fitting assumes stationarity in drought statistics; climate change may alter these relationships over time, requiring dynamic updating of parameters. Finally, the study focuses on meteorological drought; propagation to hydrological and agricultural droughts involves additional complexities not captured here. The use of MCI rather than SPI or SPEI introduces both advantages and limitations. MCI's multi-timescale design (incorporating 30–150 d precipitation anomalies) captures drought evolution better than SPI alone, but the index is region-specific. Future research will employ complementary drought indices and independent observational networks to validate the robustness of the duration–frequency relationship across diverse hydroclimatic regimes.
In this study, the double logarithmic relationship between the duration and occurrence frequency of droughts is revealed based on the daily drought index from meteorological observation stations in China. The analysis results also illustrate that this relationship can be characterized by the parameter k or parameter b. Additionally, the distributions of these two parameters also resemble those of the occurrence frequency and duration of droughts. The main conclusions are as follows.
A double logarithmic relationship is observed between the duration and occurrence frequency of droughts, which can be represented by the parameter k or parameter b independently, meaning that either parameter can be used independently for regional comparisons in studying the nonlinear association between drought duration and frequency.
The contour lines of parameter k with the values of −0.6 and −0.8 can be regarded as the boundary between arid regions and semi-arid regions and the boundary between humid regions and semi-arid regions, respectively. The distributions of k values vary significantly in different climate zones. Specially, k value is the largest in arid regions, followed by that in semi-arid regions, and it is the smallest in humid and semi-humid regions. The larger the absolute value of k or b, the higher the occurrence frequency of droughts.
In arid regions and semi-arid regions, droughts predominantly occur in winter and spring with longer durations, where the durations generally exceed 60 d and the longest even reaches 120 d. While in humid and semi-humid regions, the drought duration is generally shorter than 60 d.
All code and data (original MCI data requires permission from the China Meteorological Administration) are available upon contacting the corresponding author.
Conceptualization: PY, GF. Analysis and Visualization: PY, CZ. Interpretation of results: PY, PY. Writing (original draft): PY, DZ. Writing (reviewing and editing original draft): GF, PY, HW, CZ.
The contact author has declared that none of the authors has any competing interests.
Publisher's note: Copernicus Publications remains neutral with regard to jurisdictional claims made in the text, published maps, institutional affiliations, or any other geographical representation in this paper. The authors bear the ultimate responsibility for providing appropriate place names. Views expressed in the text are those of the authors and do not necessarily reflect the views of the publisher.
This article is part of the special issue “Emerging predictability, prediction, and early-warning approaches in climate science”. It is not associated with a conference.
This research is jointly funded by the Joint Research Project for Meteorological Capacity Improvement (22NLTSZ003), the National Natural Science Foundation of China (42205050, 42130610, 42530610, 42475059), the Central Guidance Fund for Local Science and Technology Development Projects in Gansu (24ZYQA031), and the Research Fund of Arid Meteorology (IAM202413, IAM202402, IAM202407).
This paper was edited by Ruiqiang Ding and reviewed by three anonymous referees.
Feng, A. Q., Liu, L. L., Wang, G. F., Tang, J., Zhang, X. J., Chen, Y. X., He, X. J., and Liu, P.: Drought Monitoring from Fengyun Satellite Series: A Comparative Analysis with Meteorological-Drought Composite Index (MCI), Remote Sens., 15, https://doi.org/10.3390/rs15225410, 2023.
Hou, W., Zhang, C. J., and Gao, G.: Research on Multi-scale Superposed Drought Index and Its Classification Based on Standardized Precipitation Index, Arid Zone Res., 30, 74–88, https://doi.org/10.13866/j.azr.2013.01.025, 2013.
Huang, M. T. and Zhai, P. M.: Impact of extreme seasonal drought on ecosystem carbon-water coupling across China, Adv. Clim. Change Res., https://doi.org/10.1016/j.accre.2024.08.001, 2024.
Li, X., Ding, R. Q., and Li, J. P.: Quantitative Comparison of Predictabilities of Warm and Cold Events Using the Backward Nonlinear Local Lyapunov Exponent Method, Adv. Atmos. Sci., 37, https://doi.org/10.1007/s00376-020-2100-5, 2020.
Li, X., Ding, R. Q., and Li, J. P.: Estimating the local predictability of heatwaves in south China using the backward nonlinear local Lyapunov exponent method, Clim. Dynam., 61, 3605–3618, https://doi.org/10.1007/s00382-023-06757-z, 2023.
Li, X., Zhang, X., Ding, R. Q., Li, J. P., and Huai, X. W.: Investigating the predictability limit and forecast error dynamics of summer air temperatures over East Asia using the ensemble forecast dataset from ECMWF, Atmos. Res., 335, 108834, https://doi.org/10.1016/j.atmosres.2026.108834, 2026.
Lorenz, E. N.: Deterministic nonperiodic flow, J. Atmos. Sci., 20, 130–141, https://doi.org/10.1177/0309133308091948, 1963.
McKelvey, R. D. and Zavoina, W.: A statistical model for the analysis of ordinal level dependent variables, J. Math. Sociol., 4, 103–120, https://doi.org/10.1080/0022250X.1975.9989847, 1975.
Mo, K. C. and Lettenmaier, D. P.: Heat wave flash droughts in decline, Geophys. Res. Lett., 42, 2823–2829, https://doi.org/10.1002/2015GL064018, 2015.
Qian, Z. A., Song, M. H., Wu, T. W., and Cai, Y.: Review of Advances in World Arid Climate Research (I): Development and Contribution of Some Main Dryland Countries and the UN, Plateau Meteorol., 36, 1433–1456, https://doi.org/10.7522/j.issn.1000-0534.2017.00075, 2017.
Şişman, E.: Self-similar characteristics of drought duration, total deficit, and intensity curves, Arab. J. Geosci., 13, https://doi.org/10.1007/s12517-019-4977-9, 2020.
The People’s Republic of China National Standard, Meteorological drought grades, GB/T 20481-2017, Standards Press of China, Beijing, https://openstd.samr.gov.cn/bzgk//std/newGbInfo?hcno=D2281945A96E8185F67EDC9E7A698049 (last access: 2 June 2026), 2017.
Tsonis, A. A. and Elsner, J. B.: The weather attractor on very short time scales, Nature, 33, 545–547, https://doi.org/10.1038/333545a0, 1988.
Wang, L. Y. and Yuan, X.: Two types of flash drought and their connections with seasonal drought, Adv. Atmos. Sci., 35, 1478–1490, https://doi.org/10.1007/s00376-018-8047-0, 2018.
Wang, L. Y., Yuan, X., Xie, Z. H., Wu, P. L., and Li, Y. H.: Increasing flash droughts over China during the recent global warming hiatus, Sci. Rep., 6, 30571, https://doi.org/10.1038/srep30571, 2016.
Wang, P. Y., Tang, J. P., Sun, X. G., Wang, S. Y., Wu, J., Dong, X. N., and Fang, J.: Heat waves in China: Definitions, leading patterns, and connections to large-scale atmospheric circulation and SSTs, J. Geophys. Res. Atmos., 122, 10679–10699, https://doi.org/10.1002/2017jd027180, 2017.
Xu, B. L., Yang, Q., and Ma, Z. G.: Decadal Characteristics of Global Land Annual Precipitation Variation on Multiple Spatial Scales, Chin. J. Atmos. Sci., 41, 593–602, https://doi.org/10.3878/j.issn.1006-9895.1608.16174, 2017.
Xue, Y. and Xue, X.: Research advances in simultaneous frequency of extreme precipitation and drought, J. Mar. Meteorol., 42, 61–73, https://doi.org/10.19513/j.cnki.issn2096-3599.2022.01.007, 2022.
Yu, H. X., Yang, D. D., Liu, B. J., Fu, J. Y., and Liang, Z. H.: Spatio-temporal characteristics of meteorological drought based on the MCI of Penman-Monteith, Nat. Hazards, 119, 221–241, https://doi.org/10.1007/s11069-023-06129-0, 2023.
Yuan, X., Ma, F., Li, H. S., and Chen, S.: A review on multi-scale drought processes and prediction under global change, Trans. Atmos. Sci., 43, 225–237, https://doi.org/10.13878/j.cnki.dqkxxb.20191105005, 2020.
Zhang, D. Q., Zhang, L., Yang, J., and Feng, G. L.: The impact of temperature and precipitation variation on drought in China in last 50 years, Acta Phys. Sin., 59, 655–663, https://doi.org/10.1088/1742-6596/234/1/012052, 2020.
Zhang, Q.: Scientific interpretation of severe drought in the Yangtze River Basin, J. Arid Meteor., 40, 545–548, 2022.
Zhang, Q., Yao, Y. B., Li, Y. H., Huang, J. P., Ma, Z. G., Wang, Z. L., Wang, S. P., Wang, Y., and Zhang, Y.: Progress and prospect on the study of causes and variation regularity of droughts in China, Acta Meteorol. Sin., 78, 500–521, https://doi.org/10.11676/qxxb2020.032, 2020.
Zhang, W. X., Kalli, F., Wu, P. L., Zhou, T. J., Chadwick, R., Marzin, C., Rostron, J., and Sexton, D.: Increasing precipitation variability on daily-to-multiyear timescales in a warmer world, Sci. Adv., https://doi.org/10.1126/sciadv.abf8021, 2021.