the Creative Commons Attribution 4.0 License.
the Creative Commons Attribution 4.0 License.
 | 09 Jan 2023
Weather pattern dynamics over western Europe under climate change: predictability, information entropy and production
Stéphane Vannitsem
The impact of climate change on weather pattern dynamics over the North Atlantic is explored through the lens of the information theory of forced dissipative dynamical systems.
The predictability problem is first tackled by investigating the evolution of block entropies on observational time series of weather patterns produced by the Met Office, which reveals that predictability is increasing as a function of time in the observations during the 19th century and beginning of the 20th century, while the trend is reversed at the end of the 20th century and beginning of the 21st century. This feature is also investigated in the 15-member ensemble of the UK Met Office CMIP5 model for the 20th and 21st centuries under two climate change scenarios, revealing a wide range of possible evolutions depending on the realization considered, with an overall decrease in predictability in the 21st century for both scenarios.
Lower bounds of the information entropy production are also extracted, providing information on the degree of time asymmetry and irreversibility of the dynamics. The analysis of the UK Met Office model runs suggests that the information entropy production will increase by the end of the 21st century, by a factor of 10 % in the Representative Carbon Pathway RCP2.6 scenario and a factor of 30 %–40 % in the RCP8.5 one, as compared to the beginning of the 20th century. This allows one to make the conjecture that the degree of irreversibility is increasing, and hence heat production and dissipation will also increase under climate change, corroborating earlier findings based on the analysis of the thermodynamic entropy production.
- Article
(3326 KB) - Full-text XML
- BibTeX
- EndNote


The climate system is a forced dissipative system, whose forcing depends on time. Among the components of this forcing, one can mention the obvious natural forcing (solar, volcanic eruptions), but one of the most important forcings in recent decades is the anthropogenic forcing known to strongly affect the climate system (e.g. Lovejoy, 2014; Hébert and Lovejoy, 2018; Ghil and Lucarini, 2020; IPCC, 2021). This anthropogenic forcing is inducing a rapid global increase in temperature as amply illustrated in the IPCC report (IPCC, 2021). The link between these rapid modifications of the dynamics and frequency of weather patterns is an important question as it could have a strong impact on society (e.g. Corti et al., 1999; Plaut and Simonnet, 2001; Pope et al., 2022).
The use of weather patterns to define similar atmospheric situations goes back to the early 1950s with for instance the development of the Grosswetterlagen (Hess and Brezowsky, 1952); see also Barry and Perry (1973). Since then, such patterns are mostly used to summarize the information content in weather forecasts (Neal et al., 2016), to develop statistical forecasting models (Nicolis et al., 1997; Vannitsem, 2001) or to investigate the quality of models (Davini and D'Andrea, 2020; Fabiano et al., 2020). The key advantage of such an approach is to reduce the complexity of the problem at hand by limiting the number of possible outcomes to a set of symbols that can be studied on their own. The link between the succession of patterns and the underlying physical mechanisms of transitions such as large-scale Rossby wave breaking is also an important line of research (Michel and Rivière, 2011).
The succession of weather patterns, as the underlying dynamics, displays a certain degree of randomness, mainly rooted in the natural property of sensitivity to initial conditions (e.g. Hannachi et al., 2017; Vannitsem, 2017). To describe such a dynamics, a probabilistic approach is needed, which can be naturally cast in the context of information theory. This framework allows for the characterization of the predictability properties in terms of persistence, transition paths, and the degree of surprise of new patterns (Nicolis and Nicolis, 2012). Recently considerable progress has been made in the extension of the concept of information to dynamical systems out of equilibrium (Daems and Nicolis, 1999; Gaspard, 2004; Andrieux et al., 2007; Gomez-Marin et al., 2008; Roldán and Parrondo, 2010, 2012; Nicolis and Nicolis, 2012). Notably, the connections between information entropy, irreversibility and dissipation in such systems have been made, together with the impact of coarse-graining. Such developments open the way to analyze the dynamical and thermodynamical properties of non-equilibrium systems based on single coarse-grained trajectories.
The present work is devoted to investigating the dynamical properties in the succession of the North Atlantic weather patterns as defined by Neal et al. (2016) in the observations and in the climate projections of the UK Met Office CMIP5 model (Pope et al., 2022), using recent tools of information theory. The focus is placed on the understanding of the impact of climate change on the predictability of the system through the evolution of the information entropy and of the associated information entropy production. The work is organized as follows. The notions of information entropy and its production are first introduced in Sect. 2. In Sect. 3, the data set used is briefly presented, and in Sect. 4, the results are discussed. Finally, a summary of the results is provided in the conclusions.
One key quantity introduced in the context of information theory is (Shannon) entropy (Shannon, 1951),
where p(i) is the probability of being in state i, with
This quantity (Eq. 1) is an (weighted) average over the ensemble of states i of a measure, −ln (p(i)), of unexpectedness of an event (equivalent to the amount of information content in this event). This quantity has three important properties (Nicolis and Nicolis, 2012). (i) It is maximized when all the possible events have the same probabilities, like for instance in drawing random numbers from a dice. (ii) Adding an impossible event does not change SI. (iii) The additivity property, i.e. the entropy of a composite system .
The Shannon entropy used in this form is however static and does not provide insight into the dynamics of the process. Other tools should therefore be used. A natural extension of this concept can be made to series of symbols, called words, known as the block entropy:
where is the joint probability of the sequence . Block entropies have already been used to characterize the succession of weather patterns over Switzerland in Nicolis et al. (1997). They showed in particular that this evolution is not a first-order Markov process that could, otherwise, be reduced to the analysis of the two-state transition matrix between successive patterns (Gardiner, 1996). This type of analysis is also performed to characterize the complexity of processes in many different fields from biology (e.g. Provata et al., 2014) to music (e.g. Basios et al., 2021).
Gaspard (2004) introduced the additional notion of time-reversed information entropy per unit time,
where now the path through the different patterns is reversed in time, and the average is still performed along the forward path. If this quantity is subtracted to Sn, one gets the Kullback–Leibner divergence between the forward and backward trajectories in the form of
which is positive definite. This quantity is meant to characterize the time asymmetry of the trajectory and hence the irreversibility of the underlying process (Gaspard, 2004).
For n tending to infinity, this quantity converges to an asymptotic value d∞, which is equal to the rate of contraction in phase space provided the partition is generated by a Markov process with infinitesimally small cells and infinitesimally small time steps (Gaspard, 2004; Nicolis and Nicolis, 2012), already demonstrating a strong connection of the information content with the underlying dynamics. At a microscopic level, the quantity, d∞, can also be related to the physical entropy production under some appropriate assumptions (Andrieux et al., 2007; Gomez-Marin et al., 2008; Roldán and Parrondo, 2010, 2012). In this work, d∞ will be referred to as the information entropy production.
In general, it can be shown that (e.g. Roldán and Parrondo, 2012)
and when the process is generating a first-order Markov dynamics, d2=d∞, which is readily available when computing the two-state joint probabilities. When it is not first-order Markov, d∞ can be accessed by computing the sequence of dk and, using empirical laws, estimating d∞ (Roldán and Parrondo, 2010). In the current work, the process of succession of weather patterns is not first-order Markov (as discussed in the Appendix), and one must evaluate the sequence of lower bounds. This needs considerable data, and one can only estimate a small number of these lower bounds that still provide very important information on the information entropy production.
The process of coarse-graining also has an impact on the amplitude of dk as shown in Gomez-Marin et al. (2008) and also Pierre Gaspard (2022, personal communication): when reducing the number of symbols (or patterns) to characterize the system, the amplitude of dk decreases. This could lead to estimates of the information entropy production for very coarse partitions of the dynamics that are not statistically very well defined. This is most probably the case of the analyses that are done with the coarser partition for the observations below. This problem is however alleviated when investigating the set of model runs, as better statistics can be obtained.
At the Met Office, 30 weather patterns were defined and are used on a daily basis in the operational forecasting suite in order to draw the overall evolution of the weather over the eastern part of the North Atlantic and the western part of Europe (Neal et al., 2016). The evolution of the weather on a daily basis is available starting from 1 January 1850 until now. In the present work, the series used go from 1 January 1850 to 31 December 2019, featuring 62 091 daily weather situations.
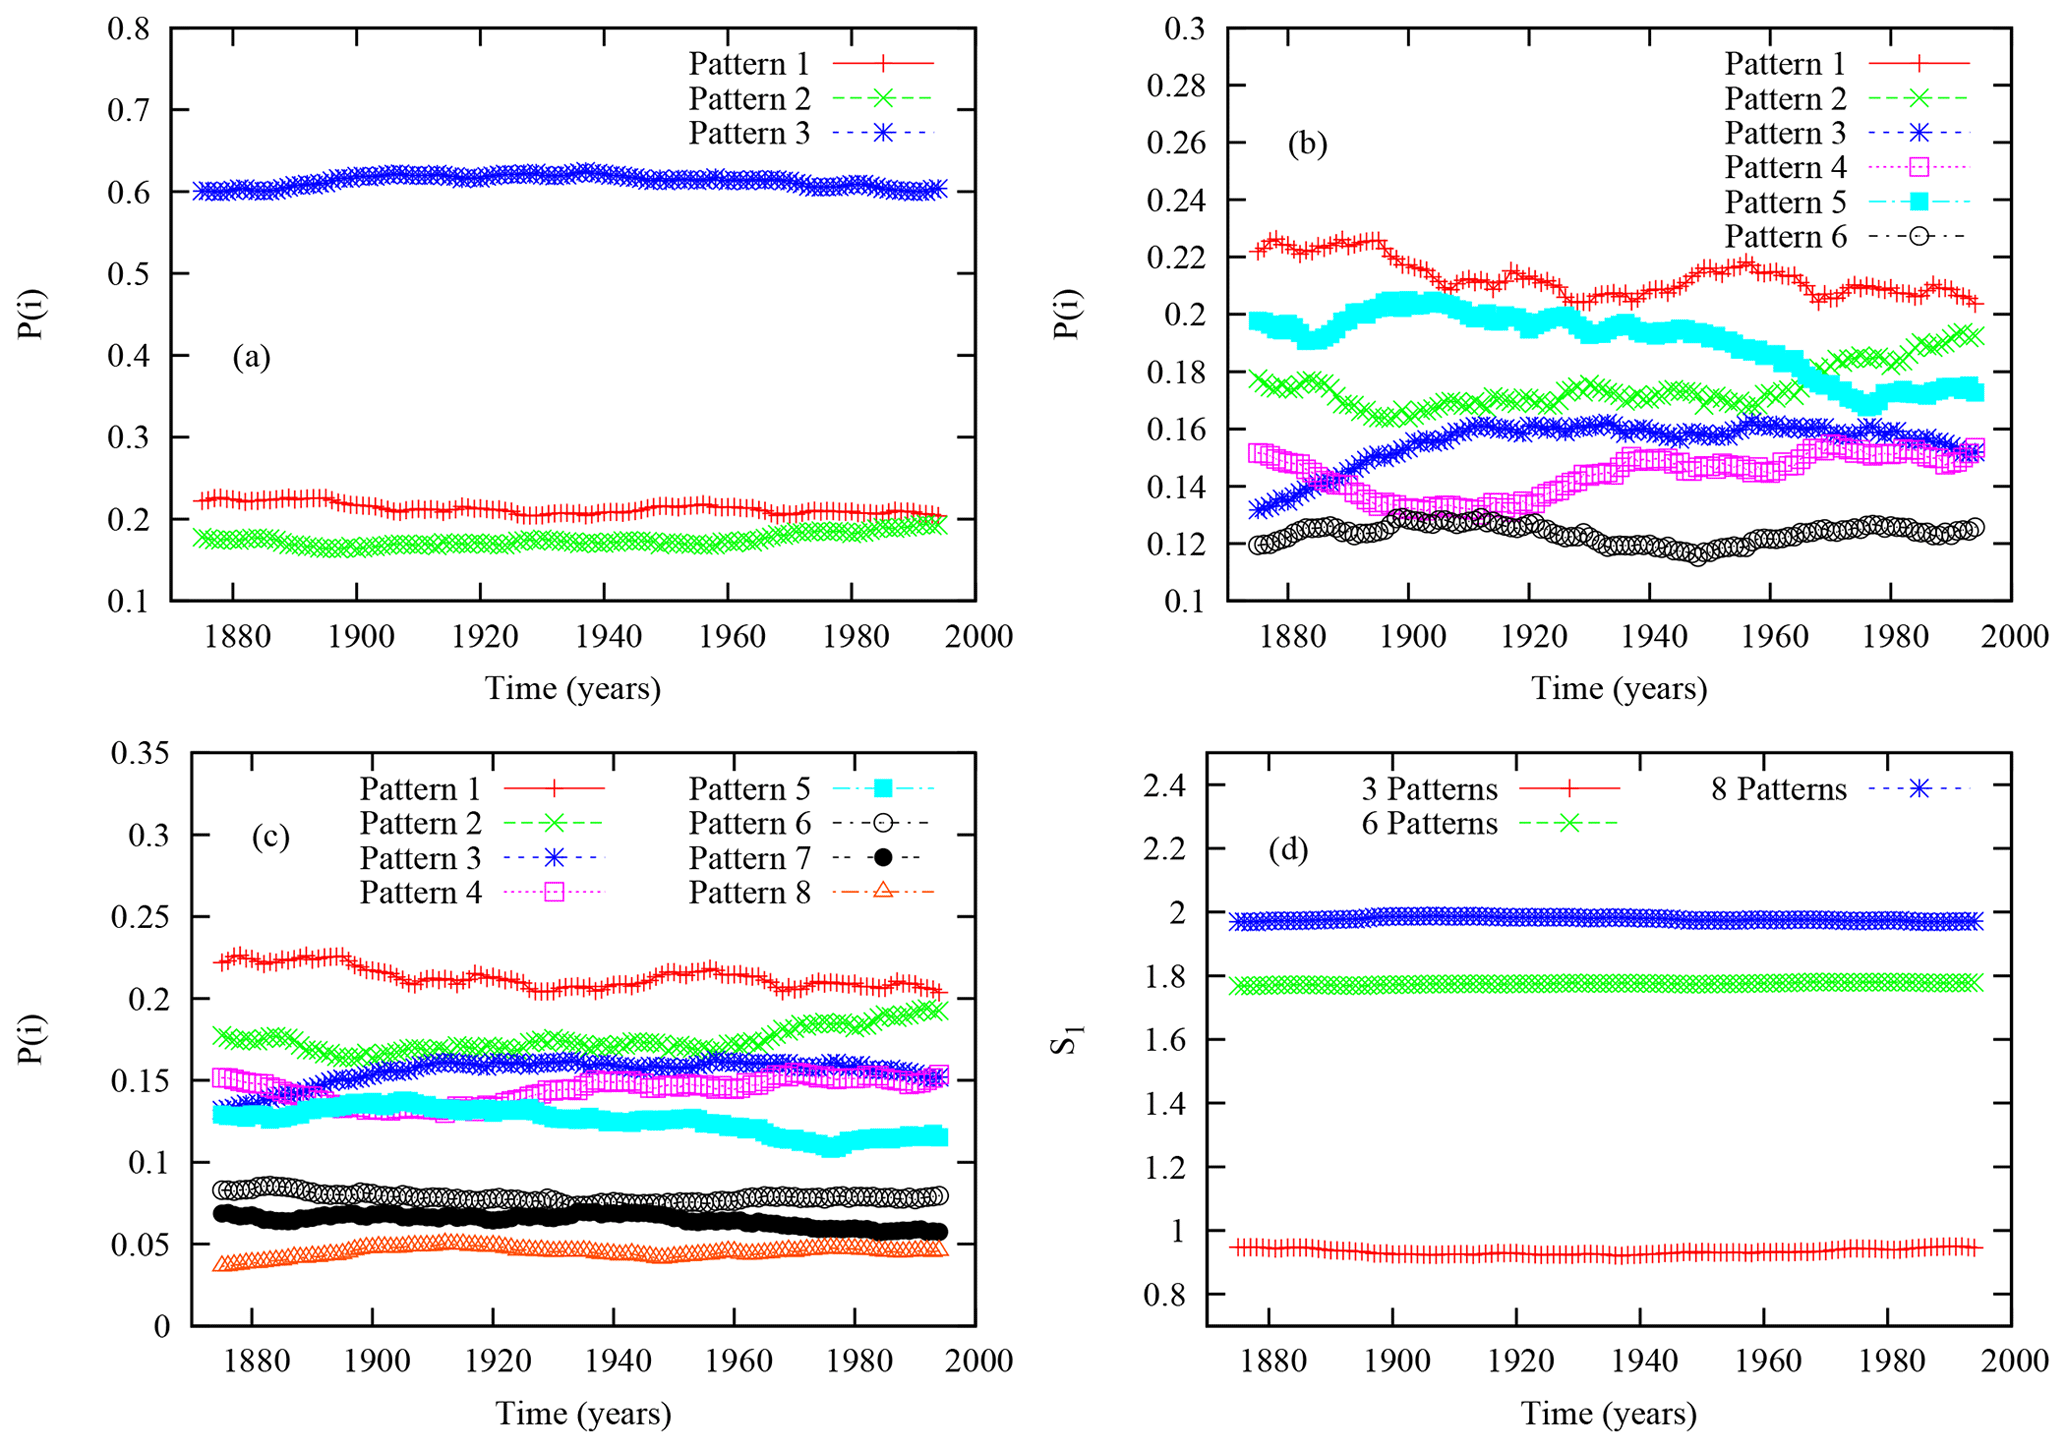
Figure 1Temporal evolution of (a) the probability of being in one of the three patterns, (b) the probability of being in one of the six patterns, (c) the probability of being in one of the eight patterns, and (d) the Shannon entropy for the three partitions.
As the application of the tools mentioned in Sect. 2 can be effectively used provided the number of data is large and the number of different patterns is small, it is important to find an appropriate balance between the length of the series and the number of patterns. Thirty regimes is very large, and 900 entries already have to be estimated for the two-state joint probabilities, and this becomes even worse when increasing the length of the words. With such a small number of daily events, it is therefore unrealistic to keep a large number of weather patterns. To solve that problem, one can further cluster the patterns, as done for instance in Neal et al. (2016) to eight states. The eight weather patterns are described in Table 1 of Neal et al. (2016) and displayed in their Fig. 3. The first two patterns with the largest populations in their analysis are referred to as North Atlantic Oscillation (NAO)+ (21.2 %) and NAO- (17.8 %), with opposite positive and negative mean sea level pressure anomalies over Iceland. These two patterns are usually found in the investigation of weather patterns over the North Atlantic and its surroundings. The other patterns mostly related to the local weather fields over Ireland, the United Kingdom, and western Europe are defined in Neal et al. (2016) as north-westerly, south-westerly, Scandinavian high, high pressure centred over the UK, low close to the UK and Azores high, respectively.
This number is still large to evaluate joint probabilities with such a small amount of data. We therefore further reduce the number of clusters to six with a merging of similar patterns, eight with six and seven with five, as in Allen (2021). This can even be further reduced to three, with the two dominant patterns 1 and 2, representing the positive and negative phases of the NAO, and the third one regrouping all other possible patterns (Allen, 2021). Besides their use for forecasting purposes, these data were used for different research purposes, such as for investigating the persistence of weather patterns (Richardson et al., 2018).
Besides the observational weather patterns, the UK Met Office produces the time series of weather patterns for a set of 15 different perturbed-parameter climate model versions under two climate scenarios (Pope et al., 2022). The two climate scenarios are defined based on two Representative Carbon Pathways (RCPs), namely RCP 2.6 and RCP 8.5. The model versions differ only by the choice of parameters and not by the forcing (Pope et al., 2022; Sexton et al., 2021).
All simulations are run from 1 December 1899 to 30 November 2099 at a resolution of N216. The model is first forced by the historical forcing until 2005 and then forced with the Representative Carbon Pathway scenarios. More information can be found in Pope et al. (2022). The simulations are projected on the same weather patterns as in Neal et al. (2016), leading to a set of temporal evolutions for the eight, six and three weather partitions defined above. For the simulations, 15 × 71 970 d are available.
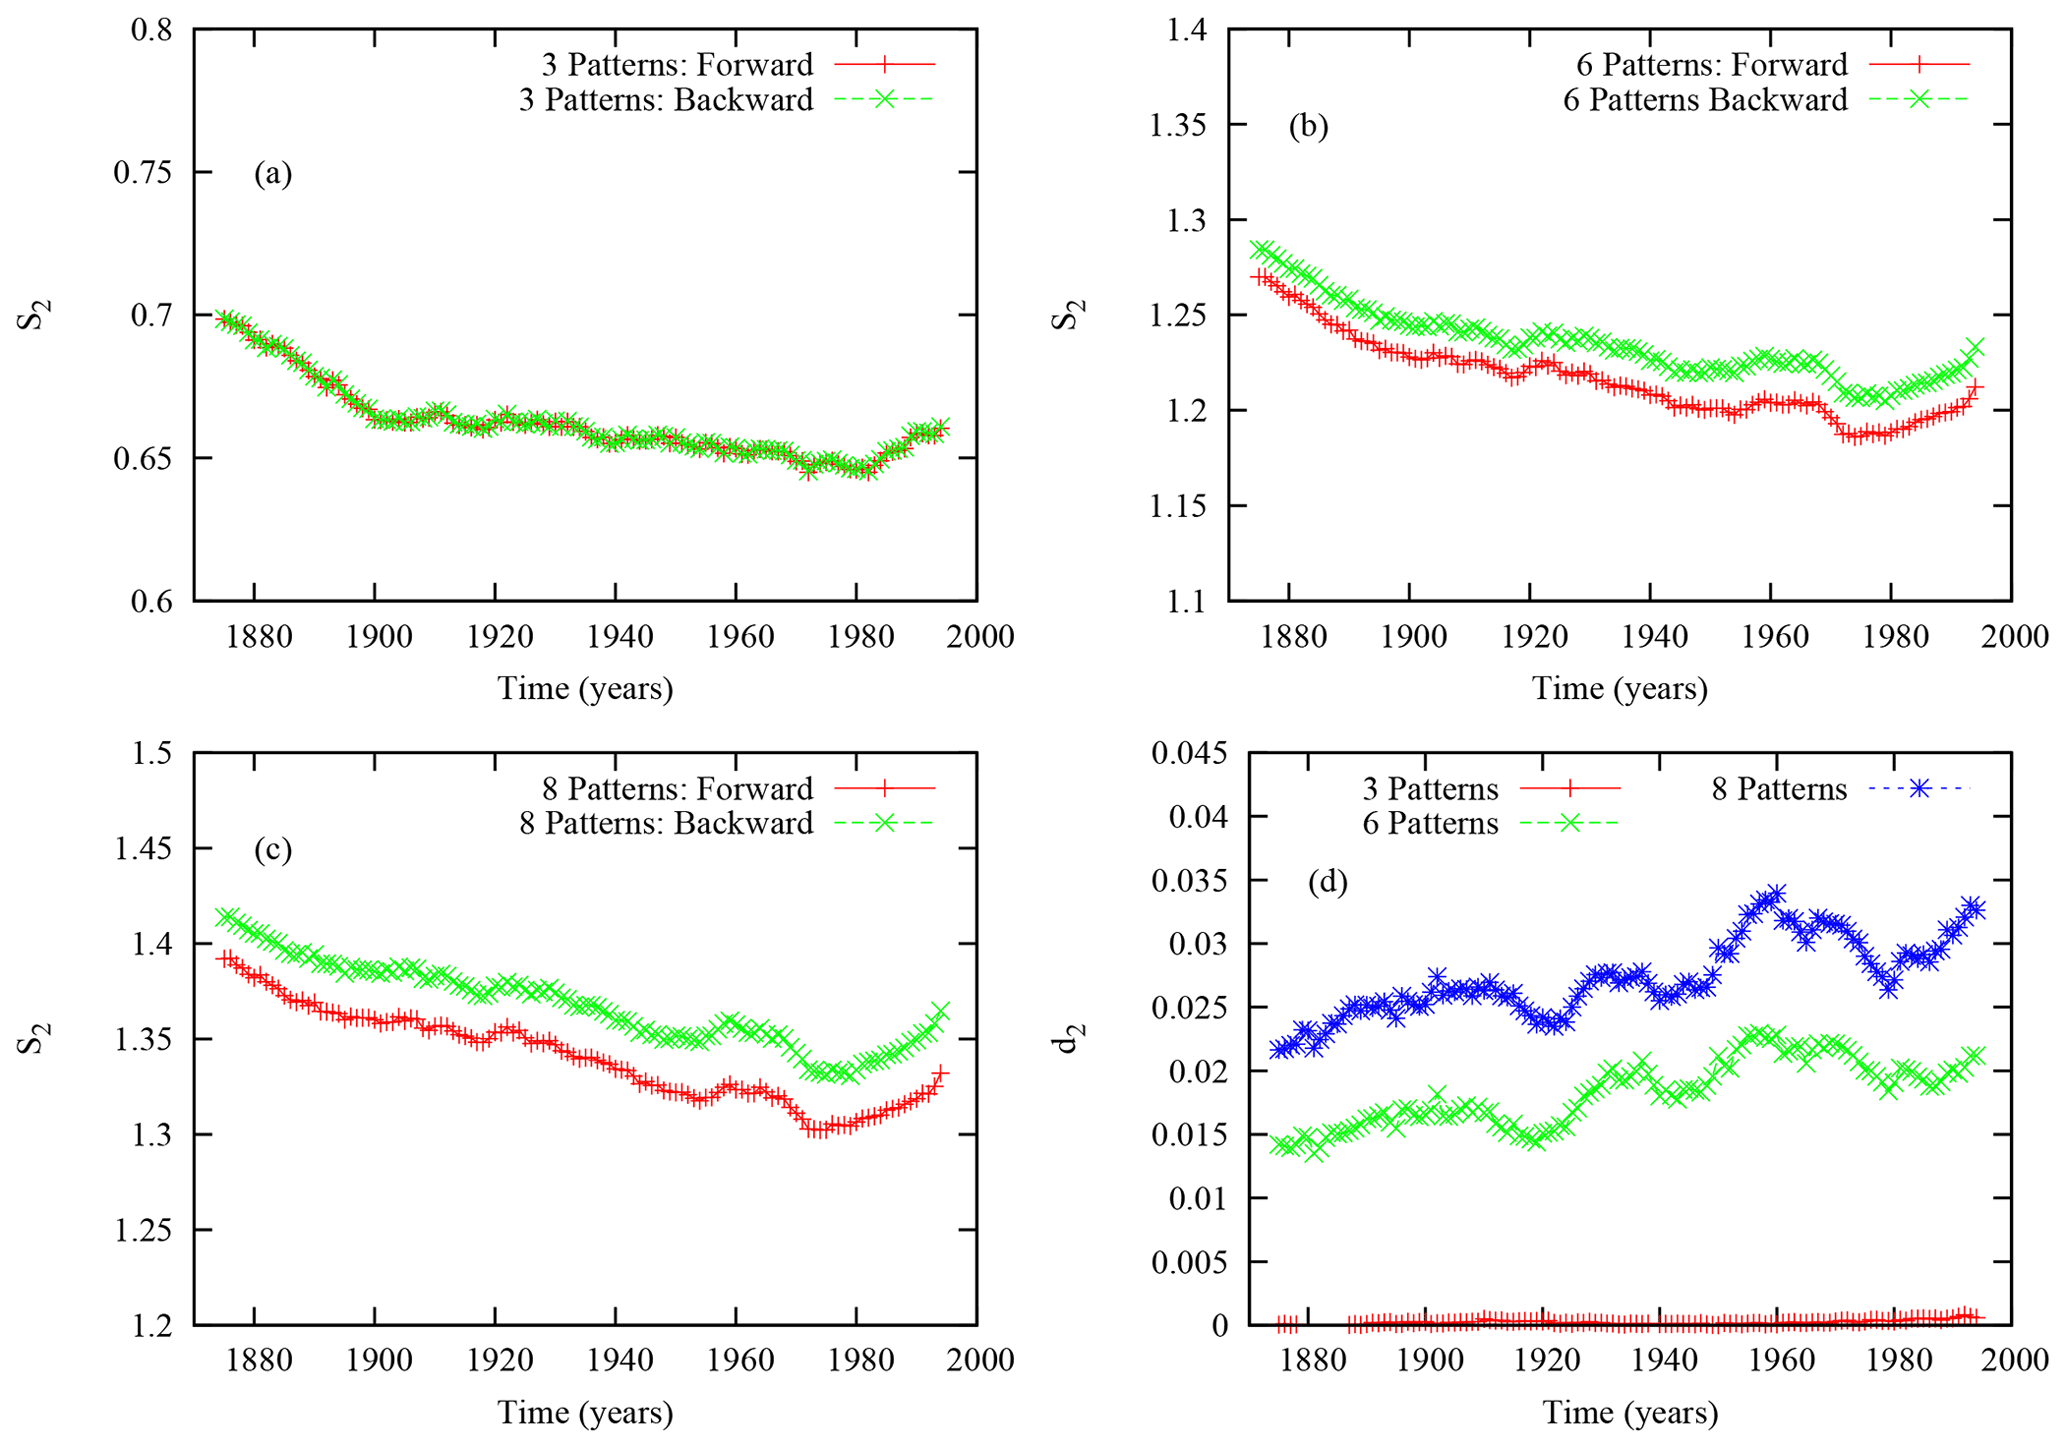
Figure 2Temporal evolution of forward and backward entropies, S2 and , for (a) three patterns, (b) six patterns, and (c) eight patterns. (d) The lower bound of the information entropy production, d2, for the three partitions.
4.1 Information entropy analysis of the observed data
The changes in the statistical and dynamical properties of the weather patterns are investigated through the analysis of the probabilities, the block entropies and the information entropy production as a function of time. It should be first assumed that the impact of climate change on the natural variability is slow, allowing one to consider that the statistical properties of the weather are stationary during a sufficiently long period. Here a sliding window of 50 years has been defined for the evaluation of the statistics, progressively moved forward in time. As the observation data start in 1850, the first period to consider is 1850–1899, which is then shifted forward in time every year. Note that the statistics will be associated (arbitrarily) with the 25th year of the window in the figures.
Figure 1 displays the probabilities for (a) three, (b) six, and (c) eight partitions as a function of time. A clear evolution in the probabilities is visible. χ2 tests of differences between the first and last values have been computed. The χ2 test of differences between the two distributions are 50, 176 and 214 for three, six and eight clusters, respectively. With their respective degrees of freedom of 2, 5 and 7, these values indicate that the two distributions are significantly different at a probability level much lower than 0.001. Panel d shows the evolution of the Shannon entropy for the three partitions. Here, however, the (static) information content does not change much as a function of time whatever the partition chosen.
The Shannon entropy, however, does not provide any information on the dynamics. Let us then turn to the dynamics of the weather patterns by investigating the two-state entropy, S2, providing information on the dynamics of the succession of pairs of patterns, together with the backward-in-time entropy, , for the three partitions of interest (Fig. 2). A first general remark is the fact that S2 is decreasing for most of the period and then slightly increases whatever the partition. This suggests that the information content decreases, with a less diverse set of pairs of events. When looking at the diagonal of the transition matrix, W(i|j), featuring the persistence from one day to the next, these conditional probabilities (for i=j) are increasing, while S2 is decreasing (not shown). This result suggests that the system becomes progressively more predictable and persistent during the historical period, except at the very end of the period.
In the same panels, is displayed, which would be larger than the S2 if a time asymmetry is present in the data (Gaspard, 2004; Andrieux et al., 2007). The amplitude of is indeed larger when considering the six-pattern and eight-pattern partitions, but not for the three-pattern partition. Considering the latter case first, this type of behavior suggests a time symmetry (or detailed balance) of the dynamical process generated by that partition, as for instance found in the analysis of different alphabets used to “read” the DNA in Provata et al. (2014). Whether this feature is due to the fact that the series is too short or to a very specific feature of this three-pattern partition remains to be explored.
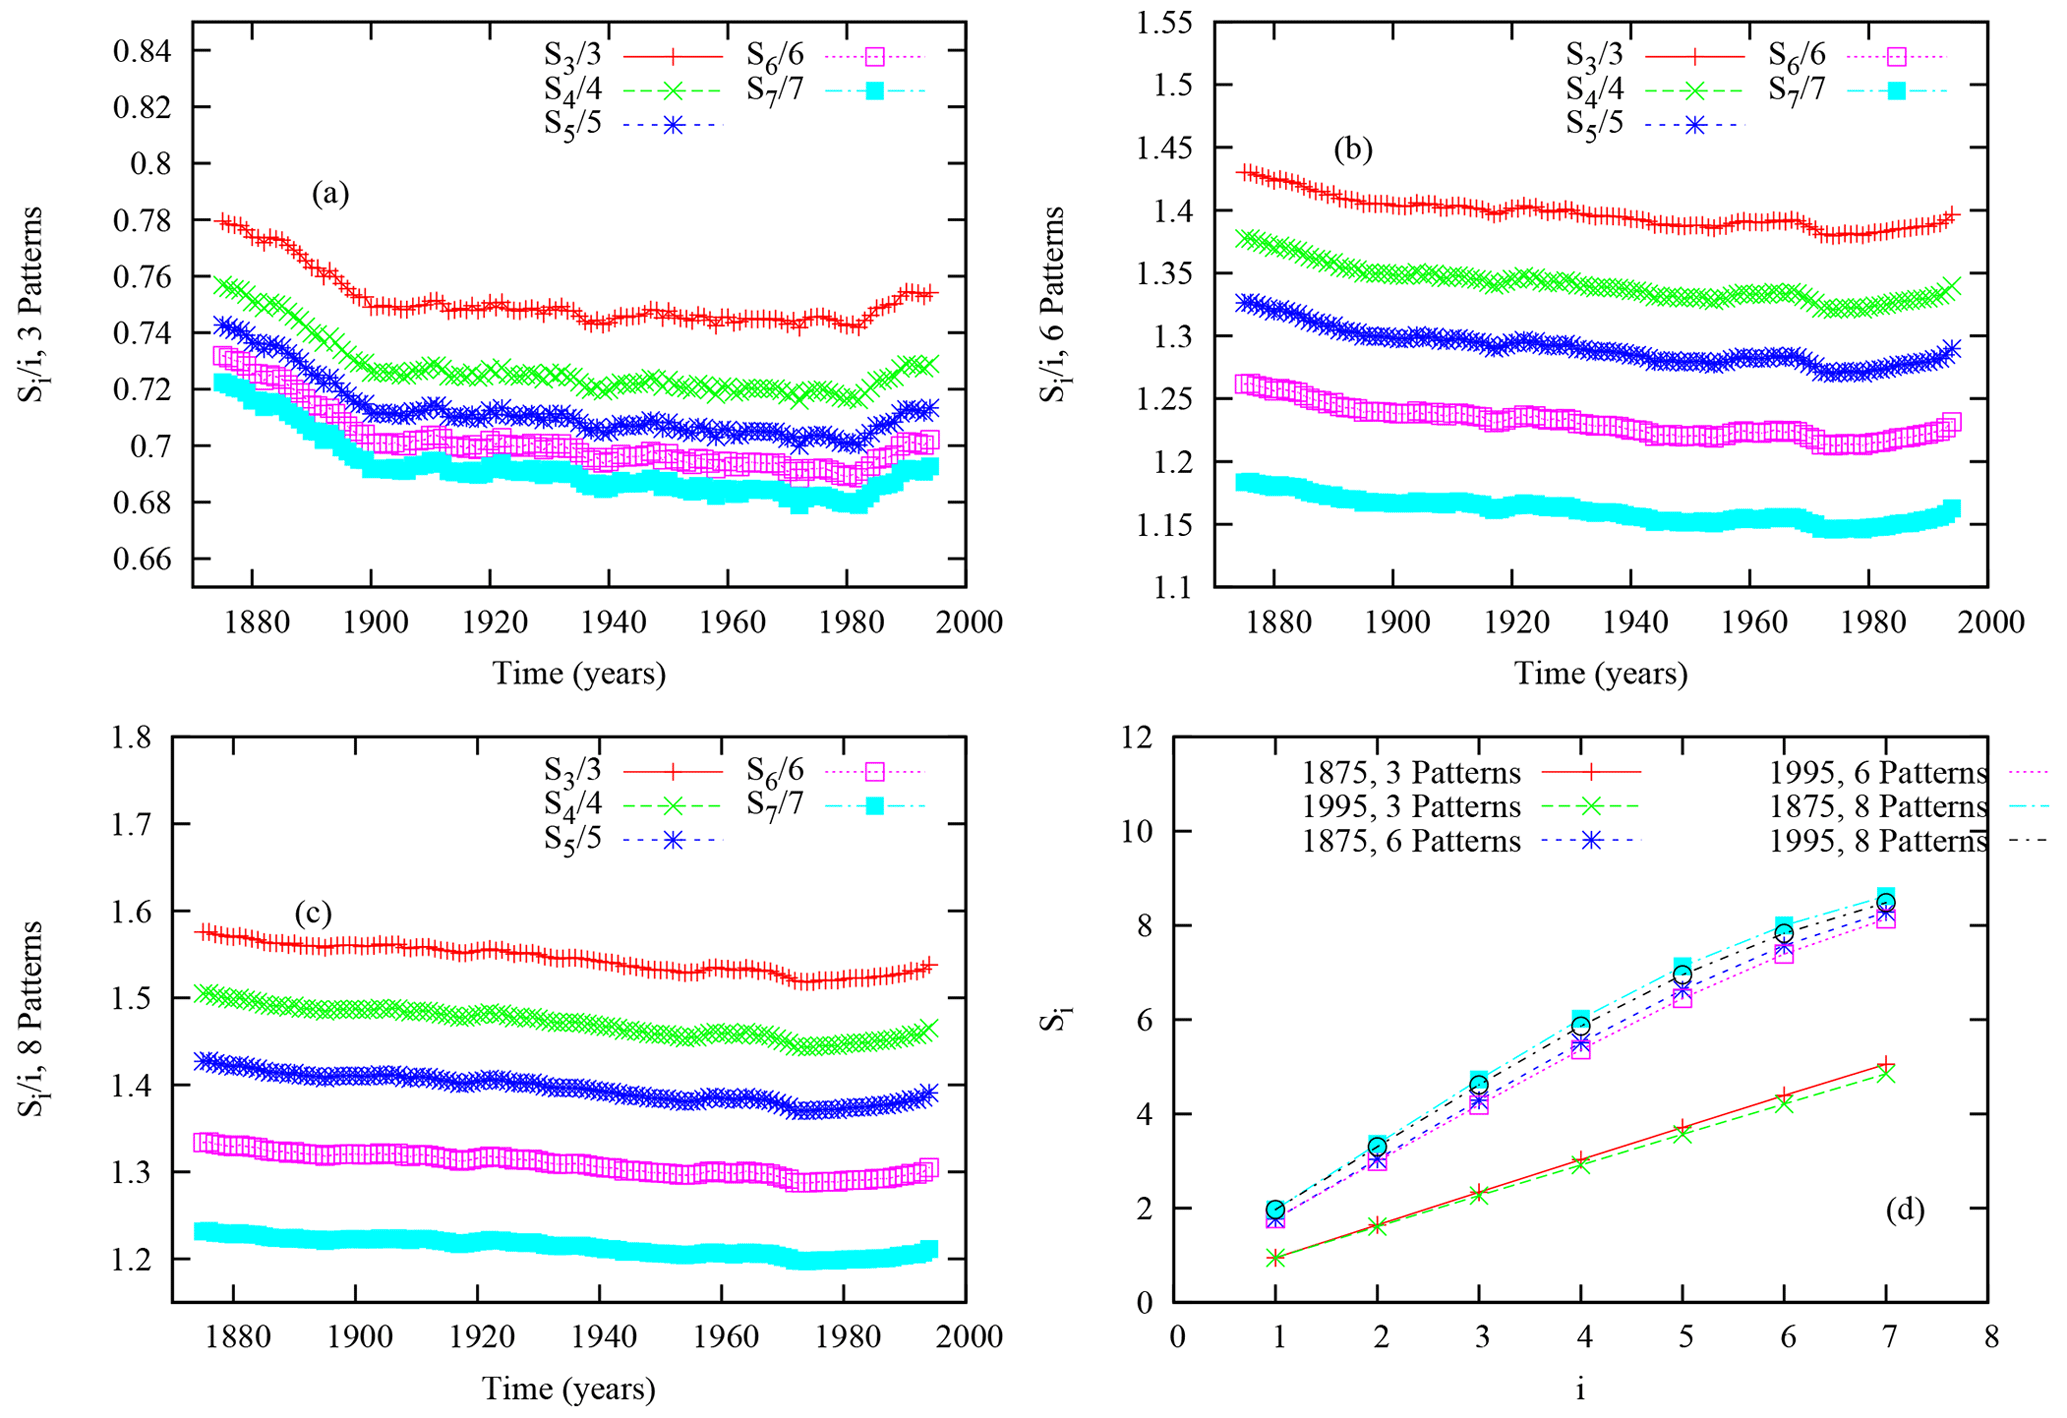
Figure 3Temporal evolution of normalized forward block entropies, , for (a) three regimes, (b) six regimes, and (c) eight regimes. (d) Dependencies of the block entropies as a function of the length of the words, i, for the three partitions for the initial and final windows of 50 years of the observation dataset.
For the former cases of six and eight patterns, the results are very interesting as the backward entropy is always much larger than the forward one, suggesting a time asymmetry related to the irreversibility of the process (Gaspard, 2004). This is further illustrated in Fig. 2d by the evolution of the difference between the backward and forward entropies, d2. Note that d2 shows an overall increase as a function of time. This would suggest an increase in the lower bound, d2, of the information entropy production over the North Atlantic. However, the trend is not reproduced when analyzing d3 associated with the joint probabilities of three successive weather patterns, questioning the validity of the trend found with d2. This type of analysis however suffers from a lack of data that can only be compensated for by investigating model runs. This point will be taken up further in the analysis of the UK Met Office models.
The analysis of the information entropies of pairs of events can be extended to longer blocks of symbols. In Fig. 3, a decrease is also experienced whatever the length of the blocks of symbols (until i=7 d), except in the last decades. This feature is going in the same direction as for S2, with an increase in the predictability of the system. An additional indication of that is the progressive decrease in the number of words (sequences of symbols) that are present in the window of 50 years as we move forward in time until the end of the time series (not shown). In other words, the diversity of possible sequences is decreasing during the historical period. In panel d, a different view of this evolution is displayed with the block entropy as a function of the length of the words at the beginning of the historical period and at the end, further illustrating the change.
The analysis reveals a drastic modification of the dynamics of the succession of weather patterns over the North Atlantic and western Europe, with an increase in predictability except at the end of the period. Is this feature a response to climate change or the presence of some low-frequency variability is not clear at this stage. Another aspect that could affect the statistics is the number and quality of the observations used. A natural conjecture would be to believe that the first part of the period is not much influenced by climate change and therefore could reflect a natural tendency of the system provided that the dynamics is not affected much by the number and quality of observations. This conjecture could be challenged, either by analysing weather pattern dynamics based on the same set of observation stations throughout the period or with long reference runs of models allowing one to clarify the impact of the low-frequency variability on the evolution of the dynamics of weather patterns.
4.2 Information entropy analysis of the UK Met Office model
Figures 4 and 5 show the entropy, S2, for the 15 model runs of the Met Office. The estimation based on the 15 realizations altogether is also shown (blue curve) together with the observations (red curve).
For RCP2.6, S2 shows a strong variability among the different realizations. One first remark is that S2 for the different partitions over the overlapping periods is generally larger for the model runs than for the observations. This suggests that fewer regularities are present in the dynamics of the model with less predictability. Moreover, it is not clear at this stage whether the large variability among the realizations is the impact of slightly different parameterizations within the model, a different possible realization of the dynamics starting from different initial states, or both.
For RCP8.5, a similar picture is found, except that S2 for most of the model runs shows larger values at the end of the 21st century.
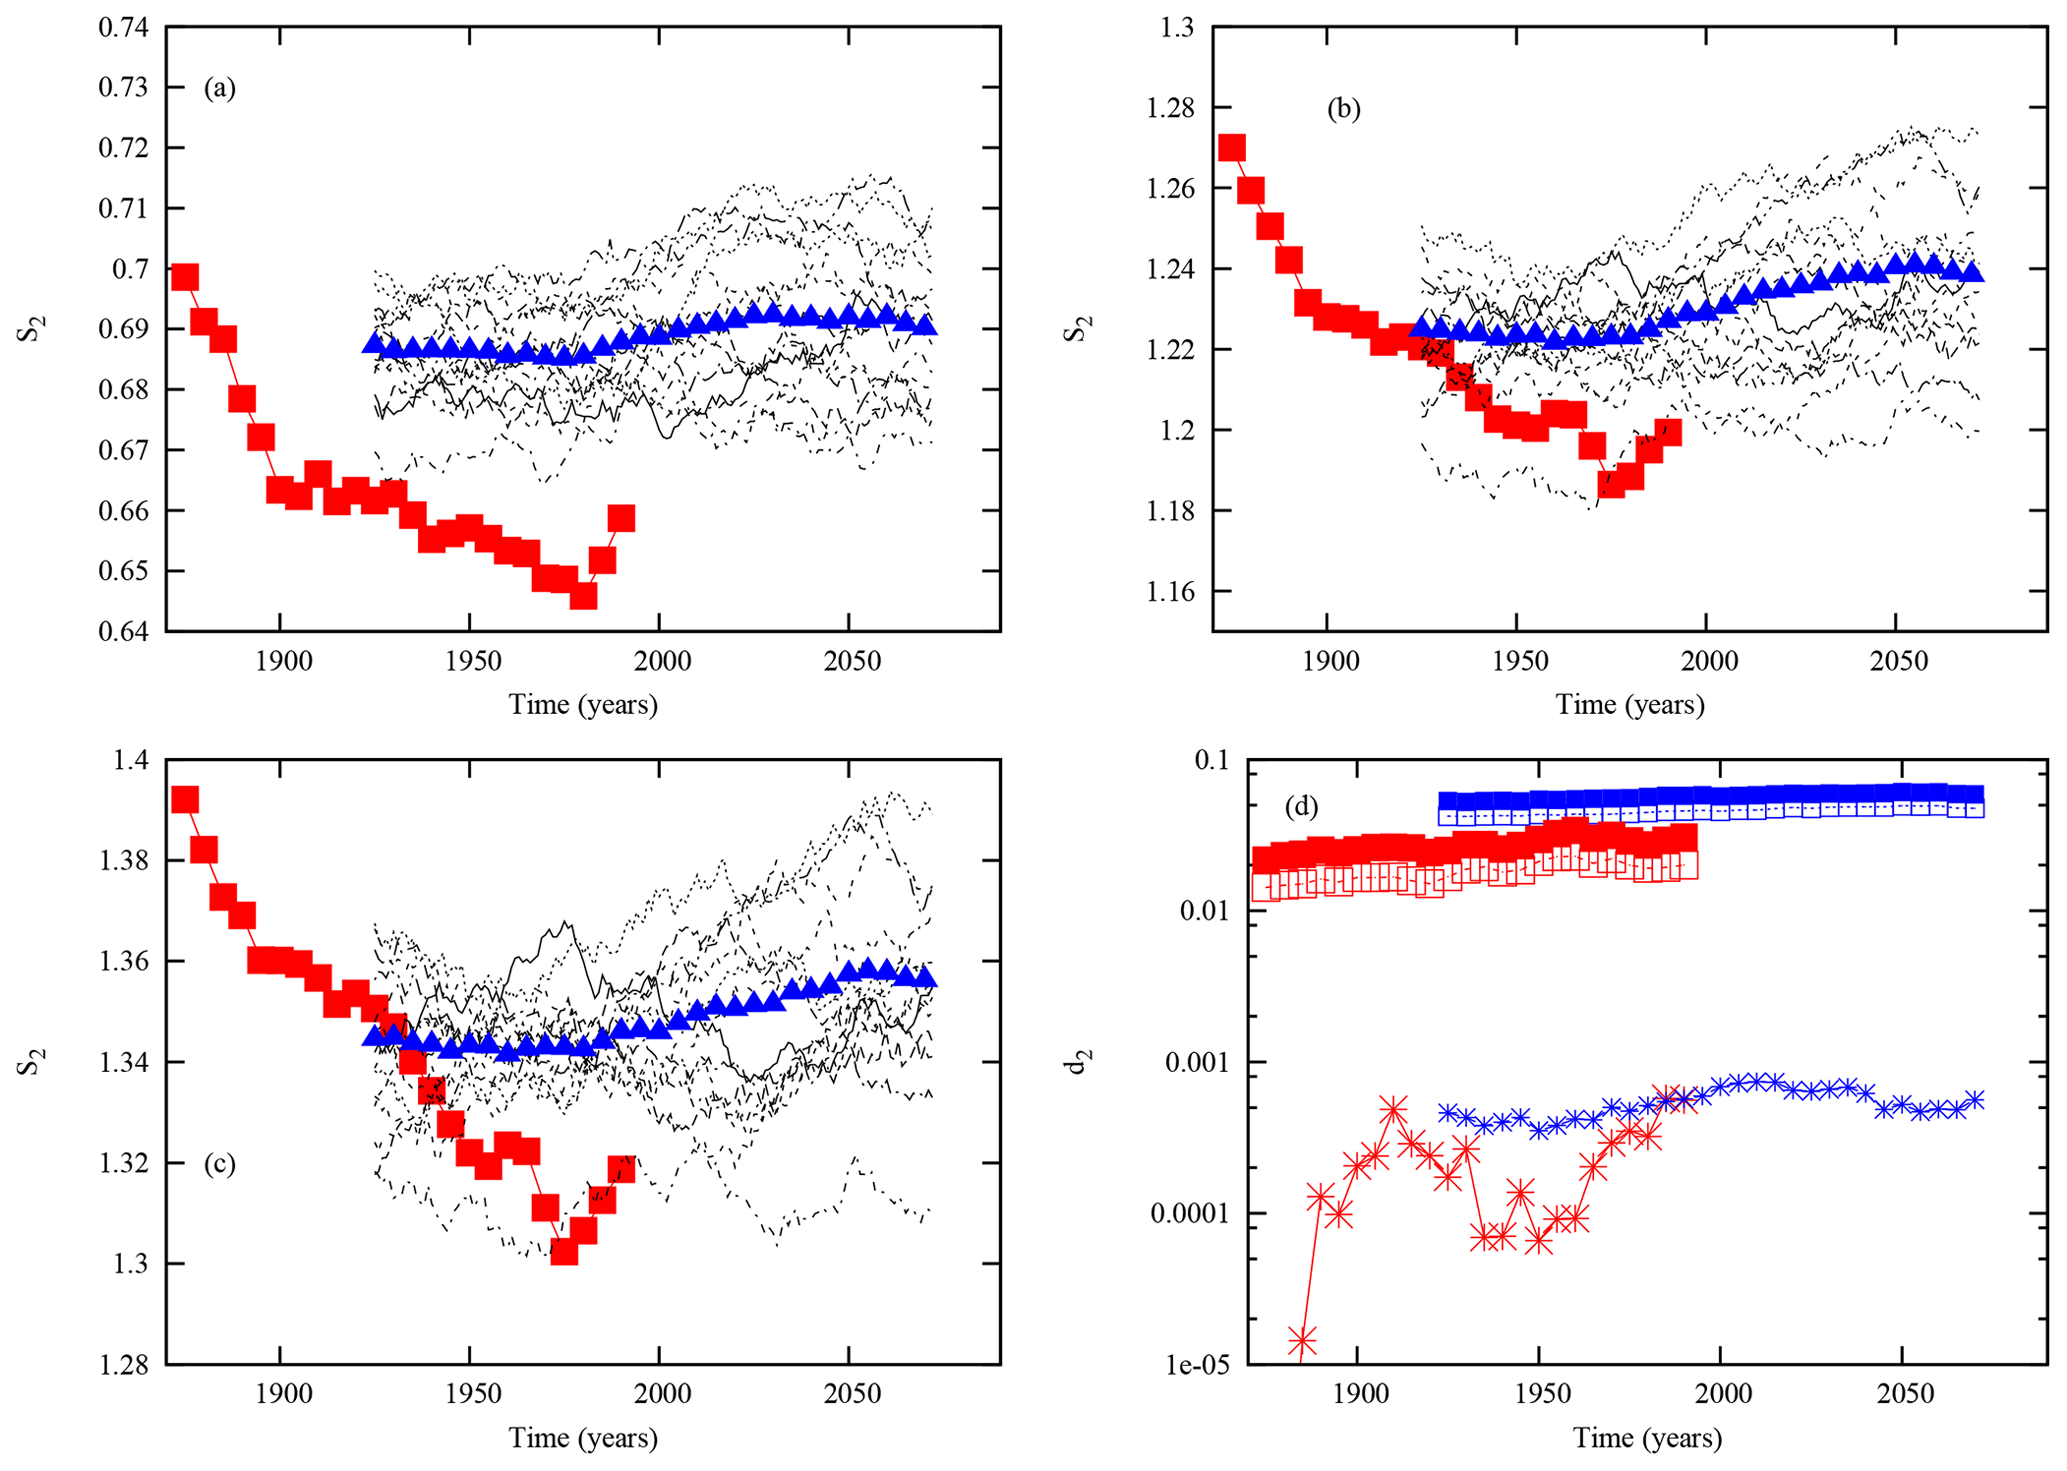
Figure 4Temporal evolution of S2 for the 15 model runs of the Met Office model from 1900 to 2099 under the RCP2.6 scenario (black lines), for (a) three patterns, (b) six patterns, and (c) eight patterns. The red curves represent the reference historical data and the blue triangle curve the average entropy over the 15 runs. (d) The lower bound of the information entropy production, d2, for the three regime partitions for the observations (red) and for the average information entropy production of the model runs (blue). The different symbols (star, open square, full square) correspond to the three partitions three, six and eight patterns, respectively.
In Figs. 4d and 5d, the evolution of the lower bound, d2, of the information entropy production of the model, combined over the 15 different model versions, and of the observations is displayed for the three partitions. The interesting message here is that d2 is larger in the model than in the observations. This feature is also present for d3 (not shown), which could reflect a larger information entropy production and degree of irreversibility than in reality.

Figure 5Temporal evolution of S2 for the 15 model runs of the Met Office model from 1900 to 2099 under the RCP8.5 scenario (black lines) for (a) three patterns, (b) six patterns, and (c) eight patterns. The red curves represent the reference historical data and the blue triangle curve the average entropy over the 15 runs. (d) The lower bound of the information entropy production, d2, for the three regime partitions for the observations (red) and for the average information entropy production of the model runs (blue). The different symbols (star, open square, full square) correspond to the three partitions three, six and eight patterns, respectively.

Figure 6Temporal evolution of the lower bounds of the entropy production d2, d3 and d4 combining the statistics of the 15 Met Office model versions, under (a) RCP2.6 and (b) RCP8.5.
Finally, in Fig. 6, d2, d3 and d4 are shown for both RCP scenarios. The larger bounds are not displayed as they show values smaller than the first three, in violation of their ordering, further indicating that the number of realizations is still not sufficient to provide reliable estimates of high-order joint probabilities. Interestingly, these three lower bounds are increasing as a function of time in both scenarios, suggesting that the information entropy production is also increasing as a function of time and hence the atmospheric irreversibility. Furthermore, there is a change in the rate of increase in the lower bounds for one scenario or the other. In the case of RCP8.5, the increase is faster around 2030 (corresponding to the period 2010–2050), indicating an acceleration of the change in information entropy production.
These remarkable results suggest that the information entropy production in the North Atlantic will considerably change depending on the type of scenario the Earth climate system will follow. As the information entropy production is related to irreversibility of the dynamics, one may conjecture that production of heat and dissipation of the underlying dynamics will also increase substantially for large increases in the greenhouse gases. This is corroborated by works that have been done on the increase in dissipation on the North Atlantic region (Coumou and Rahmstorf, 2012) and (physical) entropy production in general in climate models under climate change (Lucarini et al., 2010, 2011; Lembo et al., 2019; Kanno and Iwasaki, 2022).
The dynamics of weather patterns over the North Atlantic under climate change is explored from the perspective of information theory with a focus on information entropy and its production. The weather patterns are the ones defined by the Met Office (Neal et al., 2016), on which both the observations starting in 1850 and the model projections from 1900 to 2099 are projected. Three sets of weather pattern partitions are used, 3, 6 and 8.
The first key message conveyed by this analysis is the overall decrease in the information entropy in the observations, except at the end of the period. This decrease indicates that the predictability increased during the historical period, with a slight decrease at the end. One key question is now to know whether this evolution is directly related to climate change, to a natural low-frequency variability, or even to the change in the observational system over the North Atlantic. This question will be addressed in the future.
To further clarify the role of climate change in the evolution of the information entropy, the UK Met Office climate model runs under two climate scenarios, RCP2.6 and RCP8.5, were explored. The analysis of the Met Office climate model indicates that the information entropy is for most of the realizations larger than the one of the observations, suggesting a lower predictability in the model. At the same time, all the realizations suggest that the information entropy will be larger by the end of the 21st century, further suggesting a decrease in weather pattern predictability.
The lower bounds of the information entropy production have been computed for both the observations and the model runs. For the observations, an increase of d2 is found during the historical period, but the limited number of data do not allow us to confirm this with the other bounds. For the model runs, these bounds are increasing as a function of time with a rate that depends on the specific scenario chosen, indicating an increase in the degree of irreversibility. Overall, the information entropy production increases by a factor of 10 % in the RCP2.6 scenario and a factor of 30 %–40 % in the RCP8.5 one as compared to the beginning of the 20th century. This further allows us to make the conjecture that heat production and dissipation associated with the emergence of irreversibility are increasing with climate change, corroborating earlier findings (Lucarini et al., 2010; Coumou and Rahmstorf, 2012; Lembo et al., 2019; Kanno and Iwasaki, 2022). As the rate of increase is much larger in the RCP8.5 scenario than in the RCP2.6 one, a further increase in heat production and dissipation should be expected under RCP8.5.
The novel approach of evaluating the (physical) entropy production based on coarse-grained time series at the microscopic level proposed by Gomez-Marin et al. (2008), Roldán and Parrondo (2010), and Roldán and Parrondo (2012) offers an important opportunity to estimate experimentally this quantity. However, when dealing with the dynamics of a macroscopic system like the atmosphere, the connection between the information entropy production, the physical entropy production, dissipation and global constraints is still missing. The possibility offered by these advances however opens the way to improve our knowledge of the dynamics of the climate system, provided appropriate research is done in that direction.
The current model analysis is based on a set of slightly different model versions of the UK Met Office model. These differences could bias the estimates. A natural extension will be to explore large ensembles of a single model and to explore different models of the CMIP class.
The Markovian nature of the dynamics can provide considerable simplifications in the description of coarse-grained dynamics. It is however now well known that lumping continuous state-space variables into a set of discrete states does not lead in general to a Markov dynamics (Nicolis and Nicolis, 2012). To check the Markovian character of the dynamics, statistical tests can be performed. A test of the order of Markovianity has been proposed by Bilingsley (1961) and used in Provata et al. (2014). This is a χ2 test under the hypothesis that the Markov chain is of order r:
with a number of degrees of freedom of
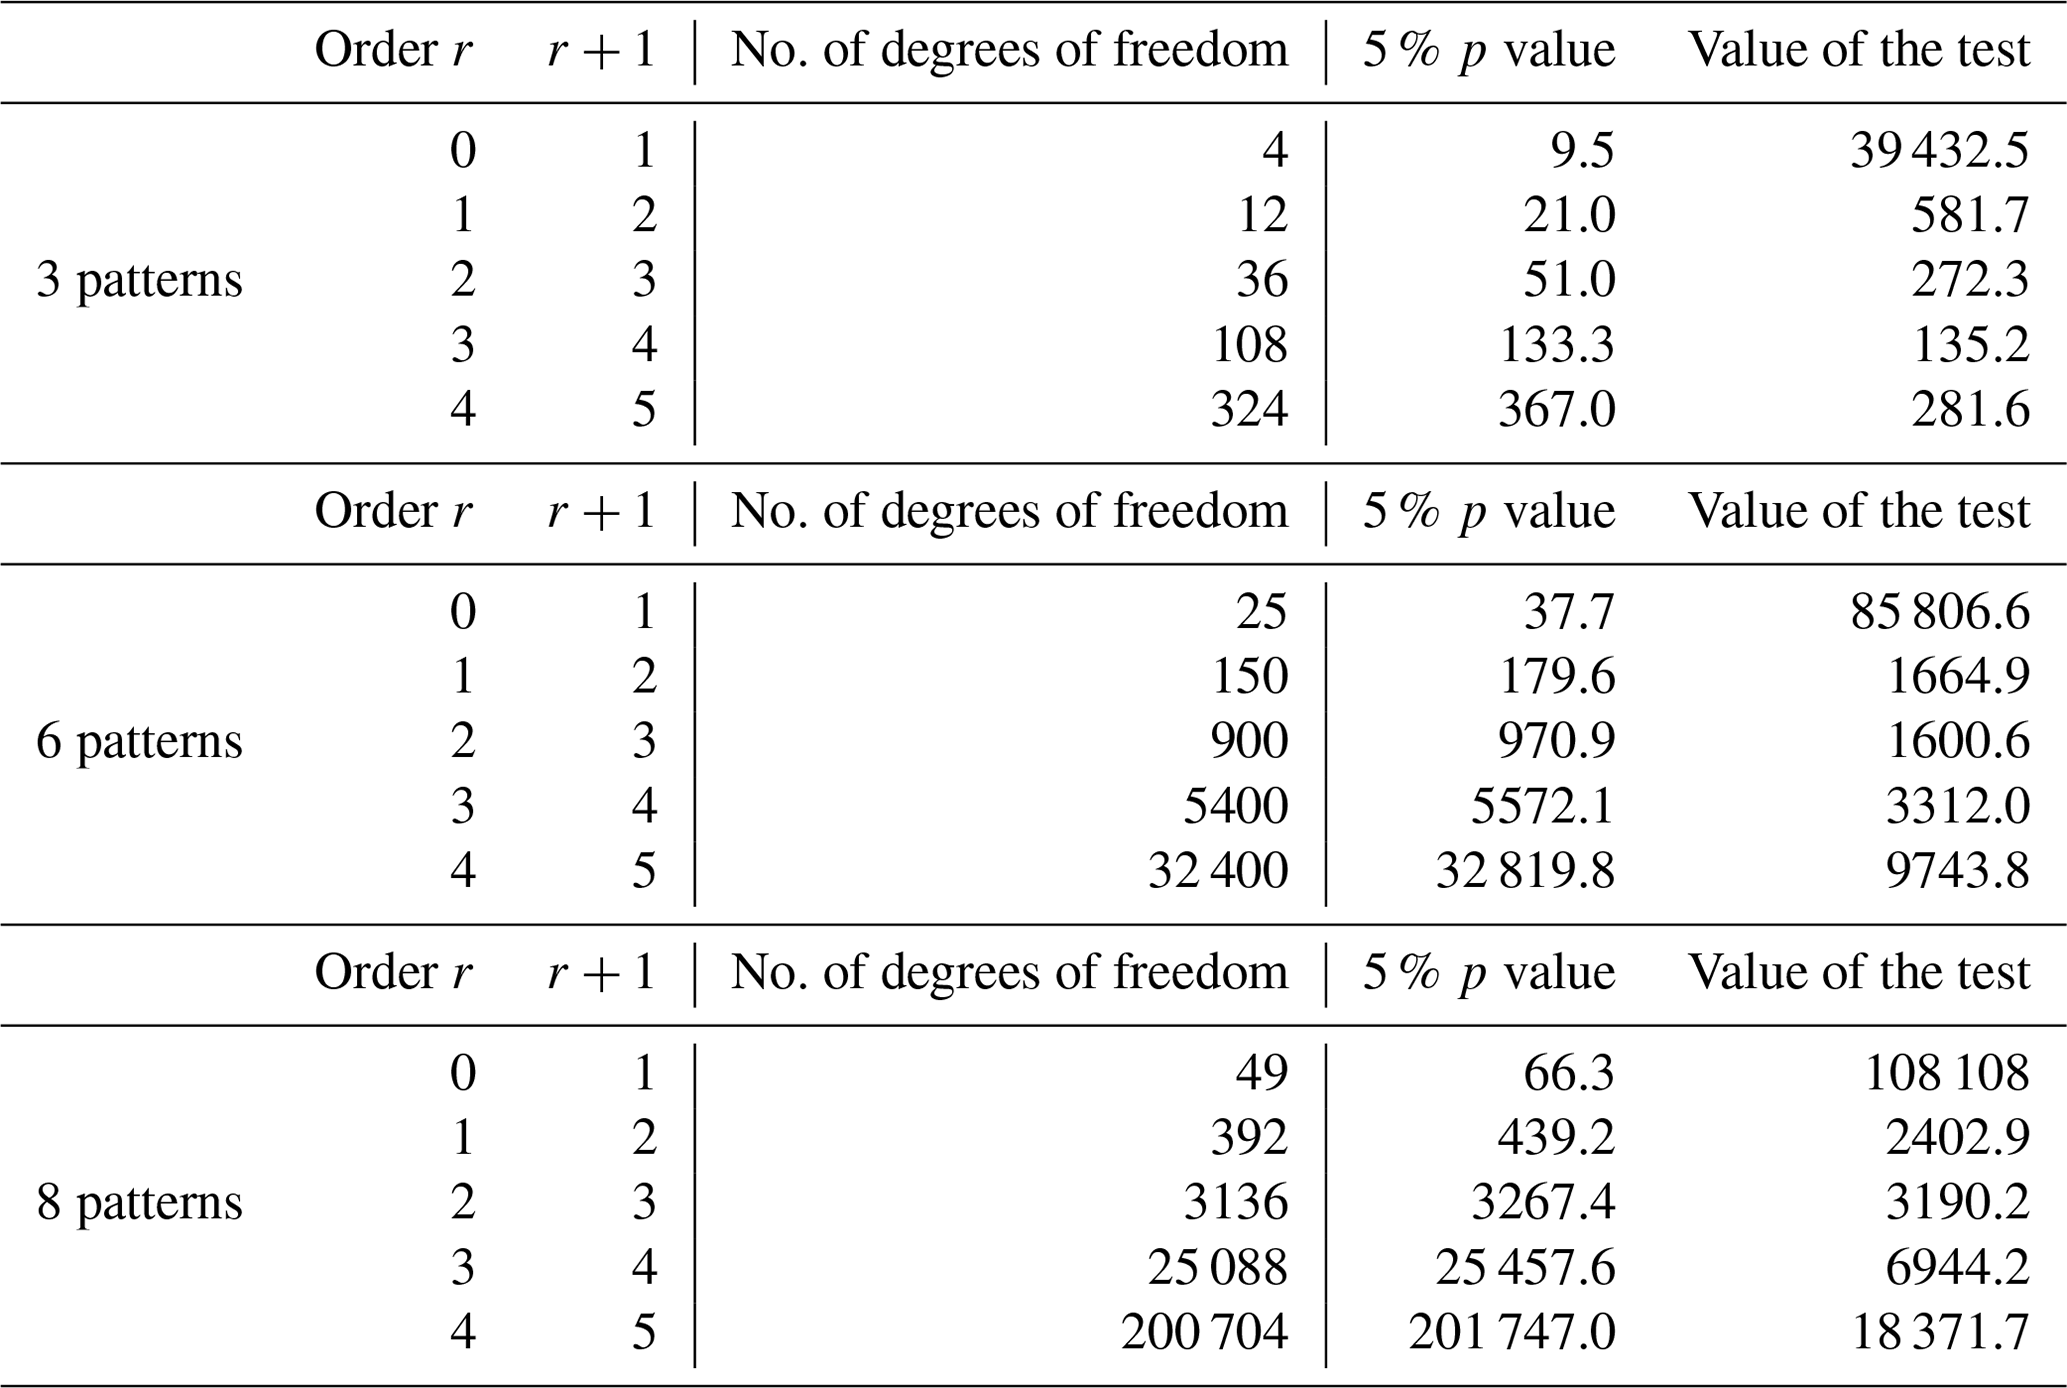
where N is the number of successive times in the series, , the entries of the transition matrix from the path to the new symbol is. The null hypothesis of the test is to assume that the process is Markov of order r. If the statistics of the test are larger than a certain threshold fixed by the level of confidence, then the null hypothesis is rejected. The test is applied to the data at our disposal with a level of confidence of 5 %.
The test has been used for the three, six and eight patterns defined in Sect. 3. The results are shown in Table 1 for the observations.
This table indicates that whatever the number of patterns used here, they cannot be represented as first-order Markov processes. It is however interesting to note that when the number of patterns increases, the order of the Markov process needed to represent properly the dynamics seems to decrease. This particular feature has however to be taken with caution as the computation of the probabilities of large blocks of symbols and with a large number of patterns needs a large number of data much larger than the one currently at our disposal. A similar analysis has been performed for the different model runs with similar conclusions.
Table A1Test χ2 for three, six and eight weather patterns for the series of observations. The first two columns represent the two Markov orders that are compared. The third column contains the number of degrees of freedom of the test. The fifth and sixth columns contain the p value of the test at the 5 % level and the actual value of the test. If the actual value is smaller than the p value, the order r is considered the order of the Markov chain necessary to describe the dynamics of the weather patterns.
The observation data set of the historical classifications are available on request to the Met Office. Part of it can also be found on the Pangaea website at https://doi.org/10.1594/PANGAEA.942896 (Neal, 2022). The UK Met Office Global model data used in this study are all available from the Centre for Environmental Data Analysis http://data.ceda.ac.uk/badc/ukcp18/data (Met Office Hadley Centre, 2023).
The author is a member of the editorial board of Nonlinear Processes in Geophysics. The peer-review process was guided by an independent editor, and the author also has no other competing interests to declare.
Publisher's note: Copernicus Publications remains neutral with regard to jurisdictional claims in published maps and institutional affiliations.
This work considerably benefited from discussions with Catherine Nicolis and Pierre Gaspard. Pierre Gaspard drew the attention of the author to the references of Roldán and Parrondo (2010) and Roldán and Parrondo (2012), which helped a lot in shaping the current findings. We also thank Robert Neal and James Pope from the UK Met Office for providing the data on 25 August 2021, respectively, together with detailed information on their construction.
This paper was edited by Stefano Pierini and reviewed by two anonymous referees.
Allen, S.: Advanced statistical post-processing of ensemble weather forecasts, PhD thesis, University of Exeter, http://hdl.handle.net/10871/126003 (last access: 2 January 2023), 2021. a, b
Andrieux, D., Gaspard, P., Ciliberto, S., Garnier, N., Joubaud, S., and Petrosyan, A.: Entropy production and time asymmetry in nonequilibrium fluctuations, Phys. Rev. Lett., 98, 150601, https://doi.org/10.1103/PhysRevLett.98.150601, 2007. a, b, c
Barry, R. G. and Perry, A. H.: Synoptic climatology: methods and applications. Methuen and Co. Ltd, 555 pp., 1973. a
Basios, V., Oikonomou, Th., and De Gernier, R.: Symbolic dynamics of music from Europe and Japan, Chaos, 31, 053122, https://doi.org/10.1063/5.0048396, 2021. a
Bilingsley, P.: Statistical methods in Markov chains, Ann. Math. Stat., 32, 12–40, https://doi.org/10.1214/aoms/1177705136, 1961. a
Corti, S., Molteni, F., and Palmer, T. N.: Signature of recent climate change in frequencies of natural atmospheric circulation regimes, Nature, 398, 799–802, https://doi.org/10.1038/19745, 1999. a
Coumou, D. and Rahmstorf, S.: A decade of weather extremes, Nat. Clim. Change, 2, 491–496, https://doi.org/10.1038/nclimate1452, 2012. a, b
Daems, D. and Nicolis, G.: Entropy production and phase space volume contraction. Phys. Rev. E, 59, 4000, https://doi.org/10.1103/PHYSREVE.59.4000, 1999. a
Davini, P., and D'Andrea, F.: From CMIP3 to CMIP6: Northern Hemisphere Atmospheric Blocking Simulation in Present and Future Climate, J. Climate, 33, 10021–10038, https://doi.org/10.1175/jcli-d-19-0862.1, 2020. a
Fabiano, F., Christensen, H. M., Strommen, K., Athanasiadis, P., Baker, A., Schiemann, R., and Corti, S.: Euro-Atlantic weather Regimes in the PRIMAVERA coupled climate simulations: impact of resolution and mean state biases on model performance, Clim. Dynam., 54, 5031–5048, https://doi.org/10.1007/s00382-020-05271-w, 2020. a
Franzke, C., Woollings, T., and Martius, O.: Persistent Circulation Regimes and Preferred Regime Transitions in the North Atlantic, J. Atmos. Sci., 68, 2809–2825, https://doi.org/10.1175/JAS-D-11-046.1, 2011.
Gardiner, C.: Handbook of Stochastic Methods: For Physics, Chemistry and the Natural Sciences, Springer, 415 pp., 2004. a
Gaspard, P.: Time-reversed Dynamical Entropy and Irreversibility, J. Stat. Phys., 117, 599–615, https://doi.org/10.1007/s10955-004-3455-1, 2004. a, b, c, d, e, f
Ghil, M., and Lucarini, V.: The physics of climate variability and climate change, Rev. Modern Phys., 92, 035002, https://doi.org/10.1103/RevModPhys.92.035002, 2020. a
Gomez-Marin, A., Parrondo, J. M. R., and Van den Broeck, C.: Lower bounds on dissipation upon coarse graining, Phys. Rev. E, 78, 011107, https://doi.org/10.1103/physreve.78.011107, 2008. a, b, c, d
Hannachi, A., Straus, D. M., Franzke, C. L. E., Corti, S., and Woollings, T.: Low-frequency nonlinearity and regime behavior in the Northern Hemisphere extratropical atmosphere, Rev. Geophys., 55, 199–234, https://doi.org/10.1002/2015RG000509, 2017. a
Hébert, R. and Lovejoy, S.: Regional climate sensitivity- and historical-based projections to 2100, Geophys. Res. Lett., 45, 4248–4254, https://doi.org/10.1002/2017GL076649, 2018. a
Hess, P. and Brezowsky, H.: Katalog der Grosswetterlagen Europas, Berichte des Deutschen Wetterdienstes in der US-Zone 33, 68 pp., 1952. a
IPCC: Climate Change 2021: The Physical Science Basis. Contribution of Working Group I to the Sixth Assessment Report of the Intergovernmental Panel on Climate Change, edited by: Masson-Delmotte, V., Zhai, P., Pirani, A., Connors, S. L., Péan, C., Berger, S., Caud, N., Chen, Y., Goldfarb, L., Gomis, M. I., Huang, M., Leitzell, K., Lonnoy, E., Matthews, J. B. R., Maycock, T. K., Waterfield, T., Yelekçi, O., Yu, R., and Zhou, B., Cambridge University Press, Cambridge, United Kingdom and New York, NY, USA, 2391 pp., https://doi.org/10.1017/9781009157896, 2021. a, b
Kanno, Y. and Iwasaki, T.: Future changes of atmospheric energy cycle in CMIP5 climate models, J. Geophys. Res.-Atmos., 127, e2021JD036380, https://doi.org/10.1029/2021JD036380, 2022. a, b
Lembo, V., Lunkeit, F., and Lucarini, V.: TheDiaTo (v1.0) – a new diagnostic tool for water, energy and entropy budgets in climate models, Geosci. Model Dev., 12, 3805–3834, https://doi.org/10.5194/gmd-12-3805-2019, 2019. a, b
Lovejoy, S.: Scaling fluctuation analysis and statistical hypothesis testing of anthropogenic warming, Clim. Dynam., 42, 2339–2351, https://doi.org/10.1007/s00382-014-2128-2, 2014. a
Lucarini, V., Fraedrich, K., and Lunkeit, F.: Thermodynamics of climate change: generalized sensitivities, Atmos. Chem. Phys., 10, 9729–9737, https://doi.org/10.5194/acp-10-9729-2010, 2010. a, b
Lucarini, V., Fraedrich, K., and Ragone, F.: New Results on the Thermodynamic Properties of the Climate System, J. Atmos. Sci., 68, 2438–2458, https://doi.org/10.1175/2011JAS3713.1, 2011. a
Met Office Hadley Centre (MOHD): UKCP Global (60 km) – European Circulation Indices, Centre for Environmental Data Analysis (CEDA), http://data.ceda.ac.uk/badc/ukcp18/data, last access: 3 January 2023. a
Michel, C. and Rivière, G.: The Link between Rossby Wave Breakings and Weather Regime Transitions, J. Atmos. Sci., 68, 1730–1748, https://doi.org/10.1175/2011JAS3635.1, 2011. a
Neal, R.: Daily historical weather pattern classifications for the UK and surrounding European area (1950 to 2020), PANGAEA [data set], https://doi.org/10.1594/PANGAEA.942896, 2022. a
Neal, R., Fereday, D., Crocket, R., and Comer, R.: A flexible approach to defining weather patterns and their application in weather forecasting over Europe, Meteorol. Appl., 23, 389–400, https://doi.org/10.1002/met.1563, 2016. a, b, c, d, e, f, g, h
Nicolis, C., Ebeling, W., and Baraldi, C.: Markov processes, dynamic entropies and the statistical prediction of mesoscale weather regimes, Tellus A, 49, 108–118, https://doi.org/10.3402/TELLUSA.V49I1.12215, 1997. a, b
Nicolis, G. and Nicolis, C.: Foundations of Complex Systems, World Scientific, Singapore, https://doi.org/10.1142/8260, 2012. a, b, c, d, e
Pan Y., Li, L., Jiang, X., Li, G., Zhang, W., Wang, X., and Ingersoll, A. P.: Earth's changing global atmospheric energy cycle in response to climate change, Nat. Commun., 8, 14367, https://doi.org/10.1038/ncomms14367, 2017.
Plaut, G. and Simonnet, E.: Large-scale circulation classification, weather regimes, and local climate over France, the Alps and Western Europe, Clim. Res., 17, 303–324, 2001. a
Pope, J. O., Brown, K., Fung, F., Hanlon, H. M., Neal, R., Palin, E. J., and Reid, A.: Investigation of future climate change over the British Isles using weather patterns, Clim. Dynam., 58, 2405–2419, https://doi.org/10.1007/s00382-021-06031-0, 2022. a, b, c, d, e
Provata, A., Nicolis, C., and Nicolis, G.: DNA viewed as an out-of-equilibrium structure, Phys. Rev. E, 89, 052105, https://doi.org/10.1103/PhysRevE.89.052105, 2014. a, b, c
Richardson, D., Kilsby, C. G., Fowler, H. J., and Bárdossy, A.: Weekly to multi-month persistence in sets of daily weather patterns over Europe and the North Atlantic Ocean, Int. J. Climatol., 39, 2041–2056, https://doi.org/10.1002/joc.5932, 2018. a
Roldán, E. and Parrondo, J. M. R.: Estimating Dissipation from Single Stationary Trajectories, Phys. Rev. Lett., 105, 150607, https://doi.org/10.1103/PhysRevLett.105.150607, 2010. a, b, c, d, e
Roldán, E. and Parrondo, J. M. R.: Entropy production and Kullback-Leibler divergence between stationary trajectories of discrete systems, Phys. Rev. E, 85, 031129, https://doi.org/10.1103/PhysRevE.85.031129, 2012. a, b, c, d, e
Sexton, D. M. H., McSweeney, C. F., Rostron, J. W., Yamazaki, K., Booth, B. B. B., Murphy, J. M., Regayre, L., Johnson, J. S., and Karmalkar, A. V.: A perturbed parameter ensemble of HadGEM3-GC3.05 coupled model projections: part 1: selecting the parameter combinations, Clim. Dynam., 56, 3395–3436, https://doi.org/10.1007/s00382-021-05709-9, 2021. a
Shannon, C. E.: Prediction and entropy of printed English, Bell Syst. Tech. J., 30, 50–64, https://doi.org/10.1002/j.1538-7305.1951.tb01366.x, 1951. a
Vannitsem, S.: Toward a phase-space cartography of the short- and medium-range predictability of weather regimes, Tellus A, 53, 56–73, https://doi.org/10.1034/j.1600-0870.2001.01160.x, 2001. a
Vannitsem, S.: Predictability of large-scale atmospheric motions: Lyapunov exponents and error dynamics, Chaos, 27, 032101, https://doi.org/10.1063/1.4979042, 2017. a