the Creative Commons Attribution 4.0 License.
the Creative Commons Attribution 4.0 License.
 | 15 Feb 2021
Application of Lévy processes in modelling (geodetic) time series with mixed spectra
Jean-Philippe Montillet
Xiaoxing He
Changliang Xiong
Recently, various models have been developed, including the fractional Brownian motion (fBm), to analyse the stochastic properties of geodetic time series together with the estimated geophysical signals. The noise spectrum of these time series is generally modelled as a mixed spectrum, with a sum of white and coloured noise. Here, we are interested in modelling the residual time series after deterministically subtracting geophysical signals from the observations. This residual time series is then assumed to be a sum of three stochastic processes, including the family of Lévy processes. The introduction of a third stochastic term models the remaining residual signals and other correlated processes. Via simulations and real time series, we identify three classes of Lévy processes, namely Gaussian, fractional and stable. In the first case, residuals are predominantly constituted of short-memory processes. The fractional Lévy process can be an alternative model to the fBm in the presence of long-term correlations and self-similarity properties. The stable process is here restrained to the special case of infinite variance, which can be only satisfied in the case of heavy-tailed distributions in the application to geodetic time series. Therefore, the model implies potential anxiety in the functional model selection, where missing geophysical information can generate such residual time series.
- Article
(1094 KB) - Full-text XML
-
Supplement
(4798 KB) - BibTeX
- EndNote


Among the geodetic data, Global Navigation Satellite System (GNSS) time series have been of particular interest for the study of geophysical phenomena at regional and global scales (e.g. study of the crustal deformation due to large earthquakes and sea level rise; Bock and Melgare, 2016; Herring et al., 2016; He et al., 2017). These time series provide the estimated daily positions of the receiver coordinates. The position vector of a station can be decomposed in a geocentric Cartesian axis system or in a local or topocentric Cartesian axis system (E, N, and U) in which the axes point east, north, and up. These coordinates are influenced by the sum of three displacement modes (distinct classes of motion) that describe the progressive ground motion, any instantaneous jumps in position, and periodic or cyclic displacements. The progressive ground motion is generally referred to as the tectonic rate. Jumps include coseismic offsets, which are real movements of the ground, and artificial offsets, associated either with changes in the GNSS antenna and/or its radome or changes in the antenna monument, etc. Nearly all GNSS time series exhibit a seasonal cycle of displacement which can be modelled as a Fourier series. These cycles are caused by seasonal changes in the water, snow, and ice loads supported by the solid earth or (less commonly) by seasonal changes in atmospheric pressure. Therefore, the model associated with each class of motion (or geophysical signals) is here defined as a functional model following Bevis and Brown (2014) and Montillet and Bos (2019, chap. 1). Furthermore, these time series contain white noise and coloured noise. To model the different noise components, a stochastic noise model is defined. To name a few, previous choices include the first order Gauss–Markov (FOGM) model, the white noise with power-law noise, including flicker noise (Williams, 2003; Williams et al., 2004), the generalized Gauss–Markov (GGM) noise model, or the band-pass noise (Langbein, 2008; Langbein and Svarc, 2019). The scientific community agrees with the existence of a trade-off in estimating both the stochastic and functional models (He et al., 2017). More precisely, the choice of the stochastic model directly influences the estimation of the geophysical signals included in the functional model (i.e. tectonic rate, seasonal variations, and slow-slip events; Bock and Melgare, 2016; He et al., 2017, 2020).
In addition, recent studies (Langbein and Svarc, 2019; He et al., 2019) have also advocated the introduction of a random walk to model small jumps and residual transient signals which is a non-stationary stochastic process. Thus, several studies (Montillet and Yu, 2015) proposed the use of the fractional Brownian motion (fBm), first developed by Mandelbrot et al. (1968), in order to model long-memory processes. Botai et al. (2011) and Montillet and Yu (2015) focused on modelling (residual) geodetic time series using the family of Lévy α–stable distributions (Samorodnitsky and Taqqu, 1994; Nolan, 2018). The application of this family of distributions was supported by the ability to model long-memory processes and the existence of impulsive signals/noise bursts in the data sets, suggesting deviations from a Gaussian distribution (Botai et al., 2011).
This work discusses several statistical assumptions (i.e. stationary properties and presence of long-term correlations) on the underlying processes in the GNSS time series, justifying the application of the fBm and the family of Lévy α–stable distributions introduced by Montillet and Yu (2015). The Lévy stable distributions can model the heavy tail characteristics of some data sets with generally infinite variance. For example, the presence of unmodelled large jumps within the data can produce a distribution with large tails and infinite variance. In order to take into account a large variety of scenarios, we investigate and identify within the family of Lévy processes which process can be applied to model geodetic time series.
Here, the statistical modelling is applied to residual time series following Montillet and Yu (2015). The residual time series are defined as the remaining time series after subtracting the deterministically modelled tectonic rate and seasonal components (i.e. the functional model) from the GNSS observations. Therefore, our assumption is that the family of Lévy processes can model the remaining geophysical signals and correlations, which have not been captured by the initial model used, to produce the residual time series.
The next section starts with the statistical inference on the residual geodetic time series, including the application of the fBm model and the relationship with the fractional autoregressive integrated moving average (FARIMA) model. Section 2.3 presents the assumptions on the use of the Lévy processes in the model of the residual time series. To do so, we model the residual geodetic time series as a sum of three stochastic processes, with the hypothesis that the third one is a Lévy process. It involves some justifications when compared to established models in the scientific community. In Sect. 3, we develop an N-step method based on the variations in the stochastic and functional models when varying the length of the time series. This algorithm should verify our statistical assumptions on the third process. Sections 3.1.1 and 3.1.2 focus on the application to simulated and real time series. Finally, Sect. 3.2 discusses the limits of modelling geodetic time series with Lévy processes.
2.1 Stochastic modelling of residual GNSS time series
Let us model the GNSS observations and residual time series as an additive model as follows:
x0 is the time series defined as the GNSS observations, and x is the residual time series after subtracting the functional model (s0). At each ith observation, x(ti) is a sum of a residual geophysical signal sr(ti) and noise n(ti). Following Williams (2003) and He et al. (2017), the spectrum of the (residual) GNSS time series is best characterized by a stochastic process following a power law with index K (i.e. ; f is the frequency, P0 is a constant, and fs is the sampling frequency). A power-law noise model means that the frequency spectrum is not flat but governed by long-range dependencies. An example is shown in Fig. 3, using the ASCO station; other examples are displayed in the Supplement. Power-law noise is a type of coloured noise. The coloured noise results from various parameters during the processing of the GNSS observations, such as the mismodelling of GNSS satellites orbits, Earth orientation parameters, and large-scale atmospheric or hydrospheric effects (Williams, 2003; Klos et al., 2018). The stochastic noise model of the (residual) GNSS time series is then described with the following variance:
where the vector is a multivariate, continuous-time stochastic process. At each time step, we define , with nwn(ti) and npl(ti) as the white Gaussian noise (zero mean) and the power-law noise sample, respectively. Note that this type of time series belongs to the family of mixed spectra, where the mixed spectrum results from the sum of the spectra corresponding to the two kinds of noise (Li, 2013). T is the transposition operator, I the identity matrix, is the variance of the power-law noise, and J(K) is the covariance matrix of the power-law noise (K in ]0,2]). The definition of J depends on the assumptions on the type of coloured noise (see the Supplement).
We jointly estimate the functional and stochastic models in order to produce x, based on a maximum likelihood estimator (MLE). To recall Montillet and Bos (2019, chap. 2) for linear models, the log-likelihood for a time series of length L can be rewritten as follows:
This function must be maximized. Assuming that the covariance matrix C is known, it is a constant and does not influence finding the maximum. C is here defined by Eq. (2). The term (x0−Az) represents the observations minus the fitted model, also called x in Eq. (1). Note that Az is the matrix notation of s0. The last term can be written as xTC−1x, and it is a quadratic function, weighted by the inverse of matrix C. To select the geophysical model, and therefore estimate the associated parameters, one needs to carefully consider the location of the GNSS stations and the surrounding geodynamics. The model of s0 is discussed in the Supplement, together with the software used to carry out the maximization of ln (Lo). The value of L is here at least 9 years (3285 observations) in order to be able to properly model the long-range dependencies associated with the coloured noise and to detect slow transient signals according to He et al. (2019).
In the modelling of the GNSS time series, a strong assumption is the so-called Gauss–Markov hypothesis (e.g. Montillet and Bos, 2019, chap. 2) which states that the noise is Gaussian distributed. In order to keep applying the Gauss–Markov assumption on the noise observations of geodetic time series, we assume that the mean of the coloured noise is μC(t), which slowly varies with time. We then rule out the occurrence of specific events of a large amplitude, such as aggregations or bursts of spikes (i.e. intermittency), which could invalidate such an assumption (see the Supplement for more information).
Moreover, if the probability density function of the noise is Gaussian or has a different density function with a finite value of variance, its fractal properties can be described by the Hurst parameter (H). The authors in Montillet et al. (2013) use the fBm in order to model the statistical properties of the residual time series. The essential features of this process are its self-similar behaviour, meaning that magnified and rescaled versions of the process appear statistically identical to the original, together with its non-stationary property, implying a never-ending growth in variance with time (Mandelbrot et al., 1968). Previous studies (e.g. Mandelbrot et al., 1968; Eke et al., 2002) showed that H is directly connected with K by the following relation:
With this definition, flicker noise corresponds to K is 1 or H is 1, a random walk to K is 2 or H is 1.5, and white noise to K is 0 (H is 0.5). Note that Eq. (4) is established for the fractional Gaussian noise according to Eke et al. (2002). The random walk and the flicker noise are then classified as the long-term dependency phenomena (Montillet et al., 2013).
Long-memory processes are modelled with a specific class of autoregressive moving average (ARMA) models called FARIMA by allowing for non-integer differentiation. A comprehensive literature on the application of FARIMA can be found in financial analysis (Granger and Joyeux, 1980; Panas, 2001) and in geodesy (Li et al., 2000; Montillet and Yu, 2015; Montillet and Bos, 2019). This model can generate long-memory processes based on different values of the fractional index d (Granger and Joyeux, 1980). When d is 0, it is an ARMA process exhibiting a short memory; when the FARIMA process is said to exhibit intermediate memory or anti-persistence (Pipiras and Taqqu, 2017). This is very similar to the description of H in the fBm. In the Supplement, we recall the relationship between FARIMA, ARMA, and fBm.
2.2 α stable random variable and the Lévy α–stable distribution
The fBm and the fractional Lévy distribution are well known in statistics (Samorodnitsky and Taqqu, 1994) and in financial analysis (Panas, 2001; Wooldridge, 2010). The fractional Lévy distribution can model the Lévy processes and, in particular, the general family of α stable Lévy processes, which can be self-similar and stationary (Samorodnitsky and Taqqu, 1994). Let us recall the definition of a stable random variable.
A random variable X is stable if and only if , where , , a≠0, b∈ℝ and Z is a random variable with characteristic function (Nolan, 2018, chap. 1, definition 1.6). F(z) is the distribution function of Z. E{.} is the expectation operator. The characteristic function is as follows:
where sgn(.) is the signum function, α is the characteristic exponent which measures the thickness of the tails of these distributions (the smaller the values of α, the thicker the tails of distribution), and is the symmetry parameter which sets the skewness of the distribution. In general, no closed-form expression exists for these distributions, except for the Gaussian (α is 2), Pearson (α is 0.5 and β is −1) and Cauchy (α is 1 and β is 0) distributions.
Now, restricting the focus to our case study, we assume that if the stochastic process exhibits a self-similar property, then it can be modelled by the fBm. Following Weron et al. (2005), the most commonly used extension of the fBm to the α–stable case is the fractional Lévy stable motion (fLsm). The fLsm is H self-similar and has stationary increments, with H being the Hurst parameter described before. Both the fBm and the fLsm follow an integral representation, with different properties of their kernel (see the Supplement). The relationship between the fLsm reduces to the fBm when α=2. If , we obtain the Lévy α–stable motion which is an extension of the Brownian motion to the α–stable case. Note that the Lévy α–stable motion belongs to the Lévy processes.
2.3 The residual time series modelled as a sum of three stochastic processes
The residual time series is now modelled as a sum of three stochastic processes, namely it is the sum of a white noise, a coloured noise, and a third process. It is a similar approach to that used in previous works (Langbein, 2008; Davis et al., 2012; Langbein and Svarc, 2019; He et al., 2019) which look at the presence of a random-walk component in the stochastic model, hence adding a third covariance matrix in Eq. (2). We postulate that this unknown stochastic process belongs to the Lévy processes, which is classified into the following three types depending on the assumptions of the underlying process:
-
Gaussian Lévy – the Lévy process is a Gaussian Lévy process if the process follows the properties of a pure Brownian motion, which is also called a Wiener process (identity variance matrix, zero-mean, and stationary-independent increment; Haykin, 2002; Wooldridge, 2010). This is the special case of the fLsm and fBm with . The residual time series is assumed to contain mostly short-term correlations modelled with an ARMA process. The residual time series should be modelled with a multivariate Gaussian distribution.
-
Fractional Lévy – the residual time series exhibits self-similarity with possible long-term correlations. The fractional Lévy process is described by the model of the fLsm for the specific case reduced to the fBm. The long-term correlation process is mostly due to the presence of coloured noise (He et al., 2017). As explained in Montillet and Yu (2015), the ratio between the amplitudes of the coloured and white noise components determines which stochastic model of the residual time series should be the most suitable between the FARIMA and ARMA processes. However, the Gauss–Markov assumption is still valid; therefore, the residual time series should be modelled with a multivariate Gaussian distribution.
-
Stable Lévy – the Lévy process is a Lévy α–stable motion (not reduced to the fBm case). The Gauss–Markov assumption does not hold anymore. The distribution of the residual time series is potentially skewed, not symmetric, and with possibly heavy tails; hence, modelling with a Lévy α–stable distribution is undertaken. With the relationship between the Lévy α–stable motion, the fBm, and the FARIMA, we assume that the stochastic properties of the residual time series should be described with the FARIMA, especially in the presence of large-amplitude coloured noise.
In the application to geodetic time series, the third case occurs mainly due to a misfit between the selected (stochastic and functional) model and the observations. Therefore, the residual time series withholds some remaining unmodelled geophysical signals or unfiltered large outliers which can potentially undermine the Gauss–Markov assumption (e.g. the presence of heavy tails in the distribution of the residual time series). For example, if small jumps (or Markov jumps), outliers, or other unknown processes are present, it results in a distribution of the residual time series that is not symmetric and with heavy tails. The functional model describing those jumps is a Heaviside step function (Herring et al., 2016; He et al., 2017), as shown in the Appendix A. In order to assume a Lévy α–stable motion as the underlying stochastic model in the geodetic time series, we restrict our assumption to small, undetectable offsets, modelling them potentially as a random walk.
2.4 The N-step method
To recall Sect. 2.1, let us describe the functional model and the stochastic noise model, as described in Eq. (2), as a functional interpretation called ℱ(θ1) and 𝒢(θ2). The functional model is the modelled geophysical signal, whereas the stochastic noise model described using the covariance matrix in Eq. (2) is 𝒢(θ2). We define and as the vector parameters for the functional and stochastic noise model, respectively. For simplification, we have not included the estimation of possible offsets in the time series in the functional model (see the Appendix A for the discussion). Also, awh and bpl are the amplitude of the white and power-law noise, respectively.
Furthermore, our method is based on varying the length of the time series, resulting in the variations in the stochastic and functional models, which should allow classifying the type of Lévy process. The variations in the length of the time series should take into account that the coloured noise is a non-stationary signal (around the mean – see the Supplement), and thus the properties (i.e. bpl, K) vary non-linearly. However, varying the length of the time series over several years is not realistic, taking into account that real time series can record undetectable transient signals, undocumented offsets, and other non-deterministic signals unlikely to be modelled precisely (Montillet et al., 2015). That is why we restrain the variations in the time series length to 1 year.
Let us call the geodetic time series , , and at the first, second, and Nth variation, respectively. The N samples are 1 year in this example, and for simplification, we add only 1 sample at each step. That is not realistic, but the sole purpose is for this to be a pedagogical example. According to the functional notation above, the GNSS observations s and the estimated stochastic noise and functional models are as follows:
Let us describe the method for the first, second, and Nth step as follows:
where corresponds to the estimated vector or observations. [.]j means the jth iteration of the estimated quantity. Δsj is the residual time series at the jth step. ϵj (with j in ) is the unmodelled signals and stochastic processes at the jth step. Note that the methodology requires the estimation of the parameters of the functional and stochastic noise models via MLE, as described in Sect. 2.1 in the maximization of ln (Lo) in Eq. (3) (see also the Hector software; Bos et al., 2013, in the Supplement).
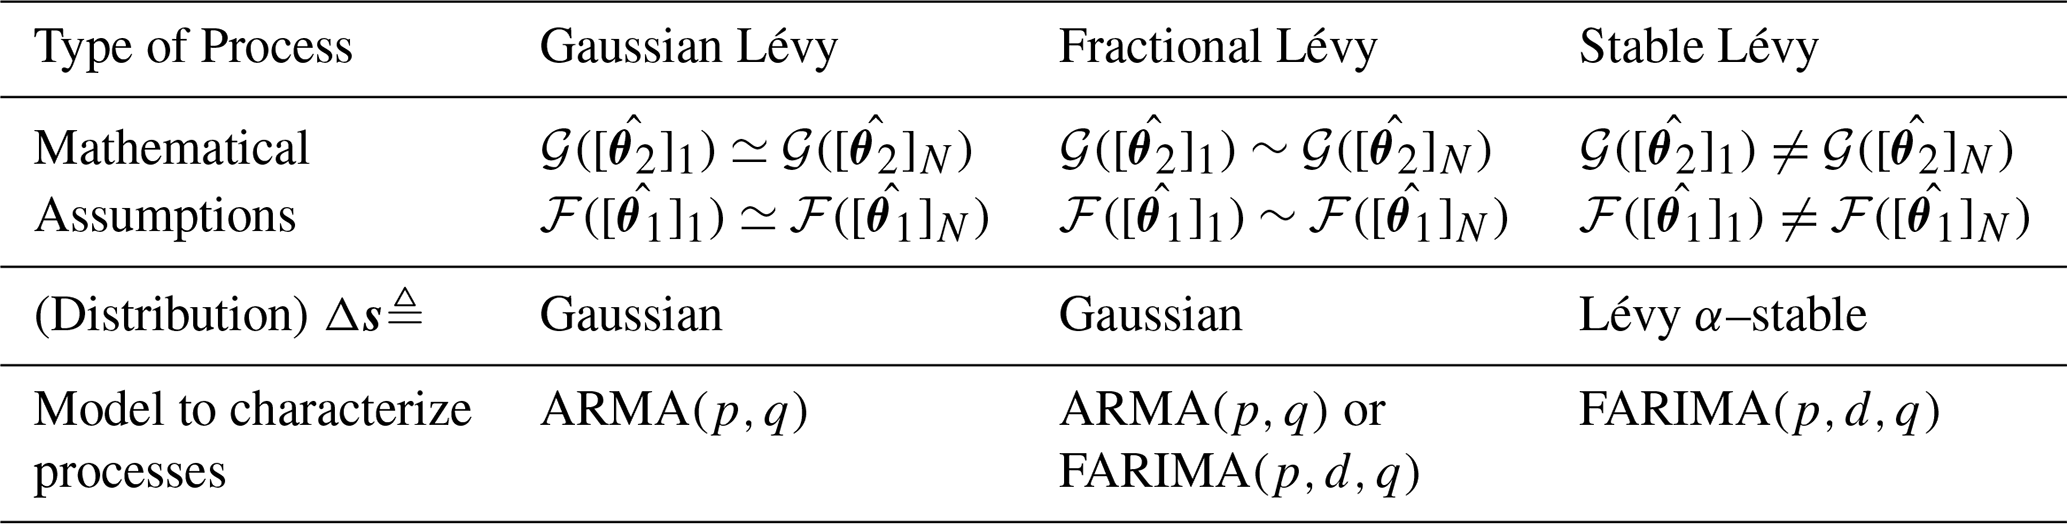
To recall the assumptions in Sect. 2.3, the residual time series ΔsN is modelled as a sum of three stochastic processes corresponding to the white noise, coloured noise, and a Lévy process. Using N iterations/steps and our statistical inferences on the Lévy processes (i.e. Gaussian Lévy, fractional Lévy, and stable Lévy), we make several assumptions on the estimated parameters and selected stochastic models in order to characterize the third process. Table 1 summarizes these assumptions. We use specific mathematical symbols to differentiate between them. ≜ means the equality in terms of distribution. ≃, ∼, and ≠ are related to the variations in the estimated parameters of the stochastic model associated with the first and the Nth step. The symbol ≃ means that there are few differences (less than 3 %) between the estimated parameters of the stochastic noise model associated with the first and the Nth iteration. The symbol ∼ means that we allow bigger differences up to 20 %. With much larger values, we use the symbol ≠. The variation in the estimated stochastic noise parameters between the first and the jth step is calculated using the sum of the difference in absolute value between the estimates (e.g. between the first and j+1 step, ). We deduce a percentage of the variations based on the sum in absolute value of the estimates .
Table 1Assumptions on the functional model and the stochastic parameters estimated via N iterations (see N-step method) to characterize the type of Lévy processes within the geodetic time series. The symbols and notations are explained in Sect. 2.4.
Furthermore, the fitting of the ARMA(p,q) and models to the residual time series is carried out by maximum likelihood, following Sowell (1991). The model orders p and q vary within the interval [0,5]. Also, the selection of the model which best fits the residual time series is performed by minimizing the Bayesian information criterion (BIC), following Montillet and Yu (2015). Finally, one can wonder if the anxiety in the model selection (ARMA and FARIMA) in the presence of heavy-tails can modify the performance of the BIC. This topic is currently debated in the statistical community (e.g. Panahi, 2016). Large tails should be detected in the fitting of the Lévy α–stable distribution. Various methods exist to estimate the parameters of this distribution (Koutrouvelis, 1980); however, we use the maximum-likelihood method of Nikias and Shao (1995). Due to the direct relationship between the index α and H recalled in Sect. 2.1, we assume that the amplitude of the coloured noise is higher than that of the white noise; therefore, the FARIMA should be chosen de facto over the ARMA model.
This section deals with the application of the N-step algorithm to simulated and real time series. This approach should verify our statistical inferences formulated in Sect. 2.3. Note that the simulations of the GNSS time series are comprehensively explained in the Supplement.
3.1 Application to simulated and real time series
We have restrained our simulations to the stochastic model corresponding to the flicker noise (with white noise – FN+WN) and power-law noise (with white noise – PL+WN). In addition to simplifying our study, we have preliminarily applied the method based on the Akaike information criterion developed in He et al. (2019) on the real time series to select the optimal stochastic noise model. Therefore, we have selected real time series with stochastic models FN+WN and PL+WN. We are not going to develop this topic further in this study, but readers can refer to He et al. (2019).
3.1.1 Simulated time series
We simulate a 10-year long time series, fixing awh to 1.6 mm. The tectonic parameters a vary between and b is 0. The seasonal signal with only the first harmonic (c1,e1) is (0.4,0.2) mm yr−1. According to Table 1, we vary the amplitude of coloured noise bcl in the following three scenarios:
- A.
low value (i.e. ),
- B.
intermediate value (i.e. ), and
- C.
high value (i.e. ).
Note that, in scenario C, the process is an unlikely zero-mean stationary. Also, it is mentioned when K is 1 (flicker noise) or 1.5 (power-law noise) in the simulations of the coloured noise.
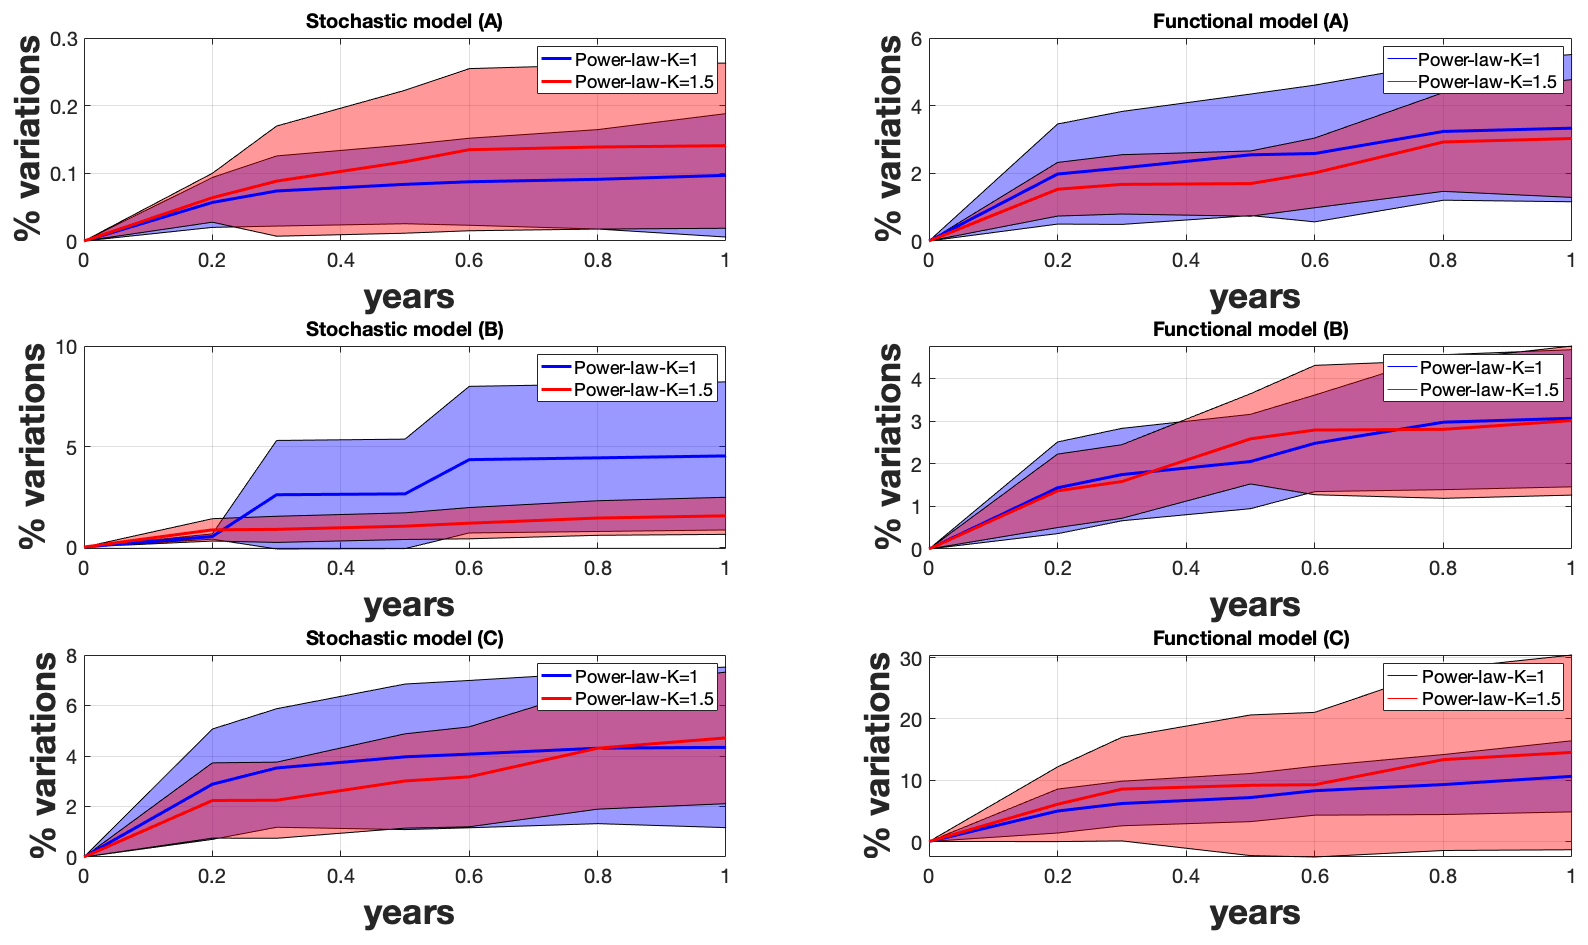
Figure 1Percentage of variations in the estimated parameters included in the stochastic and functional models when varying the length of the time series. The letters A, B, and C refer to the various scenarios with different coloured noise amplitudes.
Scenarios A, B, and C in Fig. 1 display the results when averaging over 50 time series. The variations are in steps of and 1 year (see x axes). We show both the variations in the stochastic and functional models. The y axes display the variations in the models in terms of percentage, as discussed in the previous section.
The first result, which is common to all three figures, is that the variations in terms of variance in the functional model increases faster than for the results associated with the stochastic model. Previous studies have shown that there is a part of the noise amplitude absorbed in the functional model (Williams, 2003; Montillet et al., 2015). In our scenario, the estimation of the linear trend may fit partially into the power-law noise; hence, reducing the variations in the stochastic noise model. This effect can be amplified with higher spectral indexes (Montillet and Bos, 2019). Now, Fig. 1 shows that, over 1 year, the variations in the stochastic and functional models are less than 4 % (on average) for small-amplitude coloured noise, whereas when increasing the coloured noise amplitude the variations increase quickly (e.g. more than 20 % for the large coloured noise amplitude corresponding to the scenario C) . We assume that part of the large variations in the coloured noise are wrongly absorbed in the estimation of the functional model.
Table 2Statistics on the error when fitting the ARMA and FARIMA model to the residual time series following the three scenarios.
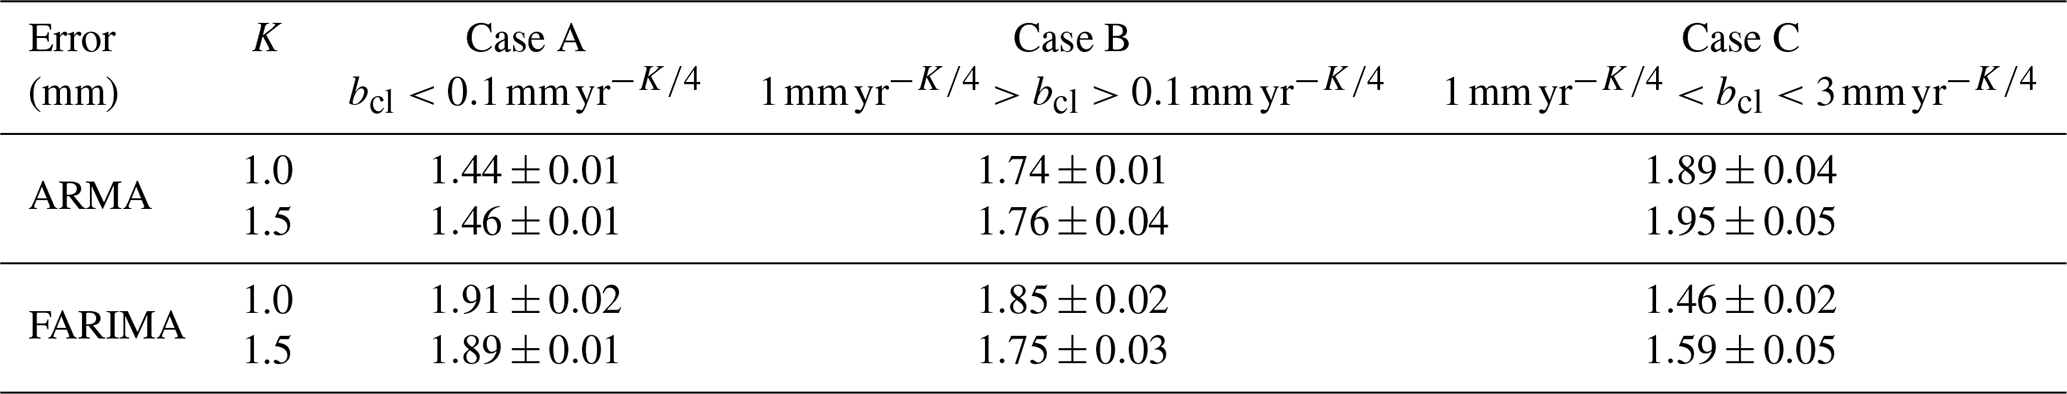
Table 3Correlation between the distribution of the residuals and the normal (corr. normal) distribution or the Lévy α–stable distribution (corr. Lévy) and the Anderson–Darling test (AD) following scenarios A, B, and C. The result of the AD test is the probability over the 50 trials of not rejecting the null hypothesis. Lévy or normal means the type of distribution used as the null hypothesis.
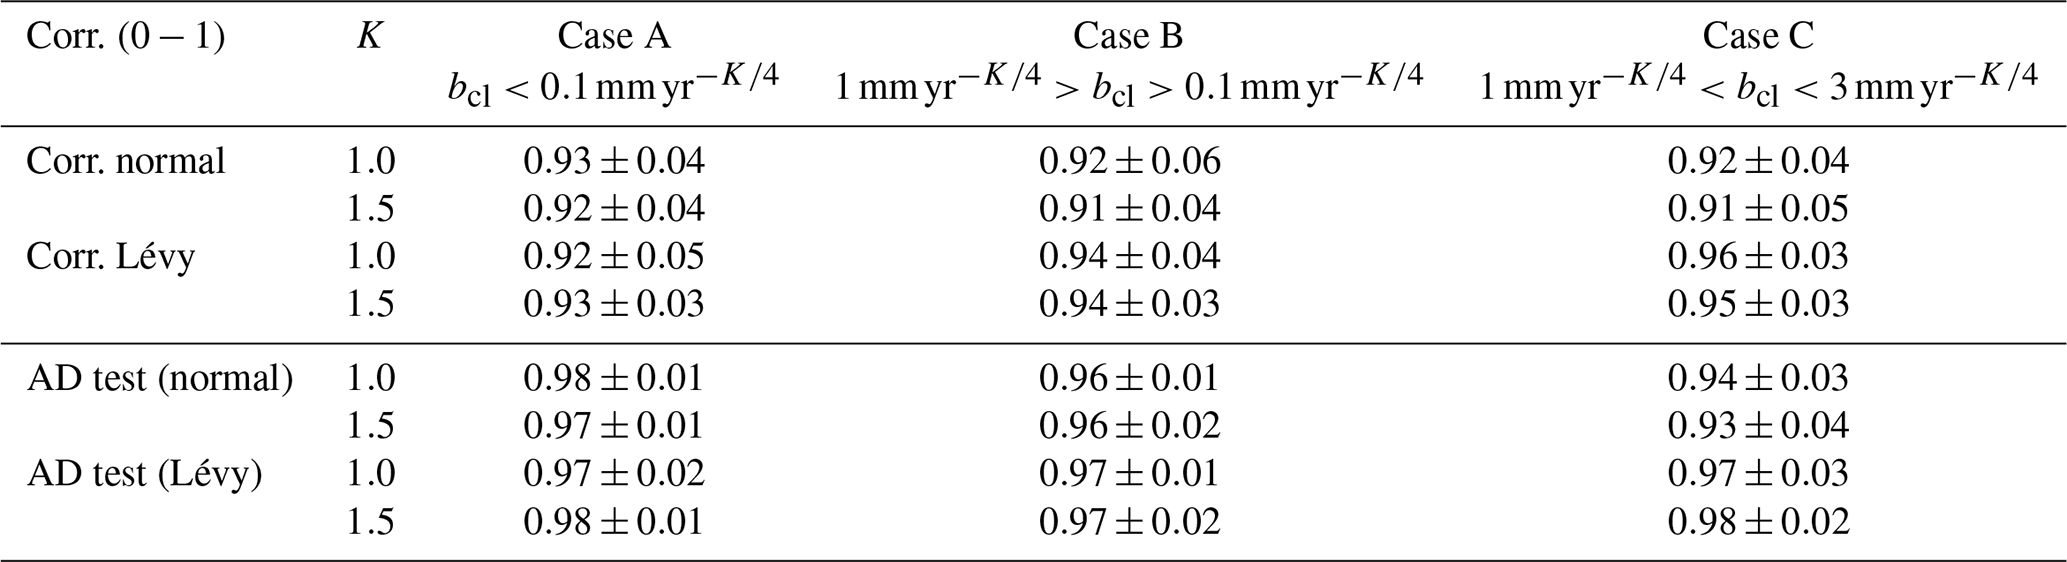
Now, Table 2 shows the standard deviation of the difference (mean square error) between the ARMA/FARIMA model and the residuals (i.e. Δsj in Eq. 7). We do not display any mean because the fits of the models are done on the zero-mean residuals. Note that the value is averaged over 50 simulations, together with the variations in the length of the time series described above. Table 2 also displays the average correlation between the distribution of the residuals and the normal or Lévy α–stable distribution. In agreement with the theory, we can see that the ARMA model fits residuals with small-amplitude coloured noise (bcl) well, whereas with the increase in bcl the FARIMA model fits better than the ARMA model. Looking at Table 3 in terms of correlation, the Lévy α–stable distribution fits as well as the normal distribution as long as the distribution of the residuals is Gaussian without large tails or asymmetry. That is why the Anderson–Darling test accepts the two distributions when the residual time series is Gaussian distributed without tails. In Sect. 2, we emphasized that the family of Lévy α–stable distributions includes the normal distribution with specific values for the parameters of the characteristic function (see Eq. 5). Thus, the results show that, for the amplitude of coloured noise corresponding to scenario B (i.e. Intermediate – in Tables 2 and 3), the two distributions show similar results. However, scenario C can potentially generate some aggregation processes in the simulated time series and introduce an asymmetry or large tails in the distribution of the residuals; therefore, it emphasizes that the family of Lévy α–stable distributions performs the best in modelling the residuals' distribution. To further support this result, we have added the Anderson–Darling test (AD) (Anderson and Darling, 1952) in order to test for the large tails in the distribution of the residuals in Table 3. However, we acknowledge that the (Pearson) correlation coefficient could be biased due to the inherent normalized sum constraint between the distributions estimated directly from the data. Therefore, in this instance the AD test should be more reliable. The results displayed in Table 2 give the probability of not rejecting the null hypothesis. Following our previous development, we have used the normal and the Lévy α–stable distributions as null hypotheses. The results show that this test detects mostly large tails for scenario C, which corresponds to when the family of Lévy α–stable distributions perform better than the normal distribution.
Finally, those three scenarios support the theory where, in the case of small-amplitude coloured noise, the stochastic noise properties are dominated by the Gaussian noise and, hence, define a third process as a Gaussian Lévy. However, the increase in the coloured noise amplitude shows that it is much more difficult to discriminate between the fractional Lévy and the stable Lévy. The results indicate that the third process can be modelled as a stable Lévy process when mostly the FARIMA fits the residuals due to large-amplitude long-memory processes and, hence, creates a heavy-tail distribution. This result is restrictive for the application to geodetic time series.
3.1.2 Real time series
We process the daily position time series of the three GNSS stations, namely DRAO, ASCO, and ALBH retrieved from the SOPAC and PANGA websites. The functional model includes the tectonic rate, the first and second harmonic of the seasonal signal, and the occurrence time of the offsets. This occurrence time is obtained from the log file of each station. However, ALBH is known to record slow-slip events from the Cascadia subduction zone (Melbourne et al., 2005). Thus, we include the offsets provided by the Pacific Northwest Geodetic Array (Miller et al., 1998). In this scenario, we do not know which stochastic model could fit the best the observations. Thus, we use the following two models: the PL+WN together with the FN+WN (see the Supplement for the display of the time series and the fitting of the distributions).
Similar to the previous section, Fig. 2 displays the percentage of variations in the stochastic and functional models averaged over the eastern and northern coordinates of each station. Because the up coordinate contains much more noise than the eastern and northern coordinates (Williams et al., 2004; Montillet et al., 2013), it amplifies the variation in both stochastic and functional models.
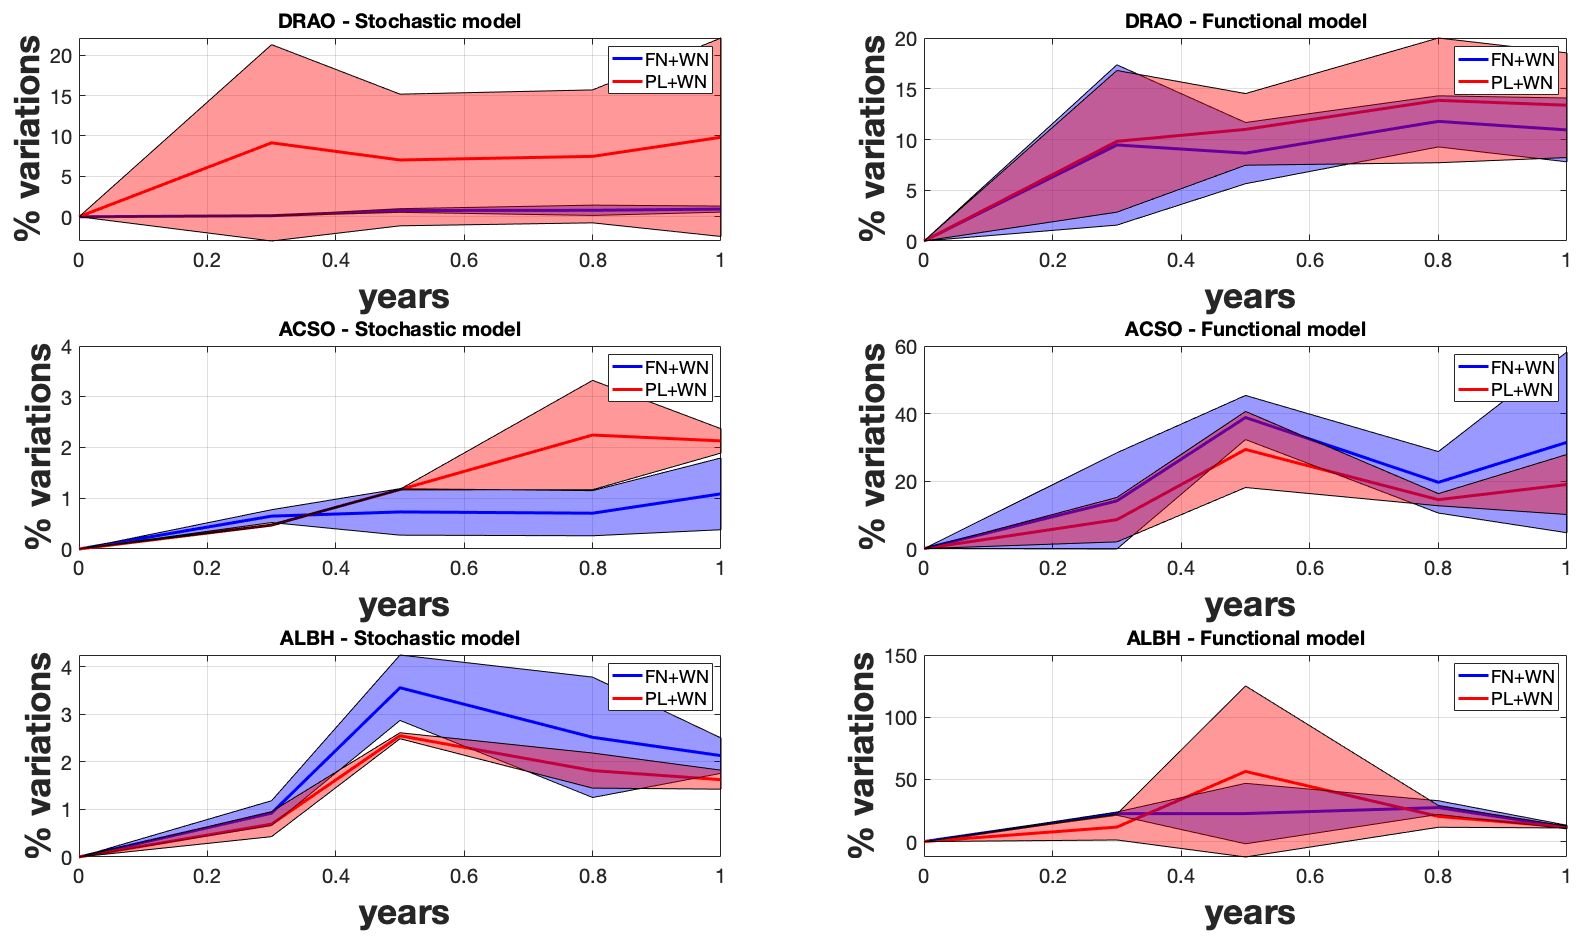
Figure 2Percentage of variations in the estimated parameters included in the stochastic and functional models when varying the length of the daily position GNSS time series corresponding to the stations DRAO, ASCO, and ALBH. The statistics are estimated over the eastern and northern coordinates.
Looking at Fig. 2, the first result is that for all the stations, and there is a strong dependence on the selected noise model. When selecting the power-law noise over the flicker noise model, there is an additional variable to estimate (i.e. the power-law noise exponent, K, in Eq. 4) within the stochastic noise model. This dependence is already discussed in previous studies (He et al., 2017, 2019).
The second result is the large variations in the functional model compared with the stochastic model. To recall the simulation results, the functional model partially absorbs the variations in the noise, i.e. the tectonic rate partially fits into the power-law noise. In addition, to some extent at ASCO, the sudden increase in the functional model variations at 0.5 year may be explained by the absorption of some of the noise with the second harmonic of the seasonal signal.
When comparing the variations in the stochastic and functional models with amplitude below 20 % for DRAO and ASCO, the results agree with the definition of the fractional Lévy process defined in Table 1 as third process modelling the residuals of the eastern and northern components. The variations in the functional model associated with ALBH are much larger than the other two stations, especially for the PL+WN model, with variations of up to 50 %. Those large variations can be explained due to the slow-slip events and the difficulty in modelling the post-seismic relaxations between two consecutive events (He et al., 2019).
Table 4Statistics on the error when fitting the ARMA and FARIMA model to the residual time series for each coordinate of the stations ALBH, DRAO and ASCO based on the PL+WN stochastic noise model. Correlation between the distribution of the residuals and the normal (corr. normal) and the Lévy α–stable distributions (corr. Lévy). The last column is the Anderson–Darling test. Lévy or normal mean the type of distribution used as the null hypothesis (1 not rejected; 0 rejected).
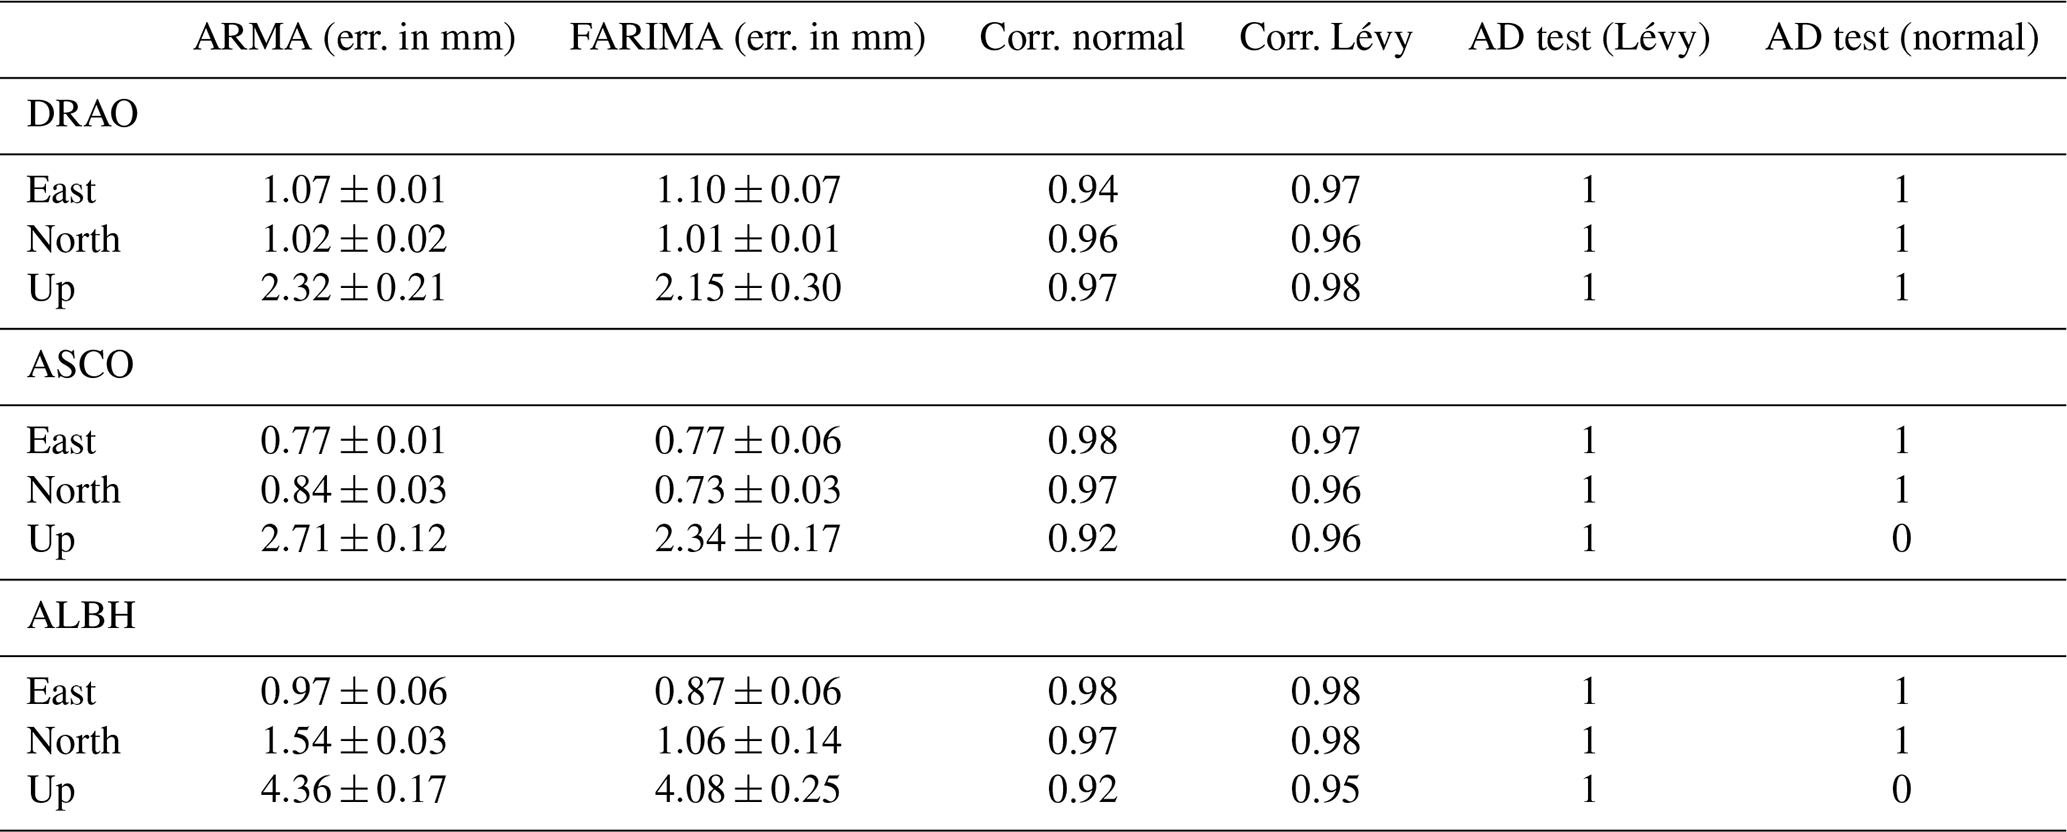
Furthermore, Table 4 displays the statistics on the error when fitting the ARMA and FARIMA models to the residuals estimated with the PL+WN stochastic noise model. Figure 3 shows the time series ASCO for the eastern coordinate using the full time series (for more results, see the Supplement). The FARIMA and ARMA models perform closely for all three stations. The large value for the up coordinate is due to the amplitude of the noise that is much larger for this coordinate than for the eastern and northern components. In terms of correlating the distribution of the residuals with the normal and the Lévy α–stable distribution, the correlation value is approximately the same for all stations, which indicates that the distribution of the residuals are Gaussian with the absence of large tails. The Anderson–Darling test also confirms this result when the non-rejection of the null hypothesis is the same for the two distributions. Those results further support the selection of the fractional Lévy process as the third stochastic process. However, the study of real time series also underlines the difficulty in statistically characterizing this third stochastic process. Note that the Anderson–Darling test shows also that there are some variations for the up coordinate where the Lévy α–stable distribution is only selected. As discussed above, the noise on the up coordinate is much larger than in the other coordinates; therefore, it may create small tails.

Figure 3GNSS time series for the ASCO station (eastern coordinate) with the PL+WN model. (a) The time series together with the functional model, (b) the power-spectrum, (c) residual time series with Lévy α–stable distribution, (d) cumulative density function residual time series, and Lévy α–stable distribution (Corr. Lévy=0.98). (e) Residual time series with normal distribution and (f) cumulative density function of the residual time series and normal distribution (corr. Norm.=0.97).
3.2 Discussion on the limits of modelling with Lévy processes
In Montillet and Yu (2015), it was assumed that the infinite variance in the residual time series comes from large tails of the distribution (i.e. heavy tails), generated by a large amplitude of coloured noise, outliers, and other remaining geophysical signals. The same study implied that the values of the noise variance should be bounded to exclude extreme values. This is an important assumption when deciding whether or not (symmetric) Lévy α–stable distributions can be used to model any geodetic time series. This section investigates how the variance due to residual tectonic rate or seasonal signal evolves with the length of the residual time series (i.e. L observations).
To recall Sect. 2.1 and the assumption on the noise properties, let us develop the closed-form expressions for the mean and variance of the residual time series. The residual time series is , as defined in Eq. (7). The mean 〈Δs1(L)〉 and variance σ2(L) are computed over L observations (i.e. considering the Lth observation defined in time as tL=L dt, with the sampling time dt being 1 for simplification and without taking into account any data gaps in order to have a continuous time series). Based on Papoulis and Unnikrishna Pillai (2002), one can estimate 〈Δs1(L)〉 in the cases of a remaining linear trend such as the following:
where ar and br are the amplitude and the intercept of the remaining tectonic rate. The subscript r designates the residual of a geophysical signal in the remainder. ≃ is the approximation for L≫1. The variance σ2(L) is the following:
where Cross(ar,n) is the cross term between arti and the noise term n(ti). Now, if we assume that the remaining seasonal signal Sr(t) is a pseudo-periodic function at frequencies similar to the seasonal signal, then it takes the form . Thus, we can do the same estimation as above in the case of a remaining pseudo-periodic component with the residual time series, such as in the following:
where δ is the average of the remaining seasonal signal. It is assumed to be independent of L and bounded as a periodic function. The variance is the following:
with Cross(Sr,n) being the cross term between Sr(t) and n(t). For all the cross terms, we assume that the deterministic signals and the noise are completely uncorrelated, which is valid with white Gaussian noise (e.g. signal processing; Papoulis and Unnikrishna Pillai, 2002). As previously discussed in Sect. 2.1, the coloured noise is characterized by long-memory processes, hence producing non-zero covariance with residual signals. Due to the varying amplitude of the coloured noise in geodetic time series with mixed spectra, the assumption of uncorrelated components is currently debated within the community (Herring et al., 2016; He et al., 2017). Therefore, recent works have introduced a random component together with a deterministic signal, namely non-linear rate (Wang et al., 2016; Dmitrieva et al., 2017) and non-deterministic seasonal signal (Davis et al., 2012; Chen et al., 2015; Klos et al., 2018). Thus, strictly speaking, the estimate σ2 should be seen as an upper bound.
The closed-form solution of the variance σ2(L) shows that the variance is unbounded in the case of a residual linear trend. If this residual trend originates from various sources not well described in the functional and stochastic model (i.e. undetected jumps and small-amplitude random-walk component) of the geodetic time series, the amplitude of this trend should be rather small (a<1 mm yr−1) when considering the length of GNSS time series available until now (L<30 years). Unless this non-linear residual trend has a large amplitude, a correction of the functional model must be done a posteriori due to possible anxiety between the models and the observations. The same remarks can be applied to the variance in the remaining seasonal signal where a large amplitude would imply a misfit with the functional model. Thus, we expect a rather small amplitude of the coefficients cr,j and er,j (e.g. mm to mm). Also, in the Appendix A, we have developed a similar formula to take into account undetected offsets, where we show that the variance is also bounded. In this case, a large value would mean that one or several large offsets have not been included in the functional model.
We have investigated the statistical assumptions behind using the fBm and the family of Lévy α–stable distributions in order to model the stochastic processes within the residual GNSS time series. We model the residual time series as a sum of three stochastic processes. The first two processes are defined from the stochastic model and assumptions on the noise properties of the geodetic time series. The third process is assumed to belong to the Lévy processes. We then distinguish between three cases. In the case of a residual time series containing only short-term processes, the process is a Gaussian Lévy process. In the presence of long-term correlations and self-similarity properties, fractional Lévy processes can be seen as an alternative model to using the fBm. Due to the linear relationship between the Hurst parameter and the fractional parameter of the FARIMA, it is likely that the FARIMA can fit the residual time series under specific conditions (i.e. amplitude of the coloured noise). The third case is the stable Lévy process, with the presence of long-term correlations, high-amplitude aggregation processes, or random walk.
In order to check our model, we have simulated mixed spectra time series with various levels of coloured noise. We have then developed an N-step methodology, based on varying the length of the time series, to study the variations in the stochastic and functional models and also to model the distribution of the residuals. The results emphasize the difficulty in separating the fractional Lévy process and the stable Lévy process mainly due to the absorption of the variations in stochastic processes by the functional model, unless the distribution of the residuals exhibits heavy tails.
The discussion on the limits of modelling the stochastic properties of the residuals with the stable Lévy process underlines that the infinite variance property can only be satisfied in the case of heavy-tailed distributions resulting from (1) the presence of a large-amplitude random walk (e.g. temporal aggregation in financial time series), (2) an important misfit between the models (i.e. functional and stochastic) and the observations, which means that there is anxiety in the choice of the functional model (e.g. unmodelled large jumps, large outliers). With longer and longer time series, one may be able to statistically characterize the third stochastic process more precisely. Finally, future work should investigate the autoregressive conditional heteroscedasticity (ARCH) model applied to GNSS time series in order to model differently the stochastic properties (e.g. non-stationary beyond the mean).
Here, we model the offsets in the time series as Heaviside step functions according to He et al. (2017). Following Sect. 3.2, the residual time series in presence of remaining offsets can be written as follows:
where ℋ is the Heaviside step function, gk is the amplitude of the offset, Tk is the time of occurrence of the offset, ng is the number of offsets, and n is the noise. One can estimate the average over L observations as follows:
μC(t) is the mean of the coloured noise, slowly varying in time (see Sect. 2.1). The variance is the following:
In the presence of small (undetectable) offsets (gk<1mm), we can further assume that 〈Δs1(L)〉∼μC(t) and . For multiple, large, uncorrected offsets (i.e. noticeable above the noise floor), the variance can be large, but the distribution of the residual time series should look like multiple Gaussian distributions overlapping each other and correspond to the segments of the time series defined by those noticeable offsets. This case is not taken into account in our assumptions summarized in Table 1 because it supposes that there is a large anxiety about the chosen functional model (i.e. obviously missing some large, noticeable offsets well above the noise floor). For a comprehensive discussion about offset detection, we invite readers to refer to Gazeaux et al. (2013) and He et al. (2017).
The code is a collection of routine in MATLAB (MathWorks) and is available upon request to the corresponding author.
All the GNSS data are available in public repositories such as the SOPAC archive at http://sopac-csrc.ucsd.edu/ (last access: 2 February 2021, Scripps Institution of Oceanography, 2021) or PANGA at https://www.geodesy.cwu.edu/data/bysite/ (last access: 2 February 2021, Miller et al., 1998).
The supplement related to this article is available online at: https://doi.org/10.5194/npg-28-121-2021-supplement.
JPM, XH, and KY developed the paper and the analysis. CX worked on the code.
The authors declare that they have no conflict of interest.
We would like to thank Machiel S. Bos from SEGAL (Space and Earth Geodetic Analysis Laboratory, University of Beira Interior) for multiple discussions on the stochastic properties of the GNSS time series. He also developed the Hector software used in this study. Xiaoxing He has been supported by the Natural Science Foundation of Jiangxi Province, the Science and Technology Research Project of Education Department of Jiangxi Province, and the National Natural Science Foundation of China. Finally, we would like to thank the reviewers for the constructive comments that helped to improve this article.
This research has been supported by the Natural Science Foundation of Jiangxi Province (grant nos. 20202BAB214029 and 20202BABL213033), the Science and Technology Research Project of Education Department of Jiangxi Province (grant no. GJJ200639), and the National Natural Science Foundation of China (grant nos. 42061077, 41904171, and 41904031).
This paper was edited by Stéphane Vannitsem and reviewed by Reik Donner and one anonymous referee.
Anderson, T. W. and Darling, D. A.: Asymptotic theory of certain “goodness-of-fit” criteria based on stochastic processes, Ann. Math. Statist., 23, 193–212, https://doi.org/10.1214/aoms/1177729437, 1952. a
Bevis, M. and Brown, A.: Trajectory models and reference frames for crustal motion geodesy, J. Geod., 88, 283, https://doi.org/10.1007/s00190-013-0685-5, 2014. a
Bock, Y. and Melgar, D.: Physical applications of GPS geodesy: a review, Rep. Prog. Phys., 79, 106801, https://doi.org/10.1088/0034-4885/79/10/106801, 2016. a, b
Bos, M. S., Fernandes, R. M. S., Williams, S. D. P., and Bastos, L.: Fast error analysis of continuous GNSS observations with missing data, J. Geod., 87, 351–360, https://doi.org/10.1007/s00190-012-0605-0, 2013. a
Botai, O. J., Combrinck, L., and Sivakumar, V.: Interferences of α-stable distribution of the underlying noise components in geodetic data, South Afr. J. Geol., 114, 541–548, https://doi.org/10.2113/gssajg.114.3-4.541, 2011. a, b
Chen, Q., Weigelt, M., Sneeuw, N., and van Dam, T.: On Time-Variable Seasonal Signals: Comparison of SSA and Kalman Filtering Based Approach, in: VIII Hotine-Marussi Symposium on Mathematical Geodesy, edited by: Sneeuw, N., Novak, P., Crespi, M., and Sanso, F., International Association of Geodesy Symposia, vol 142., Springer, Cham, 2015. a
Davis, J. L., Wernicke, B. P., and Tamisiea, M. E.: On seasonal signals in geodetic time series, J. Geophys. Res., 117, B01403, https://doi.org/10.1029/2011JB008690, 2012. a, b
Dmitrieva, K., Segall, P., and Bradley, A. M.: Effects of linear trends on estimation of noise in GNSS position time-series, Geophys. J. Int., 208, 281–288, https://doi.org/10.1093/gji/ggw391, 2017. a
Eke, A., Herman, P., Kocsis, L., and Kozak, L.: Fractal characterization of complexity in temporal physiological signals, Physiol. Meas., 23, R1–R38, https://doi.org/10.1088/0967-3334/23/1/201, 2002. a, b
Gazeaux, J., Williams, S., King, M., Bos, M., Dach, R., Deo, M., Moore, A. W., Ostini L., Petrie, E., Roggero, M., Teferle, F. N., Olivares, G., and Webb, F. H.: Detecting offsets in GPS time series: First results from the detection of offsets in GPS experiment, J. Geophys. Res., 118, 2397–2407, https://doi.org/10.1002/jgrb.50152, 2013. a
Granger, C.W. and Joyeux, R.: An introduction to long-memory time series models and fractional differencing, J. Time Ser. Anal., 1, 15–29, https://doi.org/10.1111/j.1467-9892.1980.tb00297.x, 1980. a, b
Haykin, S.: Adaptive Filter Theory, Fourth edition, Prentice Hall Upper Saddle River, New Jersey, ISBN-13: 978-0130901262, 2002. a
He, X., Montillet, J.-P., Fernandes, R. M. S., Bos, M. S., Yu, K., Hua, X., and Jiang, W.: Review of current GPS methodologies for producing accurate time series and their error sources, J. Geodyn., 106, 12–29, https://doi.org/10.1016/j.jog.2017.01.004, 2017. a, b, c, d, e, f, g, h, i, j
He, X., Bos, M. S., Montillet, J.-P., and Fernandes, R. M. S.: Investigation of information criteria and noise models for GNSS time series, J. Geod., 93, 1271–1282, https://doi.org/10.1007/s00190-019-01244-y, 2018. a, b, c, d, e, f, g
He, X., Yu, K., Montillet, J.-P., Xiong, C., Lu, T., Zhou, S., Ma, X., Cui, H., and Ming, F.: GNSS-TS-NRS: An Open-Source MATLAB-Based GNSS Time Series Noise Reduction Software, Remote Sens., 12, 3532, https://doi.org/10.3390/rs12213532, 2020. a
Herring, T. A., King, R. W., and McClusky, S. C.: Introduction to GAMIT/GLOBK, Report, MIT, Cambridge, 2010.
Herring, T. A., King, R. W., McClusky, S. C., Floyd, M., Wang, L., Murray, M., Melbourne, T.,Santillan, M., Szeliga, W., Phillips, D., and Puskas, C.: Plate Boundary Observatory and Related Networks: GPS Data Analysis Methods and Geodetic Products, Rev. Geophys., 54, 759–808, https://doi.org/10.1002/2016RG000529, 2016. a, b, c
Klos, A., Bos, M. S., and Bogusz, J.: Detecting time-varying seasonal signal in GPS position time series with different noise levels, GPS Solut., 22, 21, https://doi.org/10.1007/s10291-017-0686-6, 2018. a, b
Koutrouvelis, I. A.: Regression-type estimation of the parameters of stable laws, J. Am. Stat. Assoc., 75, 918–928, https://doi.org/10.2307/2287182, 1980. a
Langbein, J.: Noise in GPS displacement measurements from Southern California and Southern Nevada, J. Geophys. Res., 113, B05405, https://doi.org/10.1029/2007JB005247, 2008. a, b
Langbein, J., and Svarc, J. L.: Evaluation of Temporally Correlated Noise in Global Navigation Satellite System Time Series: Geodetic Monument Performance, J. Geophys. Res., 124, 925–942, https://doi.org/10.1029/2018JB016783, 2019. a, b, c
Li, J., Miyashita, K., Kato, T., Miyazaki, S.: GPS time series modeling by autoregressive moving average method: Application to the crustal deformation in central Japan, Earth Planet Space, 52, 155–162, 2000. a
Li, T.-H.: Time Series with Mixed Spectra, Chapman and Hall/CRC Press, London, UK, ISBN: 978113837495, 2019. a
Mandelbrodt, B. and Van Ness, J. W.: Fractional Brownian Motions, Fractional Noises and Applications, SIAM Rev., 10, 422–437, 1968. a, b, c
Melbourne, T. I., Szeliga, W. M., Miller, M., and Santillan, V. M.: Extent and duration of the 2003 Cascadia slow earthquake, Geophys. Res. Lett., 32, L04301, https://doi.org/10.1029/2004GL021790, 2005. a
Miller, M. M., Dragert, H., Endo, E., Freymueller, J. T., Goldfinger, C., Kelsey, H. M., Humphreys, E. D., Johnson, D. J., McCaffrey, R., Oldow, J. S., Qamar, A., and Rubin, C. M.: PANGA: Precise measurements help gauge Pacific Northwest's Earthquake Potential, Eos Transactions, Eos, 79, 269–275, 1998 (data available at: https://www.geodesy.cwu.edu/data/bysite/ (last access: 2 February 2021). a, b
Montillet, J.-P. and Bos, M. S.: Geodetic Time Series Analysis in Earth Sciences, Springer Geophysics, Springer Nature Switzerland AG 2020, https://doi.org/10.1007/978-3-030-21718-1, 2019. a, b, c, d, e
Montillet, J.-P., Tregoning, P., McClusky, S., and Yu, K.: Extracting white noise statistics in GPS coordinate time series, IEEE Geosci, Remote Sens. Lett., 10, 563–567, https://doi.org/10.1109/LGRS.2012.2213576, 2013. a, b, c
Montillet, J.-P., Williams, S. D. P., Koulali, A., McClusky, S. C.: Estimation of offsets in GPS time-series and application to the detection of earthquake deformation in the far-field, Geophys. J. Int., 200, 1207–1221, https://doi.org/10.1093/gji/ggu473, 2015. a, b
Montillet, J. P. and Yu, K.: Modeling geodetic processes with levy α-stable distribution and FARIMA, Math. Geosci., 47, 627–646, https://doi.org/10.1007/s11004-014-9574-6, 2015. a, b, c, d, e, f, g, h
Nikias, C. L. and Shao, M.: Signal processing with Alpha-Stable Distributions and Applications, Wiley edition, New York, ISBN-10: 047110647X, 1995. a
Nolan, J. P.: Stable Distributions – Models for Heavy Tailed Data, Birkhauser, Boston, 2017, in progress, chap. 1 available at: https://edspace.american.edu/jpnolan/wp-content/uploads/sites/1720/2020/09/Chap1.pdf (last access: 2 February 2021), 2018. a, b
Panahi, H.: Model Selection Test for the Heavy-Tailed Distributions under Censored Samples with Application in Financial Data, Int. J. Financial Stud. (MDPI), 4, 24, https://doi.org/10.3390/ijfs4040024, 2016. a
Panas, E.: Estimating fractal dimension using stable distributions and exploring long memory through ARFIMA models in Athens Stock Exchange, Appl. Financial Econ., 11, 395–402, https://doi.org/10.1080/096031001300313956, 2001. a, b
Papoulis A. and Unnikrishna Pillai S.: Probability, Random Variables and Stochastic Processes, McGraw-Hill Series in Electrical and Computer Engineering, the McGraw-Hill companies, Toronto, Canada, ISBN: 0-07-366011-6, 2002. a, b
Pipiras, V. and Taqqu, M.: Long-Range Dependence and Self-Similarity, Cambridge Series in Statistical and Probabilistic Mathematics, Cambridge University Press, Cambridge, England, ISBN: 9781139600347, https://doi.org/10.1017/CBO9781139600347, 2017. a
Samorodnitsky, G. and Taqqu, M. S.: Stable Non-Gaussian Random Processes: Stochastic Models with Infinite Variance, Chapman and Hall, London, 1994. a, b, c
Scripps Institution of Oceanography: SOPAC, University of California, San Diego, available at: http://sopac-csrc.ucsd.edu/, last access: 2 February 2021. a
Sowell, F.: Modeling long-run behavior with the fractional ARIMA model, J. Monet. Econ., 29, 277–302, https://doi.org/10.1016/0304-3932(92)90016-U, 1991. a
Wang, X., Cheng, Y., Wu, S., and Zhang, K.: An enhanced singular spectrum analysis method for constructing non-linear model of GPS site movement, J. Geophys. Res., 121, 2193–2211, https://doi.org/10.1002/2015JB012573, 2016. a
Weron, A., Burnecki, K., Mercik, S., and Weron, K.: Complete description of all self-similar models driven by Levy stable noise, Phys. Rev. E., 71, 016113, https://doi.org/10.1103/PhysRevE.71.016113, 2005. a
Williams, S. D. P.: The effect of coloured noise on the uncertainties of rates estimated from geodetic time series, J. Geod., 76, 483–494, https://doi.org/10.1007/s00190-002-0283-4, 2003. a, b, c, d
Williams, S. D. P., Bock, Y., Fang, P., Jamason, P., Nikolaidis, R. M., Prawirodirdjo, L., Miller, M., and Johnson, D. J.: Error analysis of continuous GPS position time series, J. Geophys. Res., 109, B03412, https://doi.org/10.1029/2003JB002741, 2004. a, b
Wooldridge, J. M.: Econometric Analysis of Cross Section and Panel Data, 1st edn., MIT Press, ISBN-13: 9780262232586, 2010. a, b
- Abstract
- Introduction
- The stochastic properties of the residual time series and statistical inferences
- Lévy processes applied to geodetic time series analysis
- Conclusions
- Appendix A: Estimation of the variance in the presence of offsets
- Code availability
- Data availability
- Author contributions
- Competing interests
- Acknowledgements
- Financial support
- Review statement
- References
- Supplement