the Creative Commons Attribution 4.0 License.
the Creative Commons Attribution 4.0 License.
 | 20 Aug 2019
Application of fractal models to delineate mineralized zones in the Pulang porphyry copper deposit, Yunnan, southwestern China
Xiaochen Wang
Qinglin Xia
Tongfei Li
Shuai Leng
Yanling Li
Li Kang
Zhijun Chen
Lianrong Wu
The aim of this study is to delineate and identify various mineralized zones and barren host rocks based on surface and subsurface lithogeochemical data from the Pulang porphyry copper deposit, southwestern China, utilizing the number–size (N-S), concentration–volume (C-V) and power-spectrum–volume (S-V) fractal models. The N-S model reveals three mineralized zones characterized by Cu thresholds of 0.28 % and 1.45 %: <0.28 % Cu represents weakly mineralized zones and barren host rocks, 0.28 %–1.45 % Cu represents moderately mineralized zones, and > 1.45 % Cu represents highly mineralized zones. The results obtained by the C-V model depict four geochemical zones defined by Cu thresholds of 0.25 %, 1.48 % and 1.88 %, representing nonmineralized wall rocks (Cu<0.25 %), weakly mineralized zones (0.25 %–1.48 %), moderately mineralized zones (1.48 %–1.88 %) and highly mineralized zones (Cu>1.88 %). The S-V model is used by performing a 3-D fast Fourier transformation of assay data in the frequency domain. The S-V model reveals three mineralized zones characterized by Cu thresholds of 0.23 % and 1.33 %: <0.23 % Cu represents leached zones and barren host rocks, 0.23 %–1.33 % Cu represents hypogene zones, and >1.33 % Cu represents supergene enrichment zones. All the multifractal models indicate that high-grade mineralization occurs in the central and southern parts of the ore deposit. Their results are compared with the alteration and mineralogical models resulting from the 3-D geological model using a log-ratio matrix. The results show that the S-V model is best at identifying highly mineralized zones in the deposit. However, the results of the C-V model for moderately and weakly mineralized zones are also more accurate than those obtained from the N-S and S-V models.
- Article
(4421 KB) - Full-text XML
- BibTeX
- EndNote


The definition and delineation of different mineralized zones and non–mineralized wall rocks are the main goal in economic geology and mineral exploration. The investigation of ore mineralogy and paragenetic sequence provides useful data on ore-forming processes in deposits because typical characteristics of various types of ore deposits are reflected by their mineral assemblages (Craig and Vaughan, 1994; White and Hedenquist, 1995). Common methods generally use mineralography, petrography and alteration mineral assemblage analysis to delineate various mineralized zones in porphyry deposits (Beane, 1982; Schwartz, 1947; Sillitoe, 1997; Berger et al., 2008). Lowell (1968) first proposed a conceptual model of the lateral and vertical variations in mineralogy within alteration zones. Some similar models were developed for potassic alteration, which is usually situated in the center and deep parts of porphyry ore deposits, based on this conceptual model (Sillitoe and Gappe, 1984; Cox and Singer, 1986; Melfos et al., 2002). Fluid inclusion and stable isotope studies are other methods used to outline different mineralization phases based on thermometric and isotope element parameters and other geological parameters (e.g., Boyce et al., 2007; Faure et al., 2002; Wilson et al., 2007). Drill hole data and logging information, including mineralographical information, host rock changes and alterations are helpful in delineating mineralization zones. Different geological interpretations could be used to detect zone boundaries, which may also lead to different results because the elemental grade distribution may not be taken into consideration.
Non-Euclidean fractal geometry (Mandelbrot, 1983) is an important branch of nonlinear mathematical sciences and has been applied in various research fields of the geosciences since the 1980s. The relationships between geology, geochemistry and mineralogical settings and spatial information can be researched by methods based on fractal geometry (Afzal et al., 2011; Carranza, 2008, 2009). Bolviken et al. (1992) and Cheng et al. (1994) have shown that geochemical patterns of various elements have fractal dimensions. The concentration–area (C-A) model was proposed by Cheng et al. (1994) to recognize geochemical anomalies from background concentrations and calculate elemental thresholds of different geochemical data. Furthermore, many other fractal models have been proposed and applied in geochemical exploration work, including the number–size (N-S) fractal model proposed by Mandelbrot (1983) and Agterberg (1995), the power-spectrum–area (S-A) fractal model proposed by Cheng (1999), the concentration–distance (C-D) fractal model proposed by Li et al. (2003), the concentration–volume (C-V) fractal model proposed by Afzal et al. (2011) and the power-spectrum–volume (S-V) fractal model proposed by Afzal et al. (2012).
Methods of fractal analysis also illustrate the relationships between geological, geochemical and mineralogical settings and spatial information derived from the analysis of mineral deposit occurrence data (Carranza, 2008, 2010; Carranza et al., 2009; Goncalves et al., 2001). Various geochemical processes can be described based on the differences in fractal dimensions obtained from the analysis of relevant geochemical data. Afzal et al. (2011) considered that the log–log plots obtained by fractal methods are useful tools to delineate different geological populations of geochemical data, and the thresholds could be determined as some breakpoints in those plots.
The application of fractal models to delineate various grades of mineralization zones was dependent on the relationships between the metal grades and volumes (Afzal et al., 2011; Agterberg et al., 1993; Cheng, 2007; Sim et al., 1999; Turcotte, 1986). Afzal et al. (2011, 2012) proposed a C-V and S-V fractal model to delineate different porphyry-Cu mineralized zones and barren host rocks. In this paper, N-S, C-V and S-V fractal models were applied to delineate various mineralized zones and barren host rocks in the Pulang porphyry copper deposit, Yunnan, southwestern China.
2.1 Number–size (N-S) fractal model
The N-S method proposed by Mandelbrot (1983) can be utilized to describe the distribution of geochemical populations (Sadeghi et al., 2012). In this method, geochemical data do not undergo any preprocessing (Mao et al., 2004). This model shows a relationship between desirable attributes (e.g., Cu concentration in this study) and their cumulative number of samples (Sadeghi et al., 2012). A power-law frequency model has been proposed to explain the N-S relationship according to the frequency distribution of elemental concentrations and cumulative number of samples with those attributes (e.g., Li et al., 1994; Sadeghi et al., 2012; Sanderson et al., 1994; Shi and Wang, 1998; Turcotte, 1989, 1996; Zuo et al., 2009).
The N-S model proposed by Mandelbrot (1983) can be expressed as follows:
where ρ denotes the element concentration, N(≥ρ) denotes the cumulative number of samples with concentrations greater than or equal to ρ, F is a constant, and D is the scaling exponent or fractal dimension of the distribution of element concentrations. According to Mandelbrot (1983), log–log plots of N(≥ρ) versus ρ show linear segments with different slopes −D corresponding to different concentration intervals.
2.2 Concentration–volume (C-V) fractal model
Afzal et al. (2011) proposed a C-V fractal model based on the same principle as the C-A model (Cheng et al., 1994) to analyze the relationship between the concentration of ore elements and accumulative volume with concentrations greater than or equal to a given value (Afzal et al., 2011; Zuo and Wang, 2016; Sadeghi et al., 2012; Soltani et al., 2014; Sun and Liu, 2014; Wang et al., 2011, 2012). This model can be expressed as follows:
V(ρ≥υ) and V(ρ≤υ) represent the occupied volumes with concentrations above or equal to and less than or equal to the contour value υ, υ indicates the threshold value of a zone, and a1 and a2 are the characteristic indexes. The thresholds obtained by this method indicate the boundaries between the different grades of mineralization zones and barren host rocks of ore deposits. The drill hole data of the elemental concentrations were interpolated by using geostatistical estimation to compute V(ρ≥υ) and V(ρ≤υ), which are the volume values enclosed by a contour level ρ in a 3-D model.
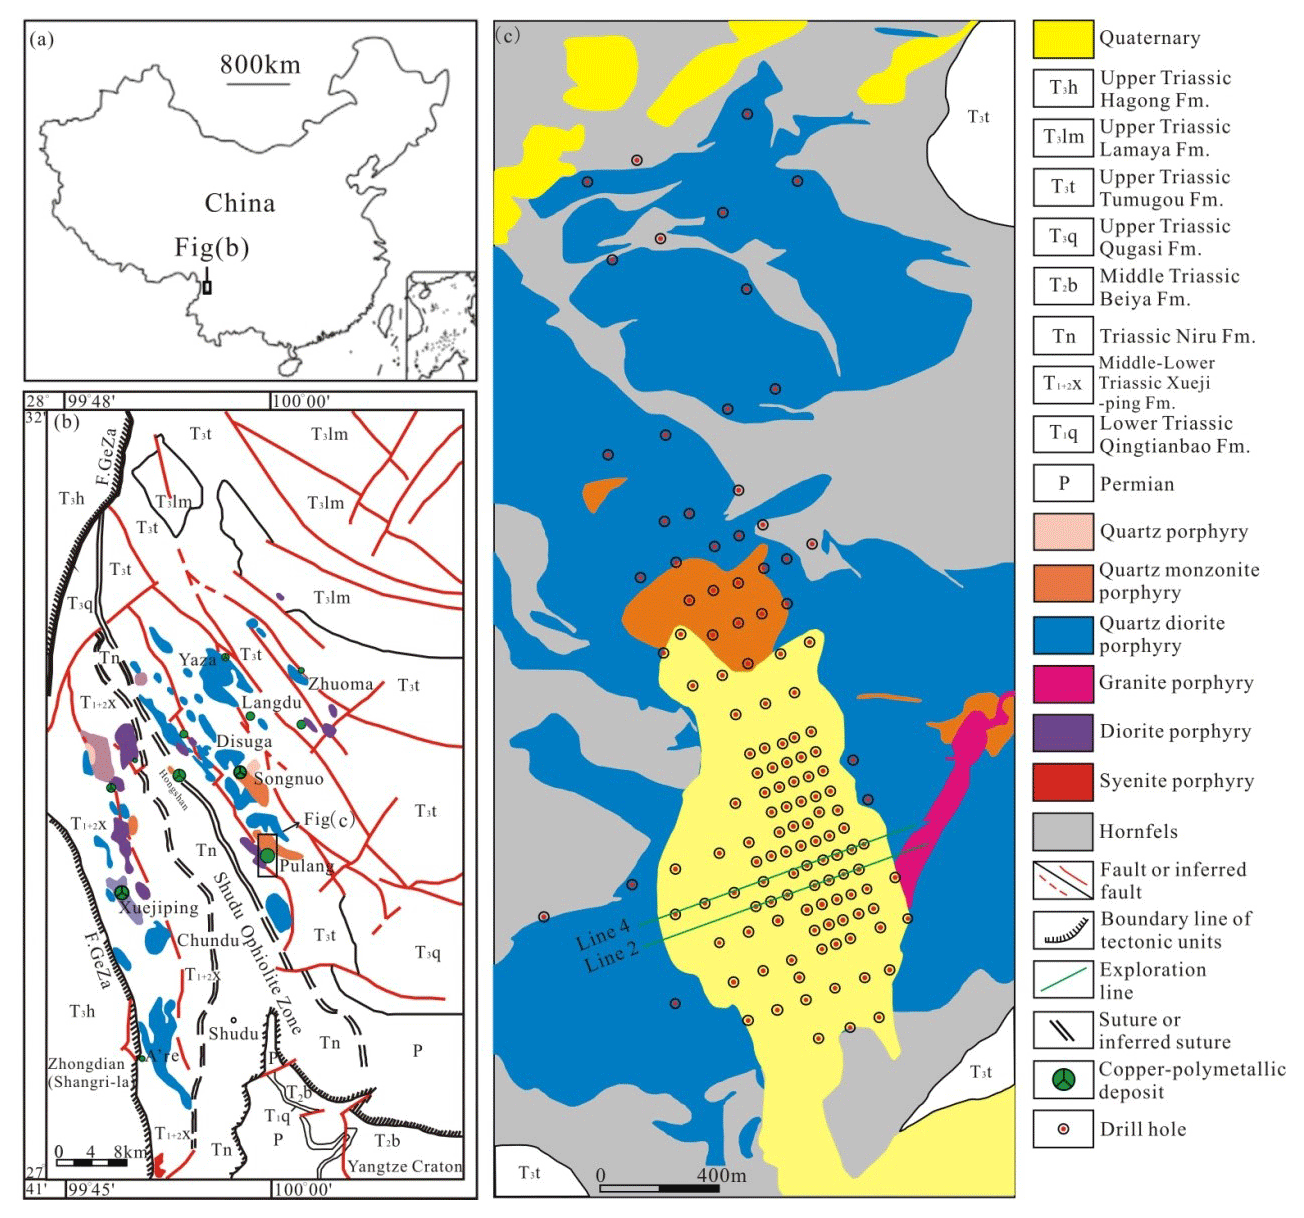
Figure 1Geological map of the Pulang porphyry copper deposit, SW China. Modified after © Yunnan Diqing Nonferrous Metal Co. Ltd. (2009).
2.3 Power-spectrum–volume (S-V) fractal model
Different geochemical patterns in the spatial domain could be seen as layered signals of various frequencies. Cheng (1999) proposed the S-A fractal model to recognize geochemical anomalies from backgrounds utilizing the method of spectrum analysis in the frequency domain according to this argument. This model is combined with a C-A model (Cheng et al., 1994), offering a useful tool to determine an optimum threshold value between various patterns based on the scaling property.
Afzal et al. (2012) proposed the S-V fractal model to delineate different grades of mineralization zones based on the same principle as the S-A model proposed by Cheng (1999). The S-V model was utilized in the frequency domain by applying a fast Fourier transformation to the assay data. The straight lines obtained by log–log plotting indicate the relationships between the power spectra and relevant volumes of ore elements. These relationships were utilized to recognize the hypogene zones and supergene enrichment zones from the barren host rocks and the leached zone of the deposit. The recognition of various mineralization zones is based on the power-law relationships between the power spectra and occupied volumes. The formula is as follows:
where the power-law relationships between the power spectra () and occupied volumes with power spectra greater than or equal to S can be indicated by this form; F represents the fast Fourier transformation of the measurement ; and Wx, Wy and Wz indicate wave numbers or angular frequencies in the x, y and z directions in a 3-D model. The range of index β is or with the special cases of β=2 and corresponding to nonfractal and monofractal expressions, and corresponding to multifractals (Cheng, 2006).
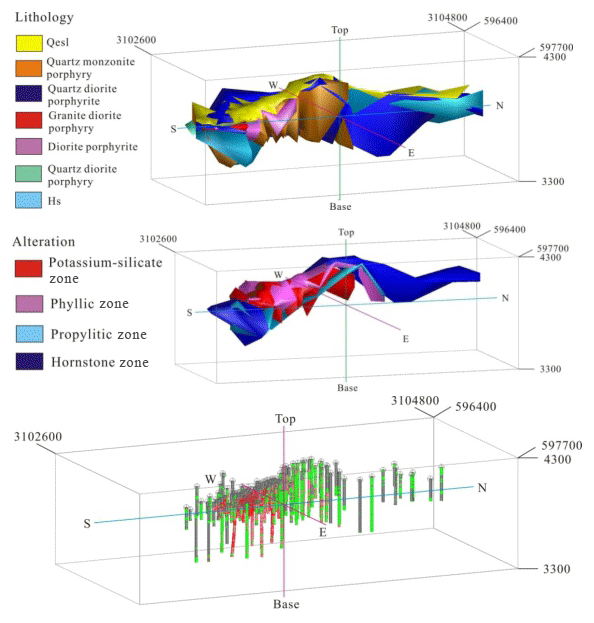
Figure 2Geological 3-D models including lithology, alteration and 3-D drill hole plot with the legend of each in the Pulang porphyry copper deposit. Scale is in cubic meters (m3).
By using the method of geostatistical estimation, the drill hole data of elemental concentration values were interpolated to construct a block model of ore element distribution. The power spectrum values can be obtained by 3-D fast Fourier transformation of the ore element grades. The logarithm of all the power spectrum values and accumulative volume values were calculated. Additionally, the log–log plot between power spectrum and volume was drawn according to previously determined values. Then, the filters were constructed on the basis of threshold values obtained by the log–log plot of S-V. Finally, the power spectra were converted back to the space domain by utilizing inverse fast Fourier transformation.
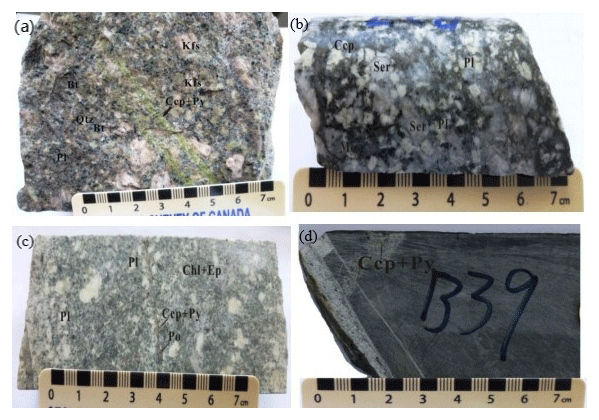
Figure 3Photographs of alteration and mineralization in the Pulang porphyry copper deposit, SW China: (a) quartz monzonite porphyry with potassium-silicate alteration; (b) quartz diorite porphyrite with quartz-sericite alteration; (c) quartz diorite porphyrite with propylitic alteration; (d) hornfels. Qtz: quartz; Pl: plagioclase; Kfs: K-feldspar; Bt: biotite; Ser: sericite; Chl: chlorite; Ep: epidote; Py: pyrite; Ccp: chalcopyrite; Mo: molybdenite; Po: pyrrhotite.
The Pulang porphyry copper deposit is situated in the southern end of the Yidun continental arc, southwestern China (Fig. 1). The continental arc was produced due to the westward subduction of the Garze–Litang oceanic crust (Deng et al., 2014b, 2015; Wang et al., 2014). The Pulang ore deposit, one of the largest porphyry copper deposits in China (Deng et al., 2012, 2014a; Mao et al., 2012, 2014), is characterized by a typical porphyry-type alteration zone. The geological characteristics of the deposit, including the alteration types and their zonation, the geometry of the orebody, the metallogenic time and the geodynamic settings, have been systematically researched (Leng et al., 2012; Li et al., 2011, 2013). The deposit consists of five ore-bearing porphyry bodies covering an area of approximately 9 km2, and the explored ore tonnage of Cu is estimated to be 6.50 Mt (Liu et al., 2013).
The outcrop strata of the Pulang deposit are dominated by Upper Triassic Tumugou Formation clastic rocks and andesite and Quaternary sediments (Fig. 1c). The Triassic porphyry intrusions primarily comprise quartz diorite porphyry, quartz monzonite porphyry, quartz diorite porphyrite and granodiorite porphyry. The Tumugou Formation strata were intruded by the quartz diorite porphyry with an age of 219.6±3.5 Ma (zircon U–Pb dating) (Pang et al., 2009). Then, quartz monzonite porphyry with an age of 212.8±1.9 Ma and granodiorite porphyry with an age of 206.3±0.7 Ma (zircon U–Pb dating) (Liu et al., 2013) crosscut the quartz diorite porphyry. The quartz monzonite porphyry is considered to be associated with mineralization because its age is similar to the molybdenite Re–Os isochron age of 213±3.8 Ma from the orebody (Zeng et al., 2004). Moreover, the Cu concentrations of the quartz monzonite porphyry are higher than those of the other porphyries.
The porphyry-type alteration zones transition from early potassium-silicate alteration through quartz sericite alteration to propylitization, upward and outward from the core of the quartz monzonite porphyry (Fig. 4). The wall rocks near the porphyries were mostly changed into hornfels. Systematic drilling has demonstrated that the potassium-silicate and quartz-sericite zones host the main orebodies, constituting the core of mineralized zones. The propylitic zones and hornfels only develop weak mineralization. The orebodies occur mainly in potassium silicate and quartz sericite and occur as veins in the propylitic zones and hornfels. The major rock types in the deposit are quartz monzonite porphyry, quartz diorite porphyrite, granite diorite porphyry, quartz diorite porphyry and hornfels (Fig. 2). Metallic minerals mainly include pyrite, chalcopyrite with a small amount of molybdenite and pyrrhotite (Fig. 3).
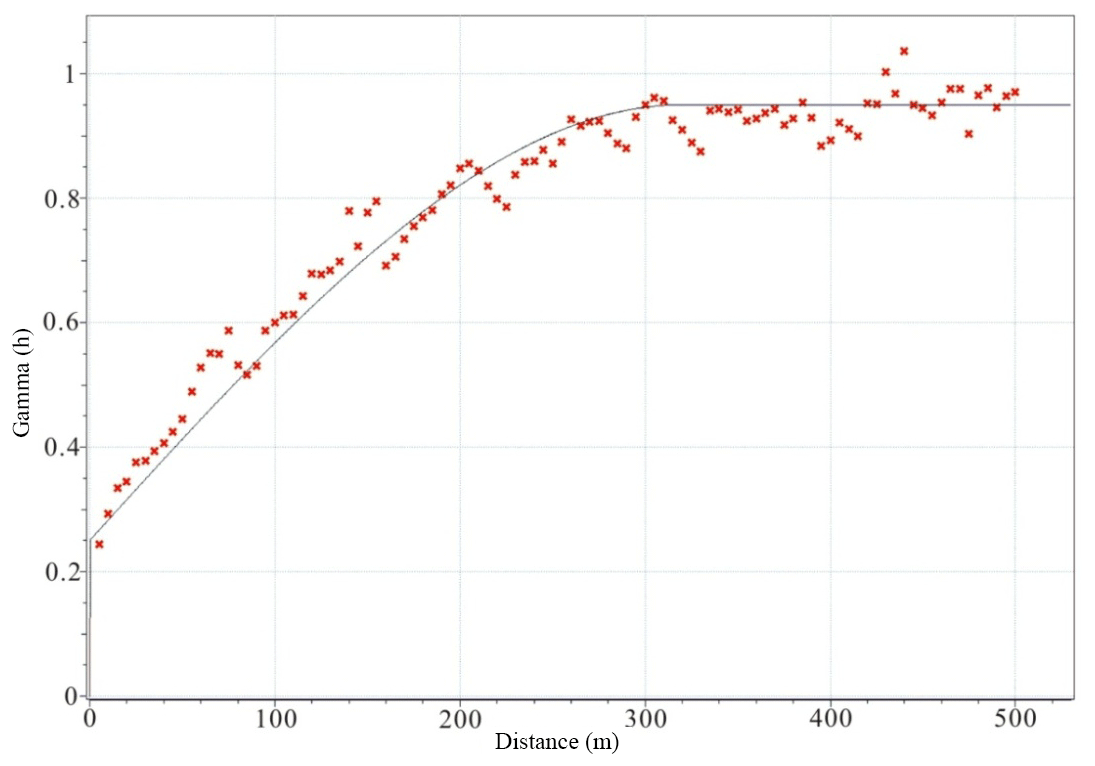
Based on the geological data (which include the collar coordinates of each drill hole, azimuth and dip (orientation) as well as lithology and mineralogy) recorded from 130 drill holes in the Pulang deposit, 20 492 lithogeochemical samples were collected at 2 m intervals. The laboratory of the Third Geological Team of the Yunnan Bureau of Geology and Mineral Resources utilized the iodine–fluorine and oscillo-polarographic method to analyze the concentrations of Cu and associated paragenetic elements, and its analytical uncertainty is less than 7 % (Yunnan Diqing Nonferrous Metal Co. Ltd., 2009). Only Cu concentrations were studied in this study. The histogram and Q-Q (quantile–quantile) plot of the log-transformed Cu data indicate that the distribution of Cu data is log-normal (Fig. 5). The experimental semivariogram of the Cu data of the Pulang deposit indicates a range and nugget effect of 320.0 m and 0.25, respectively (Fig. 6). The spherical model is fitted with regard to the experimental semivariogram. The 3-D model of the Cu concentration distribution of the Pulang deposit was produced with the ordinary kriging method using GEOVIA Surpac software on the basis of the semivariogram and anisotropic ellipsoid. Fundamentally, the accuracy of the interpolation results mainly depends on whether the interpolation model accurately fits the spatial distribution characteristics of the deposit. Ordinary kriging was used because it is compatible with a stationary model; it only requires a variogram, and it is the most commonly used form of kriging (Chilès and Delfiner, 1999). Goovaerts (1997) showed that the values in unsampled locations are estimated by the ordinary kriging method according to the moving average of the interest variables, satisfying various distribution forms of data. Ordinary kriging is a spatial estimation method in which the error variance is minimized. This error variance is based on the configuration of the data and its variogram (Yamamoto, 2005). The correct variogram in kriging interpolation can guarantee the accuracy of the interpolation results.
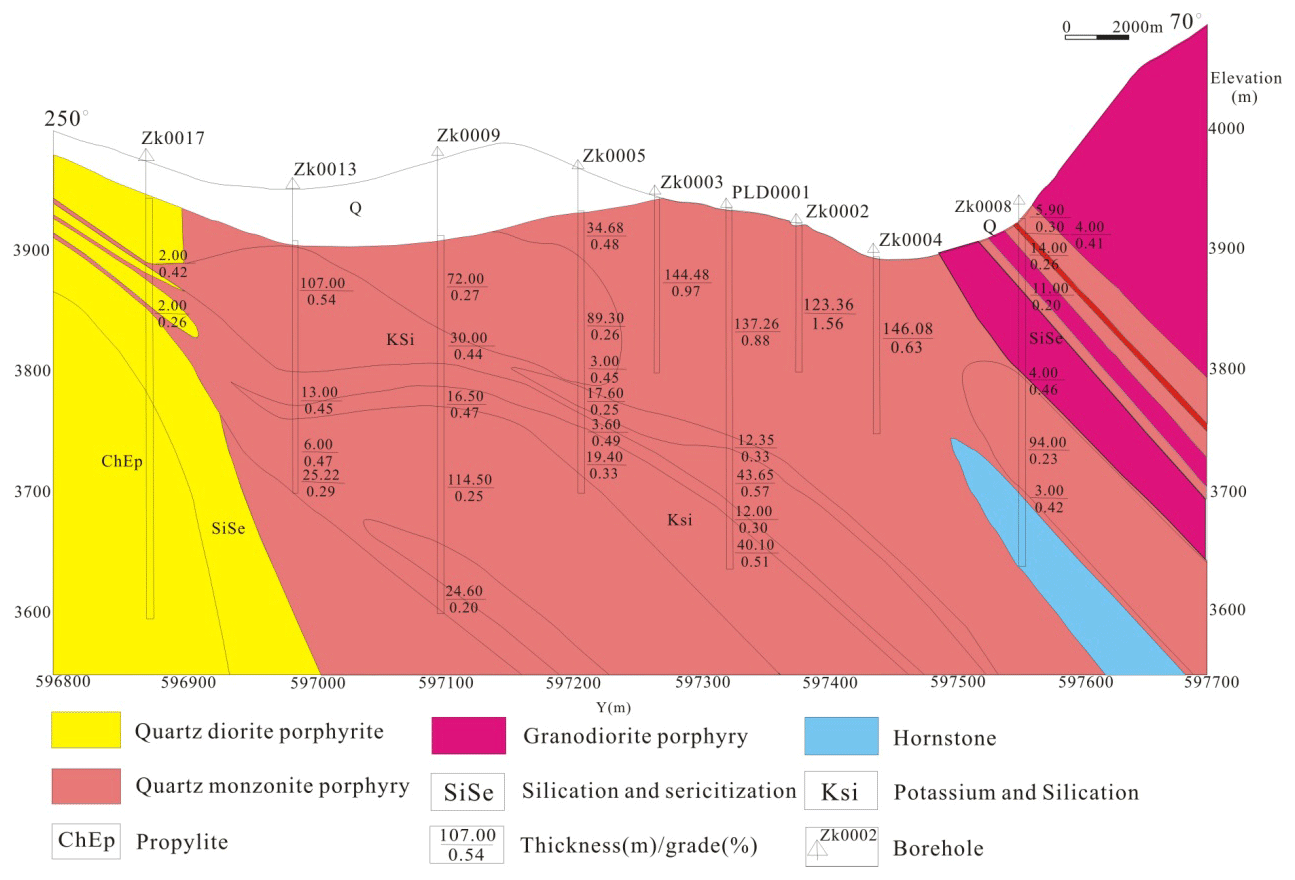
Figure 4Cross section along exploration line 0 in the Pulang porphyry copper deposit, SW China. Modified after Wang et al. (2012).
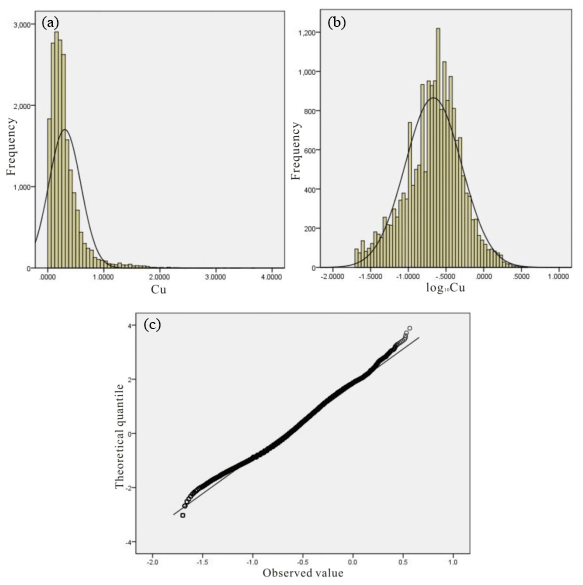
Figure 5Histograms of (a) the Cu raw and (b) logarithmic transformation data and (c) the Q-Q plot of the log-transformed Cu data in the Pulang deposit.
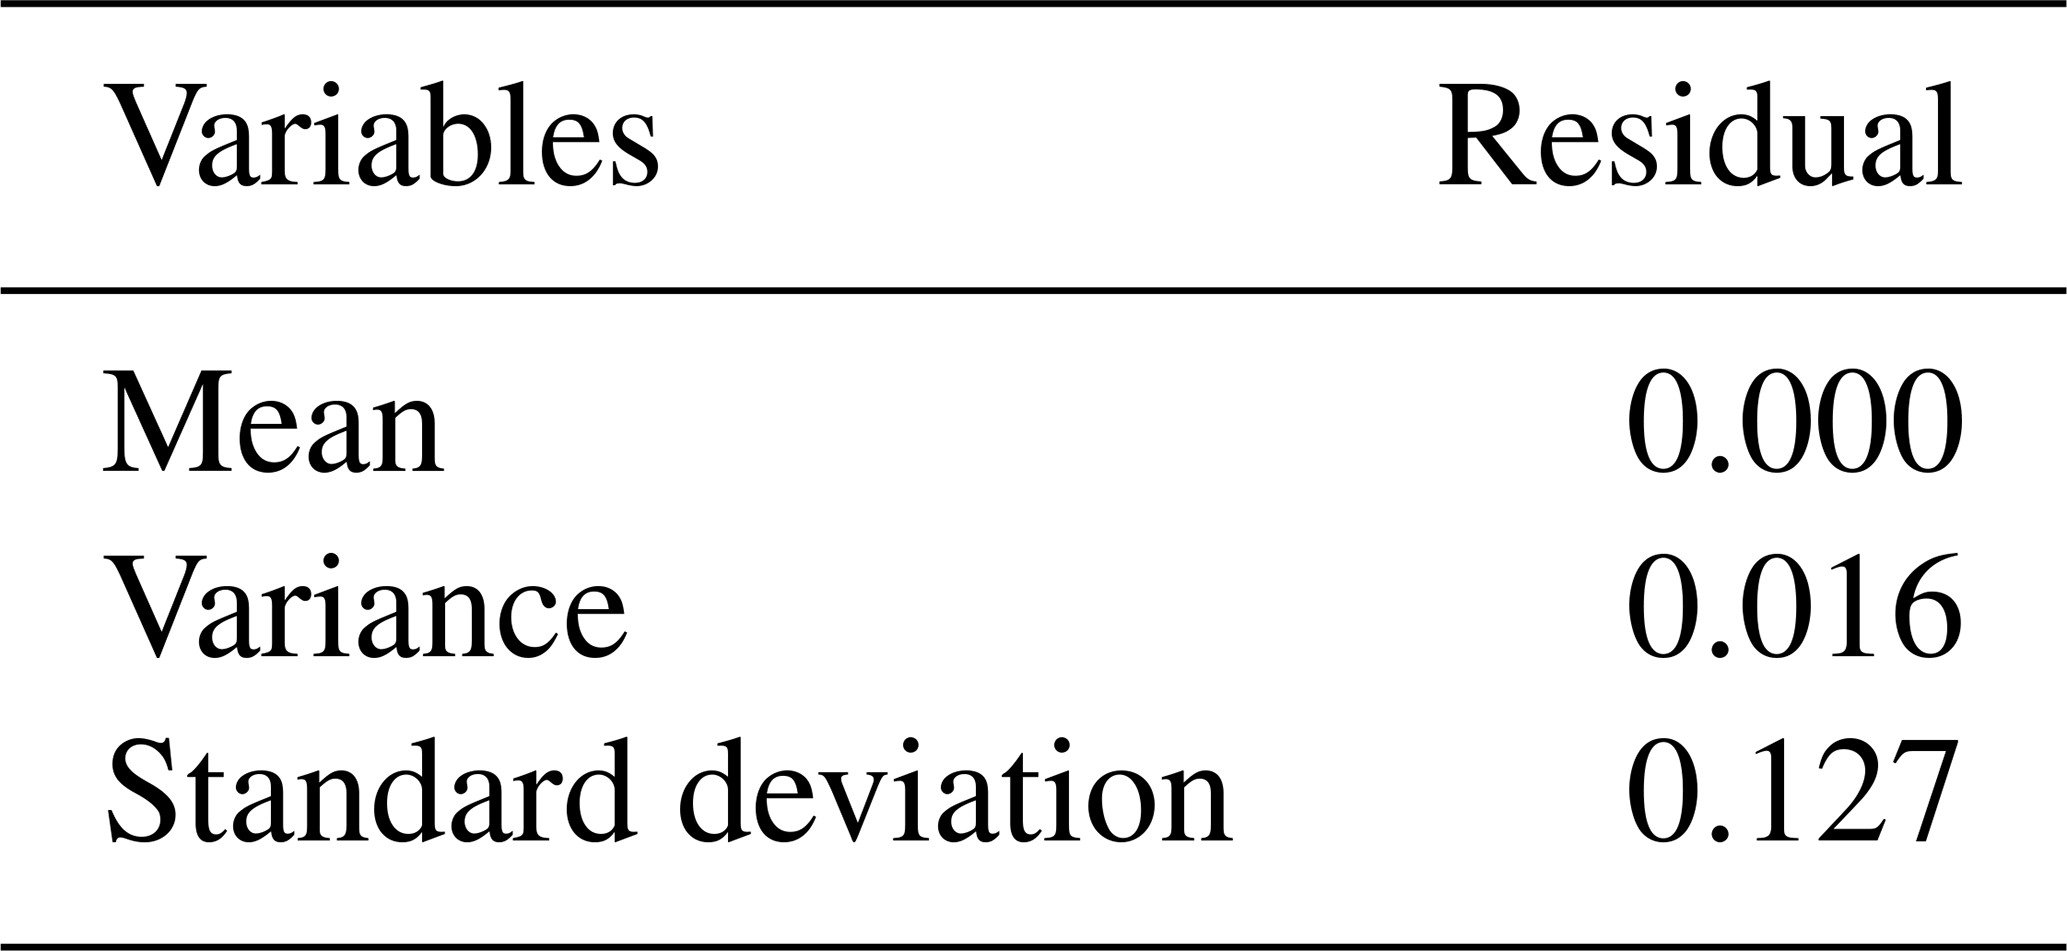
The accuracy of the spatial interpolation analysis is verified by comparing the difference between the measured values and the predicted values to select the best variogram model. To test the variogram model, the cross-validation method was used to determine whether the parameters of the variogram model were correct. The distribution of the residual is normal (Fig. 7), and the mean error between the actual and estimated Cu grades is equal to 0 (Table 1). This result indicates that this model is reasonable and that the variogram parameters used for estimating the Cu grade are unbiased.
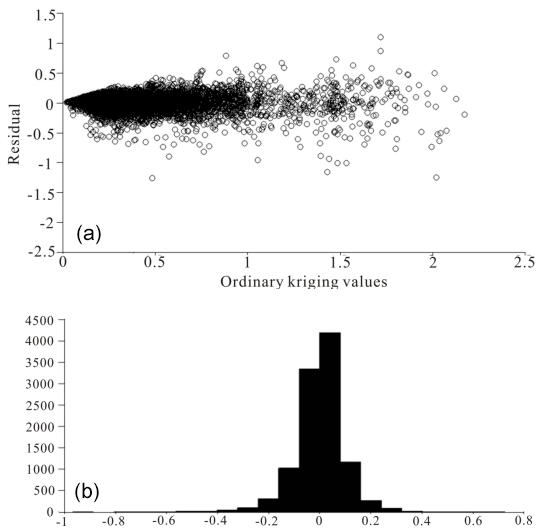
Figure 7The cross-validation results: (a) residual vs. Cu grade; (b) the residual distribution histogram.
The obtained block models were used as inputs to the fractal models. The Pulang deposit was modeled by m voxels, and they were decided by the grid drilling dimensions and geometrical properties of the deposit (David, 1970). The Pulang deposit is modeled with 150 973 voxels in total. The terms “highly”, “moderately” and “weakly” have been used to classify mineralized zones based on fractal modeling, in accordance with the classification of the ore grades in the deposit.
4.1 Number–size (N-S) fractal modeling
The N-S model was applied to the Cu data (Fig. 8). The selection of breakpoints as threshold values is an objective decision because geochemical populations are defined by different line segments in the N-S log–log plot. The straight fitted lines were obtained based on least-square regression (Agterberg et al., 1996; Spalla et al., 2010). In other words, the intensity of element enrichment is depicted by each slope of the line segments in the N-S log–log plots (Afzal et al., 2010; Bai et al., 2010).
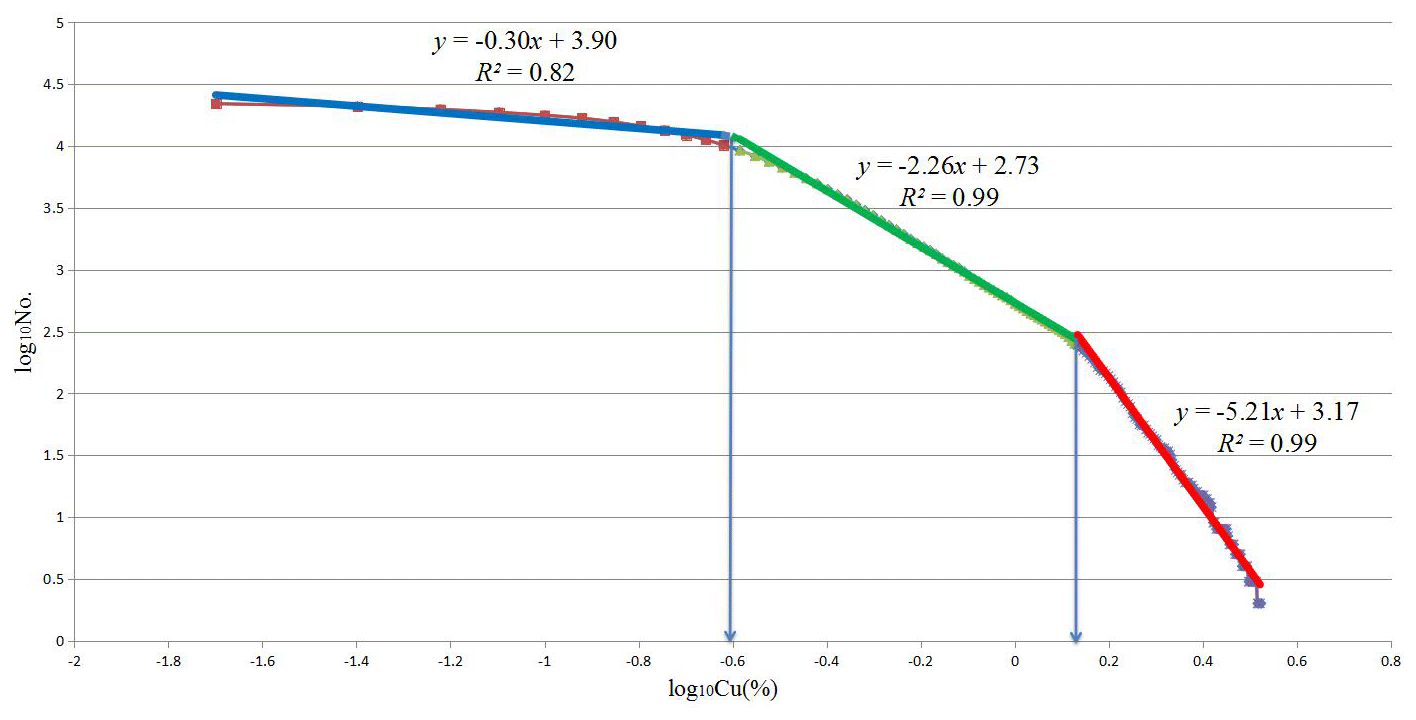
Based on the classification of the 3-D model of Cu data and the thresholds obtained from the N-S fractal model (Table 2), highly mineralized zones are situated in the southern and central parts of the Pulang deposit and coincide with the potassium-silicate alterations. However, small and highly mineralized zones are located in the central parts of the Pulang deposit (Fig. 9). Moderately mineralized zones occur along a northwest–southeast trend and correlate with the phyllic zones. Weakly mineralized zones and barren host rocks are situated in the marginal parts of the area.
Table 2Threshold concentrations obtained by using a N-S model based on the copper percentage (Cu %) in the Pulang deposit.
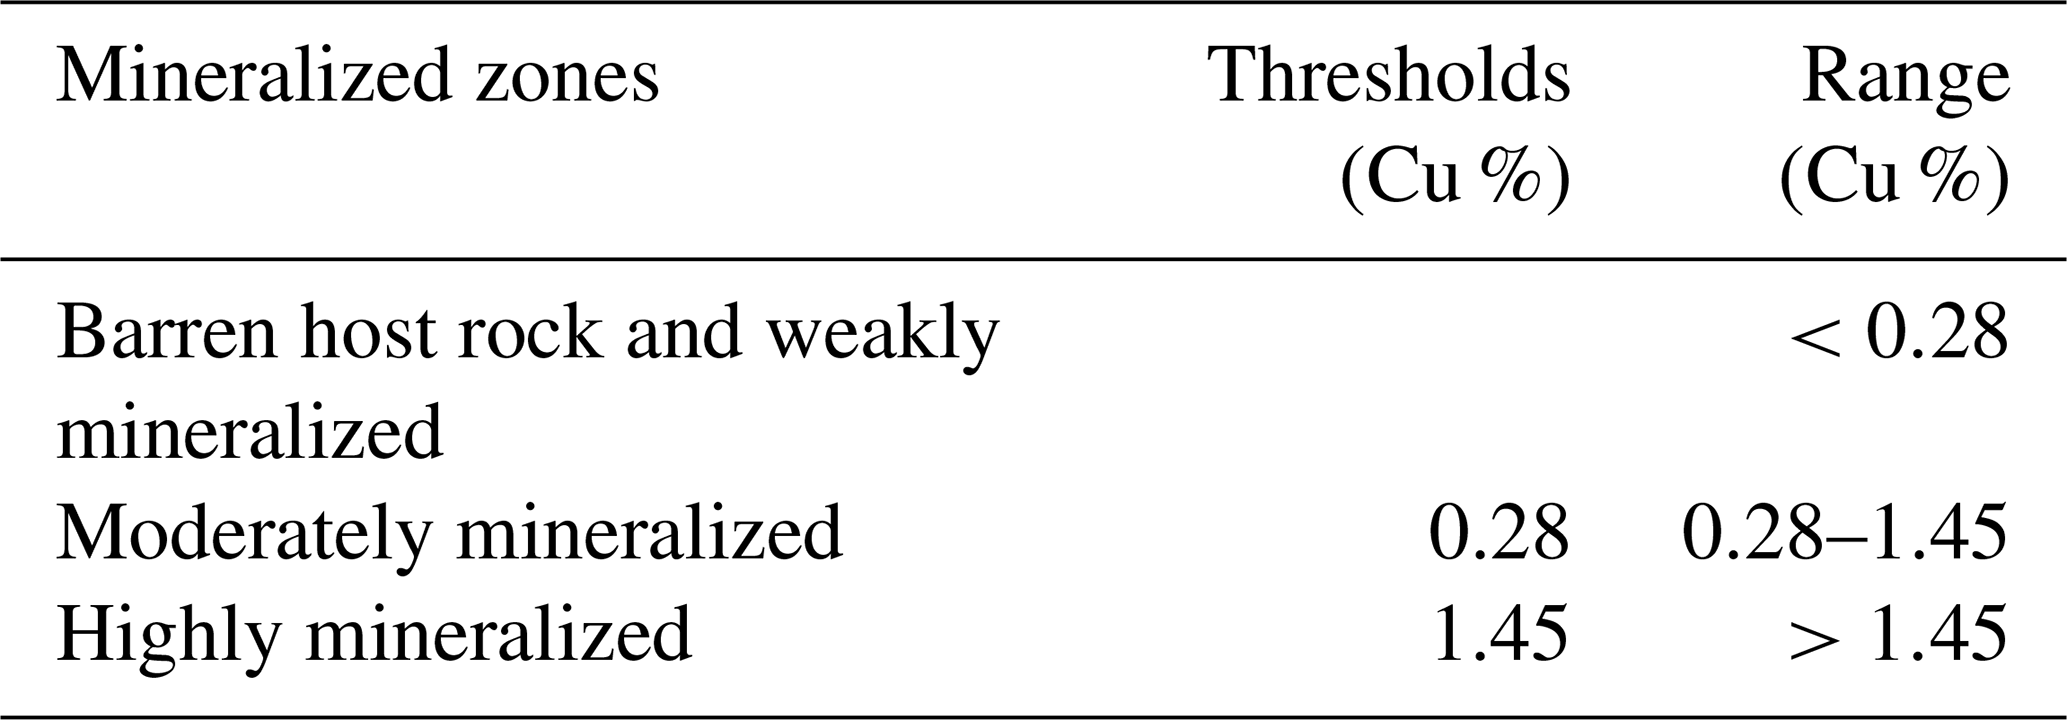
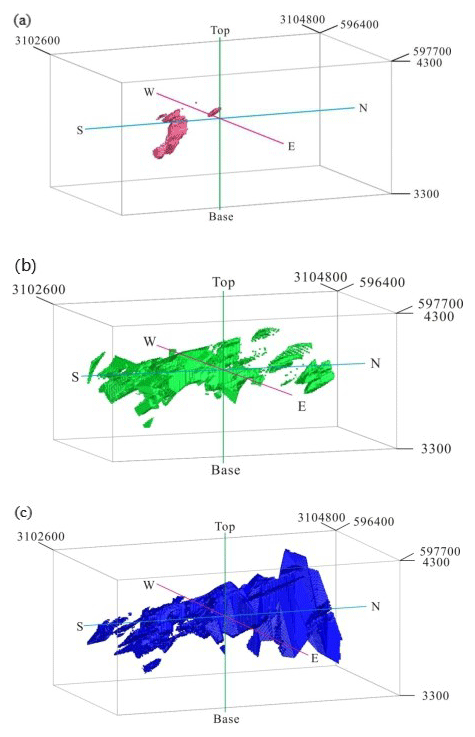
Figure 9Zones in the Pulang deposit based on thresholds defined from the N-S fractal model of Cu data: (a) highly mineralized zones; (b) moderately mineralized zones; (c) weakly mineralized zones and barren host rocks. Scale is in cubic meters (m3).
4.2 Concentration–volume (C-V) fractal modeling
The occupied volumes corresponding to the Cu grades were computed to obtain the C-V model according to the 3-D model of the Pulang deposit. Through the obtained C-V log–log plot, the threshold values of the Cu grades were determined (Fig. 10). These results indicate the power-law relationship between Cu grade and volume. According to these results (Table 3), the low-concentration zones exist in many parts of the deposit and occur along a northwest–southeast trend. Moderately and highly mineralized zones are situated in several parts of the central deposit and to the south of the deposit (Fig. 11).
Table 3Threshold concentrations obtained by using a C-V model based on copper percentage (Cu %) in the Pulang deposit.

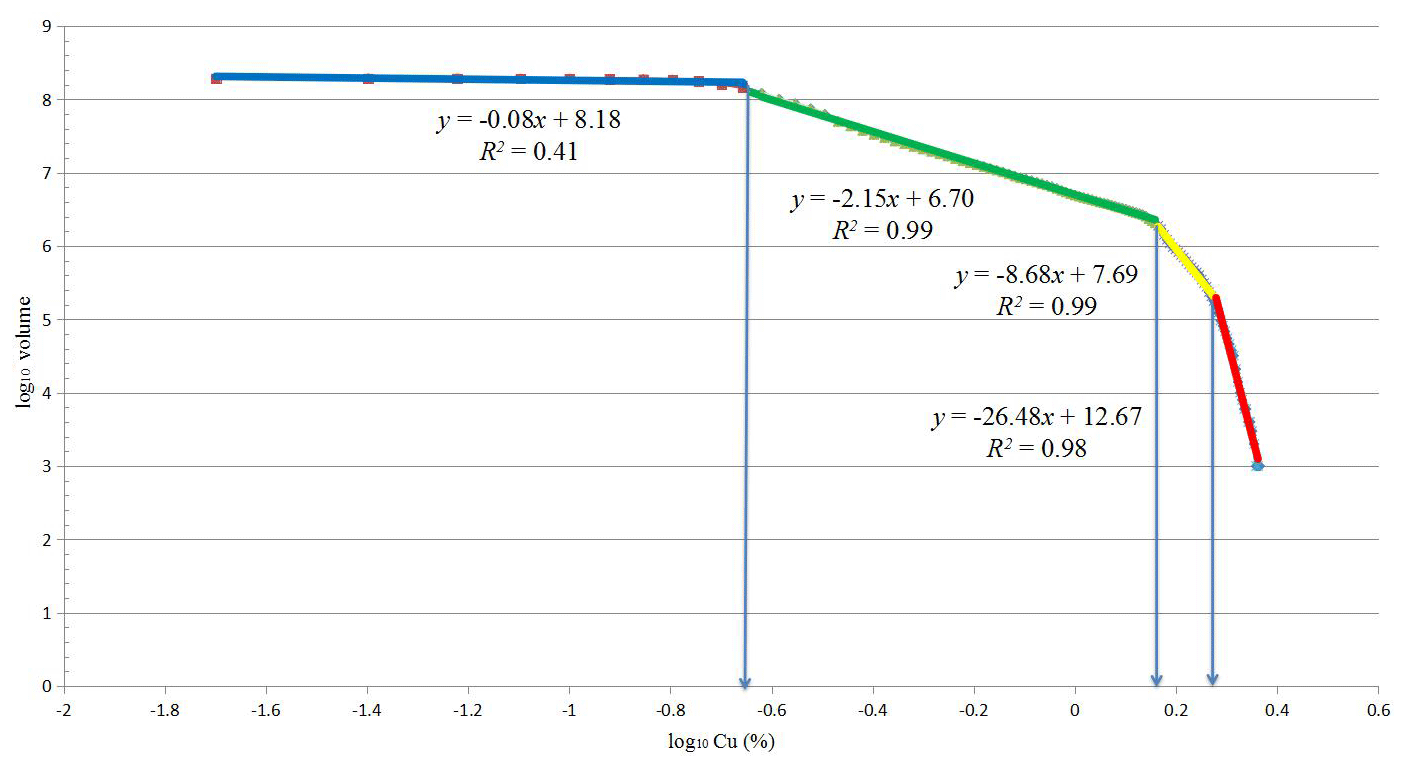
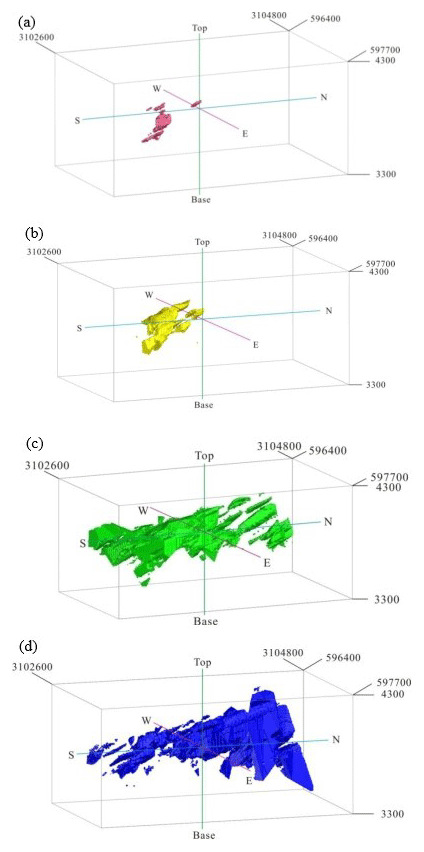
Figure 11Zones in the Pulang deposit based on thresholds defined from the C-V fractal model of Cu data: (a) highly mineralized zones; (b) moderately mineralized zones; (c) weakly mineralized zones; (d) barren host rock. Scale is in cubic meters (m3).
4.3 Power spectrum-volume (S-V) fractal modeling
Based on the geological data (which include the collar coordinates of each drill hole, azimuth and dip (orientation) as well as lithology and mineralogy) recorded from 130 drill holes in the deposit, a 3-D model and block model of the distribution of Cu in the Pulang deposit were constructed with ordinary kriging using GEOVIA Surpac software.
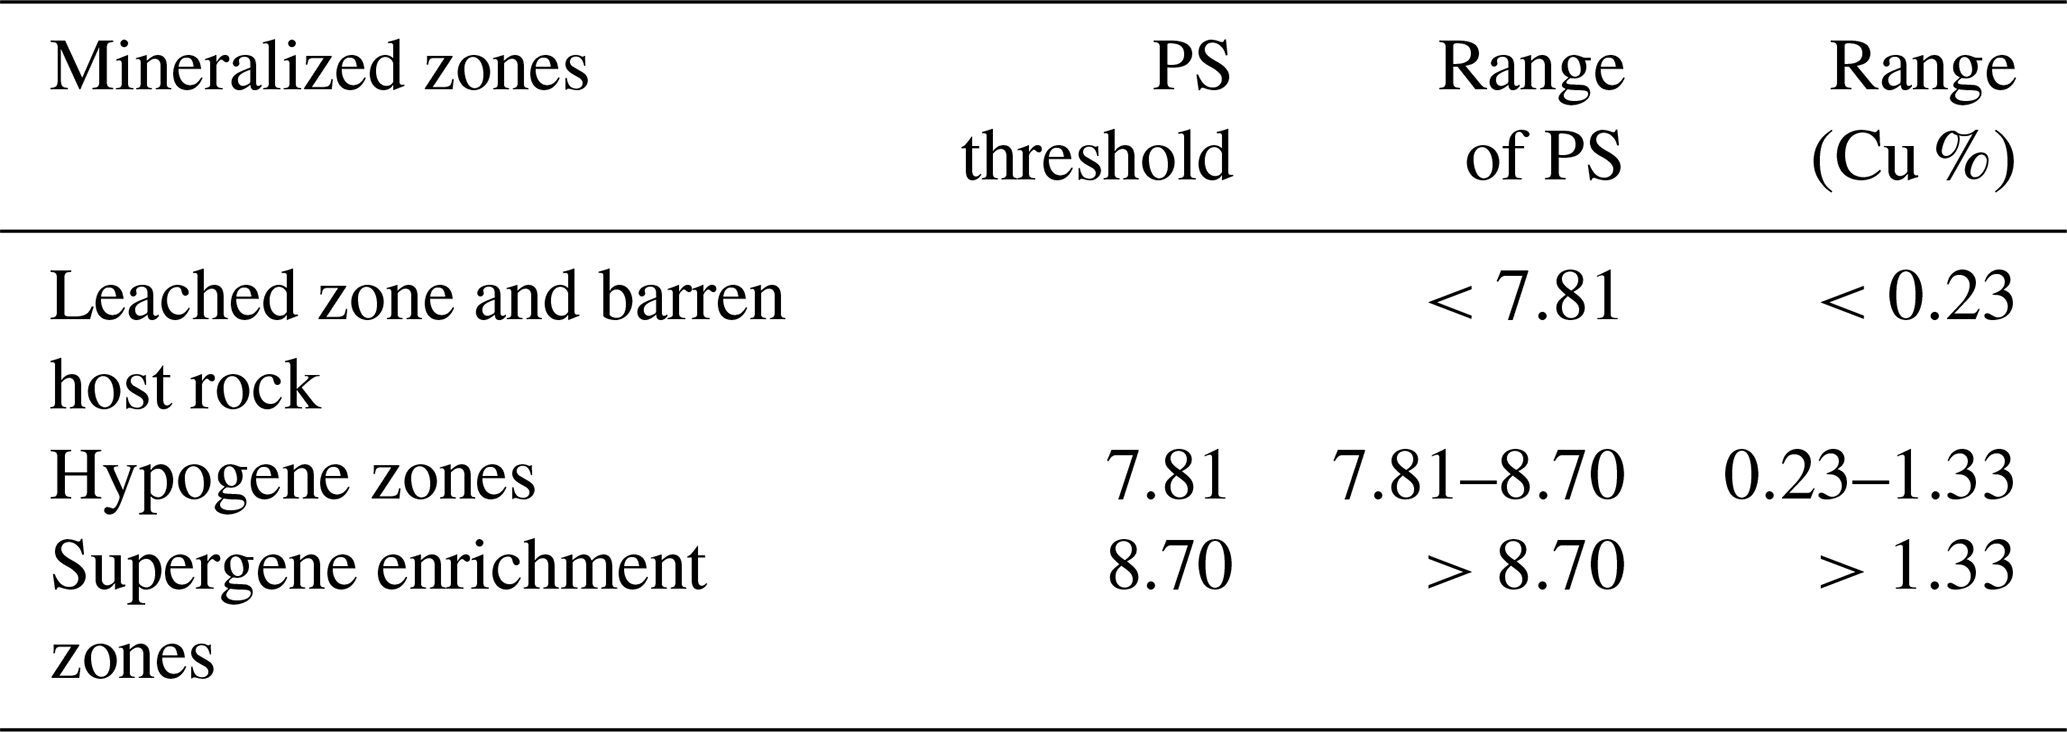
The power spectrum (S) was calculated for the 3-D elemental distribution using 3-D fast Fourier transformation in MATLAB (R2016a). The logarithmic values of the power spectra and relevant volumes were plotted against each other (Fig. 12). The straight lines fitted in the log–log plot indicate different relationships between the power spectra and occupied volumes. The thresholds of log S=7.81 and log S=8.70 were determined by the log–log S-V plot. The 3-D filters were designed to separate different mineralization zones on the basis of these threshold values. Inverse fast Fourier transformation was used to convert the decomposed components back into the space domain by using MATLAB (R2016a). According to the results, the Cu concentrations of the hypogene zones range from 0.23 % to 1.33 % (Table 4), and values of >1.33 % Cu correspond to the supergene enrichment zones, whereas values of <0.23 % Cu correspond to the leached zone and barren host rocks (Fig. 13).

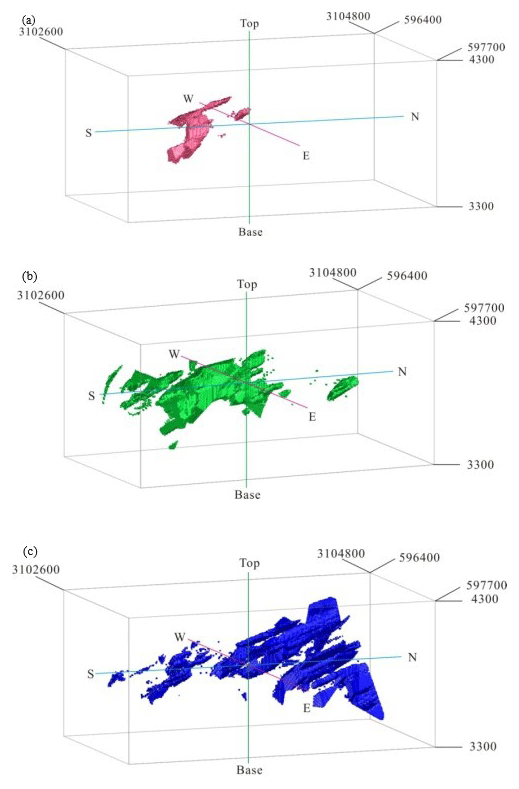
Figure 13Zones in the Pulang deposit based on thresholds defined from the S-V fractal model of Cu data: (a) the supergene enrichment zones, (b) the hypogene zones, (c) the leached zone and barren host rock. Scale is in cubic meters (m3).
Table 4Ranges of the power spectrum (PS) for different mineralization zones in the Pulang deposit.
Alteration models have a key role in zone delineation and in presenting geological models, as described by Lowell and Guilbert (1970). The potassic and phyllic alterations control major mineralization within supergene enrichment and hypogene zones according to these models. Models of Cu mineralization zones derived via fractal models can be compared with geological data to validate the results of analysis in different porphyry Cu deposits. The results of the fractal modeling of the Pulang deposit were compared with the 3-D geological model of the deposit constructed by using GEOVIA Surpac and drill hole data (Fig. 2). Moreover, the results obtained from these fractal models were controlled by mineralogical investigations.
Table 5Matrix for comparing performance of fractal modeling results with the geological model. A, B, C and D represent the number of voxels in overlaps between classes in the binary geological model and the binary results of fractal models (Carranza, 2011).
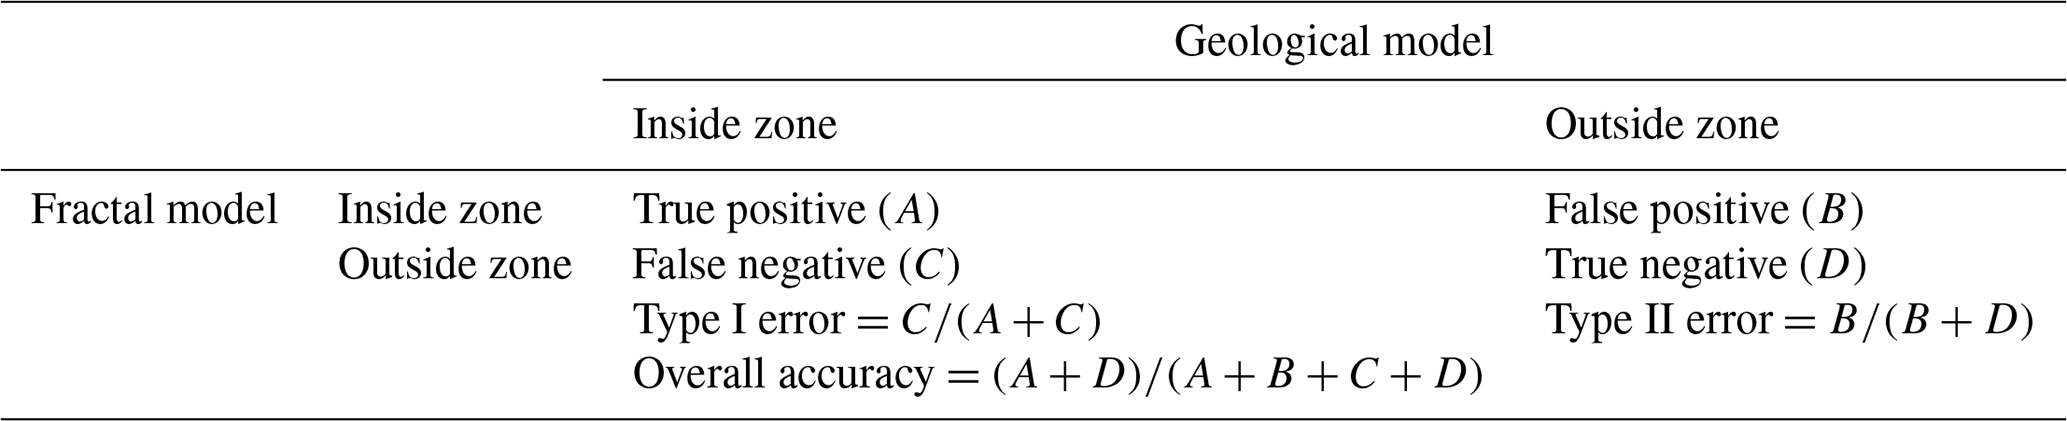
Carranza (2011) has illustrated an analysis for the calculation of spatial correlations between two binary datasets, especially mathematical and geological models. An intersection operation between the mineralization zones obtained from fractal models and the different alteration zones in the geological model was performed to derive the amount of voxels corresponding to each of the classes of overlap zones (Table 5). Using the obtained numbers of voxels, the Type I error (T1E), Type II error (T2E) and overall accuracy (OA) of the fractal model were estimated with respect to different alteration zones and the geological data (Carranza, 2011). The OAs of the fractal models of the mineralized zones were compared as follows.
A comparison between highly mineralized zones based on the fractal models and potassic alteration zones resulting from the 3-D geological model shows that there is a similarity among these fractal models (Fig. 14). The overall accuracies for the C-V, N-S and S-V models are 0.50, 0.51 and 0.52, respectively (Table 6), which indicate that the S-V model gives better results for identifying highly mineralized zones in the deposit. The number of overlapped voxels (A) in the S-V model is higher than those in the N-S and C-V models. The correlation (from OA results) between highly mineralized zones obtained from S-V modeling and potassic alteration zones is better than that of the N-S and C-V model because of a strong proportional relationship between the extension and positions of voxels in the S-V model and the potassic alteration zones in the 3-D geological model.
Table 6Overall accuracy (OA), Type I and Type II errors (T1E and T2E, respectively) with respect to potassic alteration zone, resulting from the geological model and threshold values of Cu obtained through C-V, N-S and S-V fractal modeling.
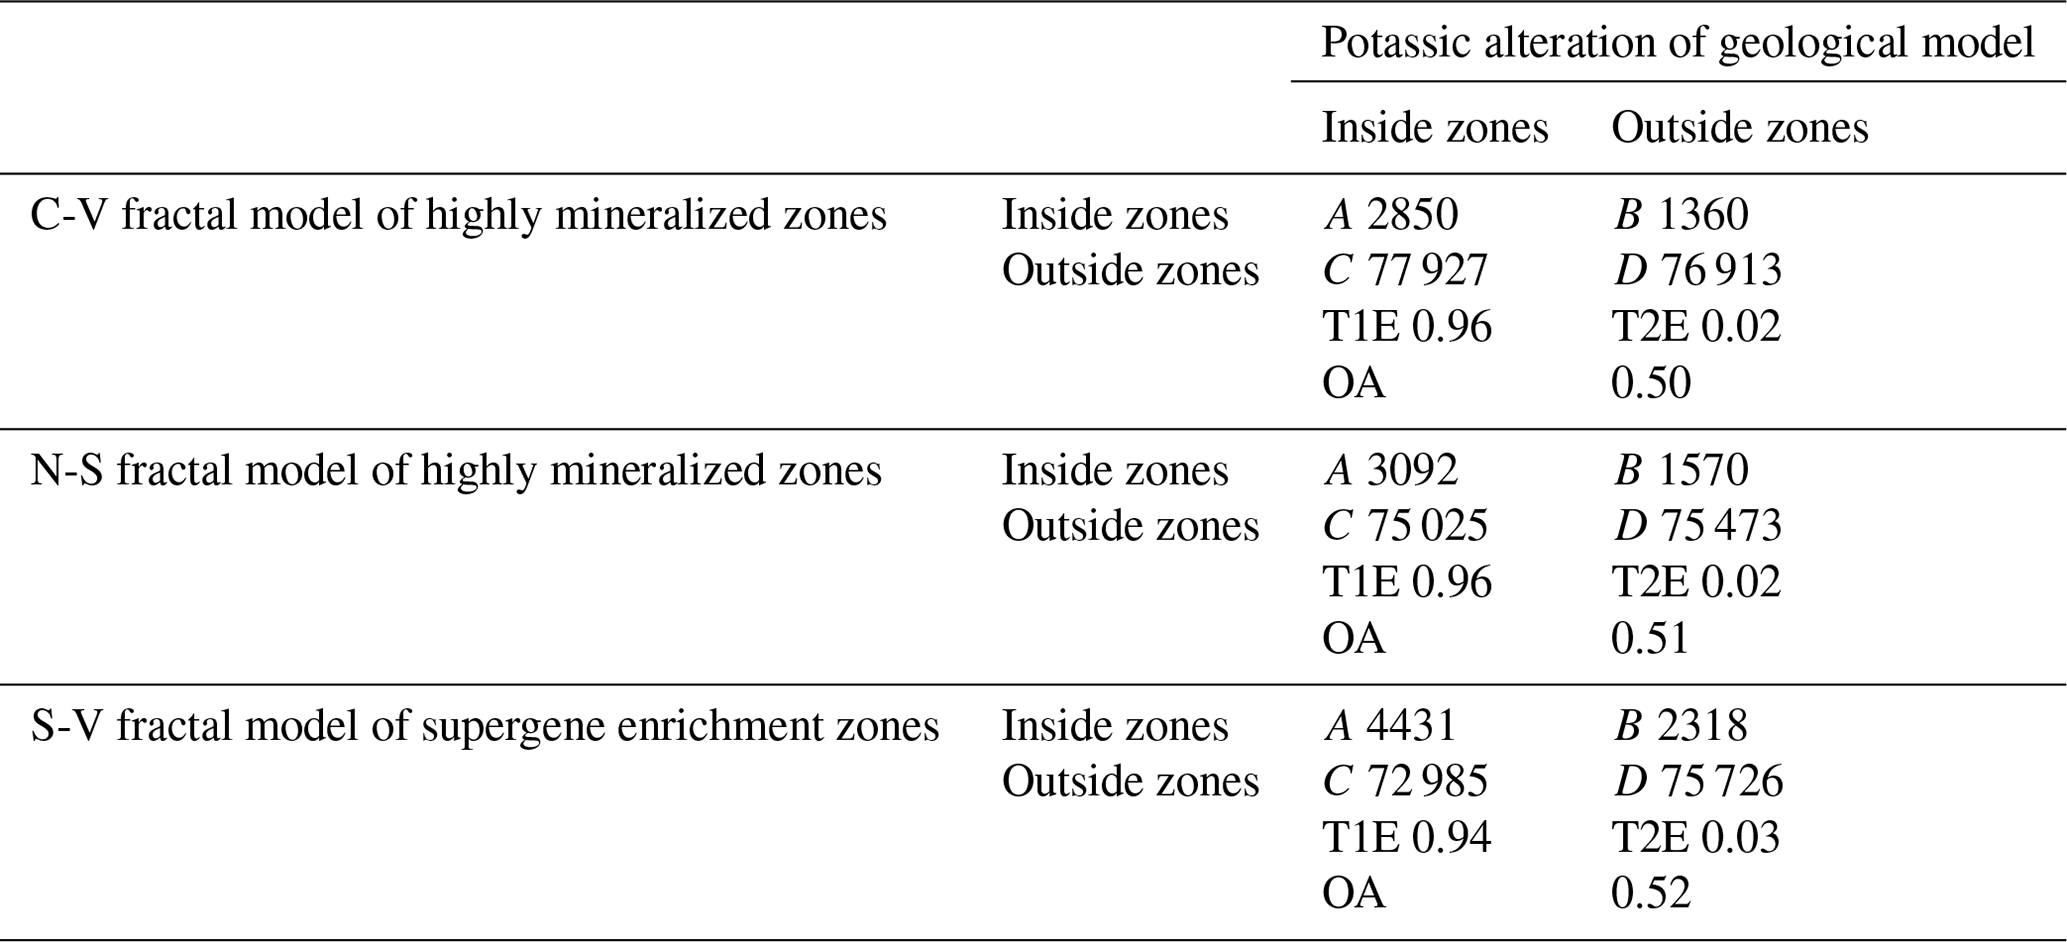
Table 7Overall accuracy (OA), Type I and Type II errors (T1E and T2E, respectively) with respect to phyllic alteration zone, resulting from the geological model and threshold values of Cu obtained through C-V, N-S and S-V fractal modeling.
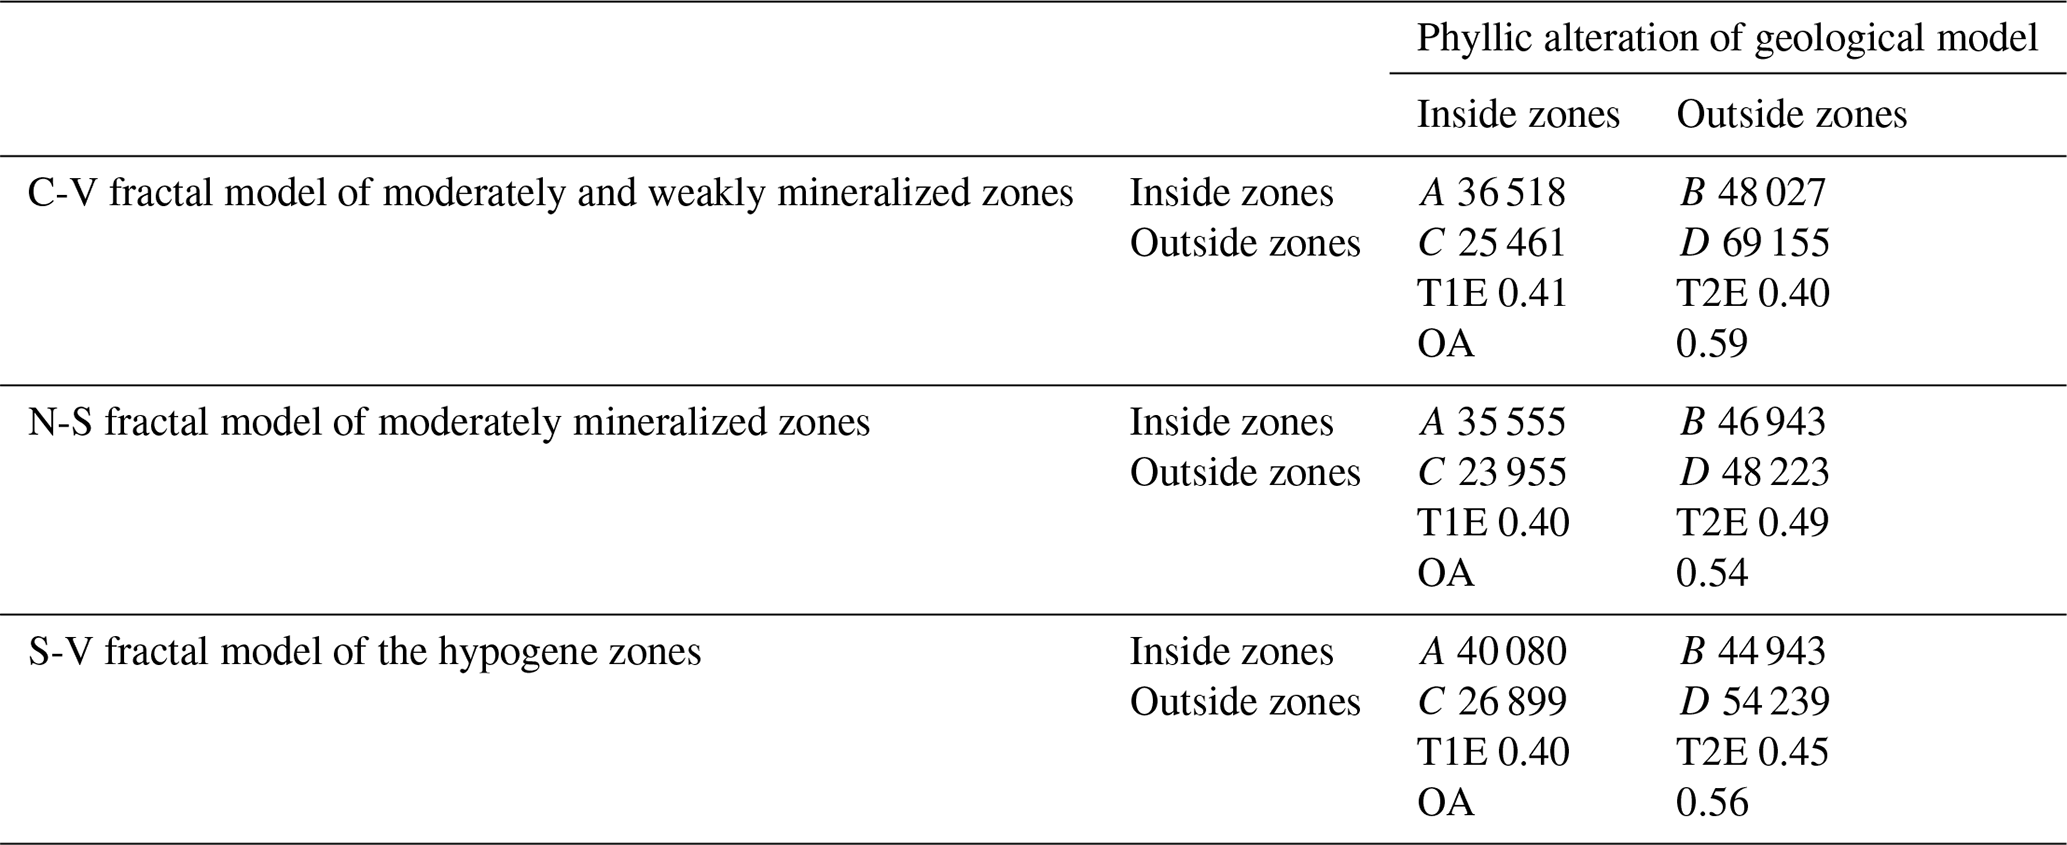
Table 8Results of XRF analysis of samples collected from different mineralized zones in the Pulang porphyry copper deposit.
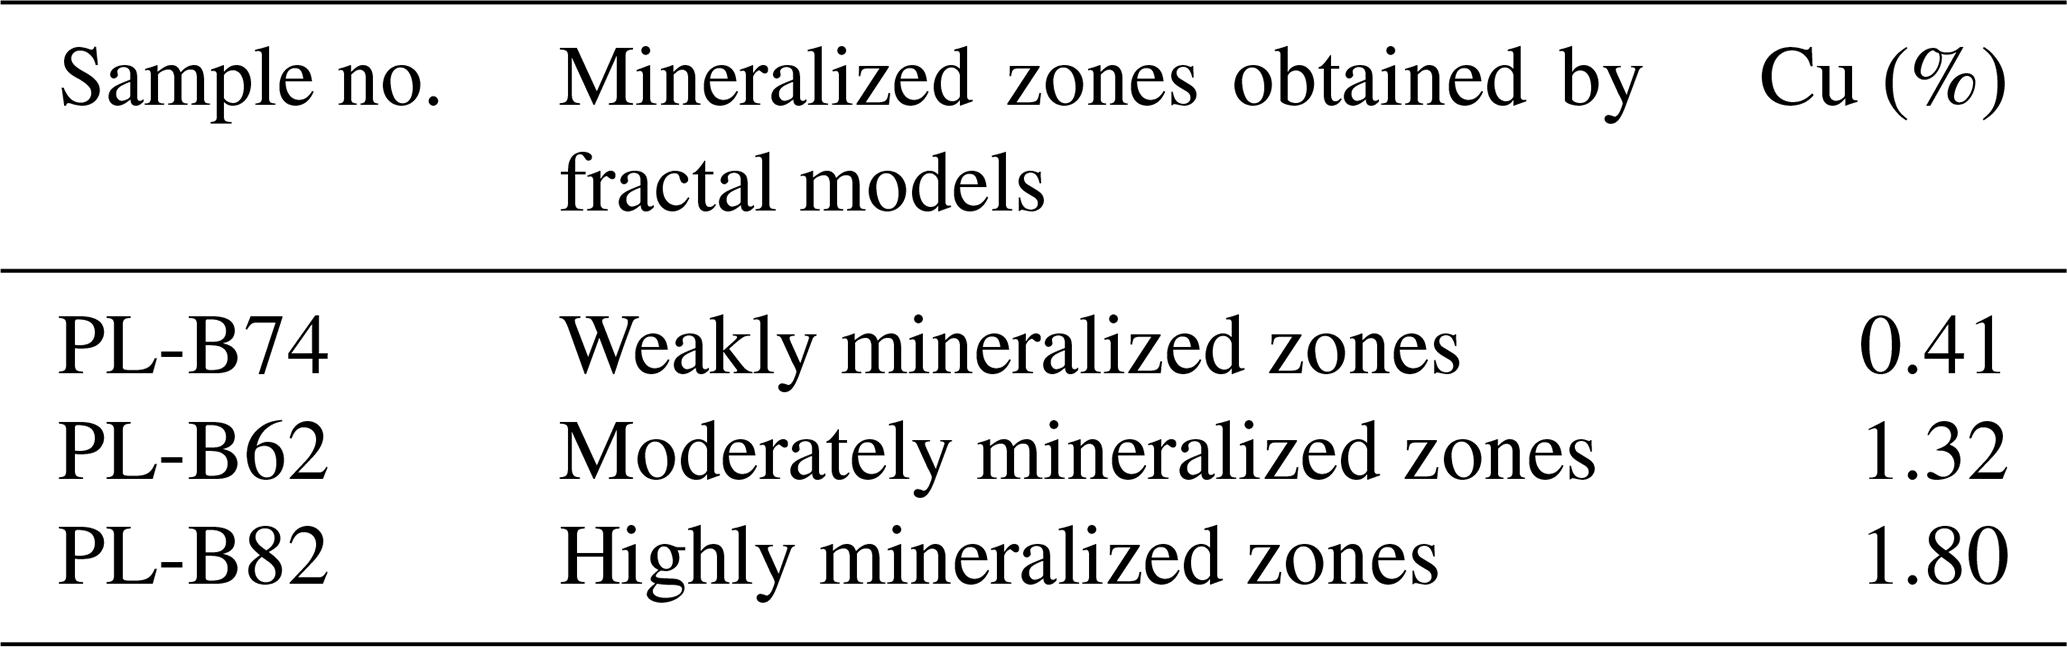
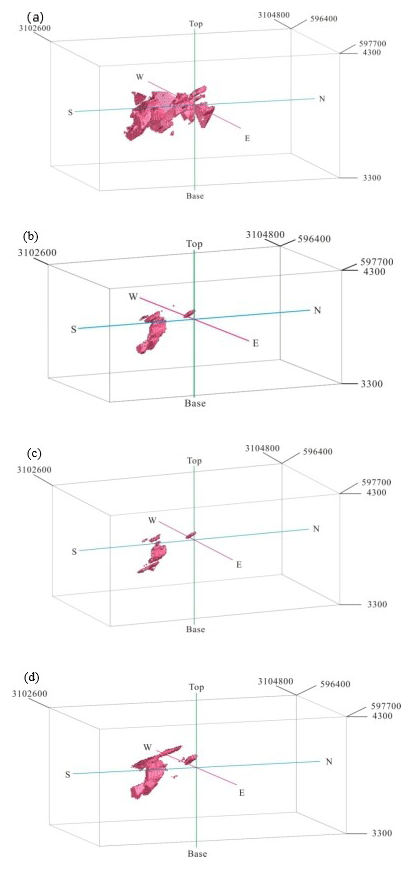
Figure 14Highly mineralized zones in the Pulang deposit: (a) potassium-silicate zone resulting from the 3-D geological model from drill hole geological data, (b) N-S modeling of Cu data, (c) C-V modeling of Cu data and (d) S-V modeling of Cu data. Scale is in cubic meters (m3).
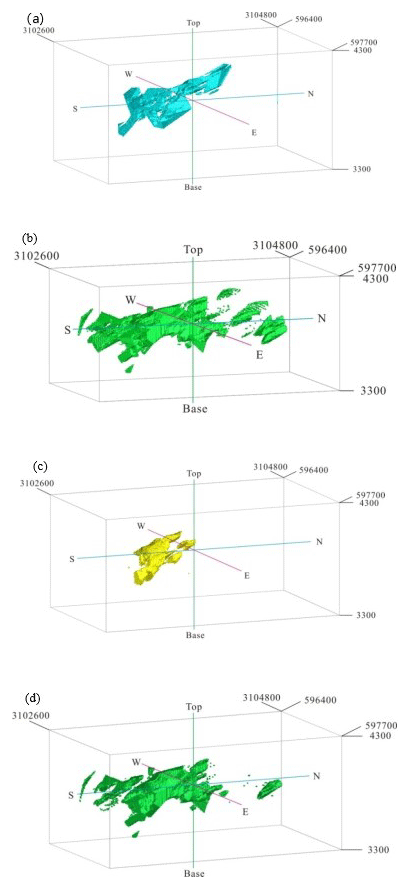
Figure 15Moderately mineralized zones in the Pulang deposit: (a) quartz–sericite zones resulting from the 3-D geological model from drill hole geological data, (b) N-S modeling of Cu data, (c) C-V modeling of Cu data and (d) S-V modeling of Cu data. Scale is in cubic meters (m3).
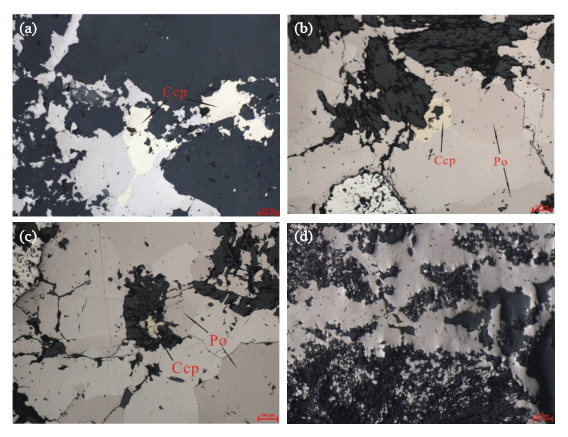
Figure 16Chalcopyrite content in several samples based on mineralographical study: (a) the PL-B82 sample was collected from the drill hole situated in the high-grade mineralization zones, (b) the PL-B62 sample was collected from the drill hole situated in the moderate-grade mineralization zones, (c) and (d) the PL-B74 sample was collected from the drill hole located at the weakly mineralized zones.
A comparison between phyllic alteration zones resulting from the 3-D geological model and moderately and weakly mineralized zones from the fractal modeling shows that the overall accuracies of the C-V, N-S and S-V fractal models with respect to phyllic alteration zones of the geological model are 0.59, 0.54 and 0.56, respectively. The overall accuracy of moderately and weakly mineralized zones obtained from C-V modeling is higher than that of mineralized zones obtained from N-S and S-V modeling (Table 7). On the other hand, moderately mineralized zones defined by C-V modeling overlap with phyllic zones defined by the 3-D geological model (Fig. 15). However, the results of the C-V model are more accurate than those of the N-S and S-V models with respect to the phyllic zones defined by the 3-D geological model.
It could be considered that there are spatial correlations between different modeled Cu zones and geological features such as alterations and mineralogy. Several samples were collected from different drill holes in different grades of mineralization zones of the Pulang deposit to validate the results of the fractal models. These samples were analyzed by microscopic identification and XRF (X-ray fluorescence spectrometry). The PL-B82 sample was collected from the drill hole situated in a high-grade mineralization zone and includes a high chalcopyrite content and some molybdenite (Fig. 16a). The PL-B62 sample was collected from the drill hole situated in a moderate-grade mineralization zone and includes a low chalcopyrite content and some pyrrhotite in the polished section (Fig. 16b). The PL-B74 sample was collected from the drill hole located in a weakly mineralized zone with lower chalcopyrite content and some pyrrhotite (Fig. 16c and d). The results obtained from the mineralogy, microscopic identification and drill hole scanning by XRF of these samples indicate that the Cu concentrations are 1.80 %, 1.32 % and 0.41 % in the PL-B82, PL-B62 and PL-B74 samples, respectively (Table 8).
In many cases, drill hole logging is dealing with the lack of proper diagnosis of geological phenomena, which can undermine the delineation of mineralized zones because it depends on the subjective interpretation of individual loggers, and no two loggers provide the same interpretations. However, conventional geological modeling based on drill hole data is fundamentally important for understanding the orebody spatial structure. Grades of ore elements are not determined by conventional methods of geological ore modeling, while the variation in ore grades in a mineral deposit is an obvious and salient feature. Given the problems mentioned above, using a series of newly established methods based on mathematical analyses such as fractal modeling seems to be inevitable.
In this paper, the number–size (N-S), concentration–volume (C-V) and power spectrum-volume (S-V) fractal models were used to delineate and recognize various Cu mineralized zones of the Pulang porphyry copper deposit in the southern end of the Yidun continental arc, southwestern China. All these fractal models reveal that high-grade Cu mineralized zones are situated in the central and southern parts of the deposit. The Cu threshold values of highly mineralized zones are 1.45 % and 1.88 % based on the N-S and C-V fractal models. The Cu threshold of supergene enrichment zones is 1.33 % based on the S-V fractal model. The models of moderately mineralized zones contain 0.28 %–1.45 % Cu according to the N-S model and 1.48 %–1.88 % Cu according to the C-V model. The hypogene zones contain 0.23 %–1.33 % Cu according to the S-V model. The N-S model reveals weakly mineralized zones and barren host rocks containing <0.28 % Cu. In contrast, the C-V model reveals that the barren host rocks contain <0.25 % and that the weakly mineralized zones contain 0.25 %–1.48 % Cu. The S-V model reveals that the barren host rock and leached zone contain <0.23 % Cu.
The comparison between highly mineralized zones based on the fractal models and potassic zones resulting from the 3-D geological model illustrates that the S-V fractal model is better than the N-S and C-V model because the number of overlapped voxels (A) in the S-V model is higher than those in the N-S and C-V model. The overall accuracies for the C-V, N-S and S-V models are 0.50, 0.51 and 0.52, respectively (Table 6), which indicates that the S-V model gives the best results for identifying highly mineralized zones in the deposit. On the other hand, the correlation (from OA results) between the highly mineralized zones obtained from S-V modeling and the potassic alteration zones is better than those of the N-S and C-V models because of a strong proportional relationship between the extension and positions of the voxels in the S-V model and potassic alteration zones in the 3-D geological model.
A comparison between phyllic alteration zones obtained from the 3-D geological model and moderate-grade mineralization zones obtained from the fractal models indicates that the OA values of the C-V, N-S and S-V fractal methods in reference to the phyllic alteration zones of the geological model are 0.59, 0.54 and 0.56, respectively. The overall accuracy of the moderately and weakly mineralized zones obtained from C-V modeling is higher than the mineralized zones obtained from N-S and S-V modeling (Table 7).
According to the correlation between the results driven by fractal modeling and geological logging from drill holes in the Pulang porphyry copper deposit, high-grade mineralization zones generated by fractal models, especially the S-V model, have a better correlation with potassic alteration zones resulting from the 3-D geological model than from the N-S and C-V models. The highly and moderately mineralized zones obtained from the fractal models are both situated in the southern and central parts of the Pulang deposit and coincide with potassic and phyllic alteration zones. There is a better relationship between the moderately and weakly mineralized zones derived by the C-V model and the phyllic alteration zones from the 3-D geological model than those derived by the N-S and S-V models.
The underlying data is confidential information and therefore cannot be made publicly accessible.
XW is the major contributor to this paper, including writing this paper, data processing and so on. QX provided many critical reviews and constructive suggestions. TL, SL, YL, LK and ZC participated in the field investigation. LW provided parts of the raw data.
The authors declare that they have no conflict of interest.
This research was supported by the National Key R&D Program of China (2016YFC0600508). The authors thank Tao Dong, Haijun Yu, Qiwu Shen, Zhipeng Li, Baosheng Shi and Jinhong Yang for supporting in field investigation and providing parts of the raw data.
This research has been supported by the National Key R&D Program of China: The three-dimensional prediction model of deep minerals and virtual reality (grant no. 2016YFC0600508).
This paper was edited by Behzad Ghanbarian and reviewed by two anonymous referees.
Afzal, P., Khakzad, A., Moarefvand, P., Rashidnejad Omran, N., Esfandiari, B., and Fadakar Alghalandis, Y.: Geochemical anomaly separation by multifractal modeling in Kahang (GorGor) porphyry system, Central Iran, J. Geochem. Explor., 104, 34–46, 2010.
Afzal, P., Fadakar Alghalandis, Y., Khakzad, A., Moarefvand, P., and Rashidnejad Omran, N.: Delineation of mineralization zones in porphyry Cu deposits by fractal concentration–volume modeling, J. Geochem. Explor., 108, 220–232, https://doi.org/10.1016/j.gexplo.2011.03.005, 2011.
Afzal, P., Fadakar Alghalandis, A., Moarefvand, P., Rashidnejad Omran, N., and Asadi Haroni, H.: Application of power–spectrum–volume fractal method for detecting hypogene, supergene enrichment, leached and barren zones in Kahang Cu porphyry deposit, Central Iran, J. Geochem. Explor., 112, 131–138, https://doi.org/10.1016/j.gexplo.2011.08.002, 2012.
Agterberg, F. P.: Multifractal modeling of the sizes and grades of giant and supergiant deposits, Int. Geol. Rev., 37, 1–8, https://doi.org/10.1080/00206819509465388, 1995.
Agterberg, F. P., Cheng, Q., and Wright, D. F.: Fractal modeling of mineral deposits, in: Proceedings of the 24th APCOM Symposium, Montreal, Canada, 43–53, 1993.
Agterberg, F. P., Cheng, Q., Brown, A., and Good, D.: Multifractal modeling of fractures in the Lac du Bonnet batholith, Manitoba, Comput. Geosci., 22, 497–507, 1996.
Bai, J., Porwal, A., Hart, C., Ford, A., and Yu, L.: Mapping geochemical singularity using multifractal analysis: application to anomaly definition on stream sediments data from Funin Sheet, Yunnan, China, J. Geochem. Explor., 104, 1–11, 2010.
Beane, R. E.: Hydrothermal alteration in silicate rocks, in: Advances in Geology of the Porphyry Copper Deposits, Southwestern North America, edited by: Titley, S. R., The University of Arizona Press, Tucson, 117–137, 1982.
Berger, B. R., Ayuso, R. A., Wynn, J. C., and Seal, R. R.: Preliminary Model of Porphyry Copper Deposits, USGS, Open-File Report, 1321 pp., 2008.
Bolviken, B., Stokke, P. R., Feder, J., and Jossang, T.: The fractal nature of geochemical landscapes, J. Geochem. Explor., 43, 91–109, 1992.
Boyce, A. J., Fulgnati, P., Sbrana, A., and Fallick, A. E.: Fluids in early stage hydrothermal alteration of high-sulfidation epithermal systems: a view from the volcano active hydrothermal system (Aeolian Island, Italy), J. Volcanol. Geoth. Res., 166, 76–90, 2007.
Carranza, E. J. M.: Geochemical Anomaly and Mineral Prospectivity Mapping in GIS, Handbook of Exploration and Environmental Geochemistry, 11, Elsevier, Amsterdam, 351 pp., 2008.
Carranza, E. J. M.: Controls on mineral deposit occurrence inferred from analysis of their spatial pattern and spatial association with geological features, Ore Geol. Rev., 35, 383–400, https://doi.org/10.1016/j.oregeorev.2009.01.001, 2009.
Carranza, E. J. M.: From predictive mapping of mineral prospectivity to quantitative estimation of number of undiscovered prospects, Resour. Geol., 61, 30–51, 2010.
Carranza, E. J. M.: Analysis and mapping of geochemical anomalies using logratio-transformed stream sediment data with censored values, J. Geochem. Explor., 110, 167–185, https://doi.org/10.1016/j.gexplo.2011.05.007, 2011.
Carranza, E. J. M., Owusu, E. A., and Hale, M.: Mapping of prospectivity and estimation of number of undiscovered prospects for lode gold, southwestern Ashanti Belt, Ghana, Miner. Deposita, 44, 915–938, https://doi.org/10.1007/s00126-009-0250-6, 2009.
Cheng, Q.: Spatial and scaling modelling for geochemical anomaly separation, J. Geochem. Explor., 65, 175–194, https://doi.org/10.1016/S0375-6742(99)00028-X, 1999.
Cheng, Q.: Multifractal modelling and spectrum analysis: methods and applications to gamma ray spectrometer data from southwestern Nova Scotia, Canada, Sci. China Ser. D, 49, 283–294, 2006.
Cheng, Q.: Mapping singularities with stream sediment geochemical data for prediction of undiscovered mineral deposits in Gejiu, Yunnan Province, China, Ore Geol. Rev., 32, 314–324, https://doi.org/10.1016/j.oregeorev.2006.10.002, 2007.
Cheng, Q., Agterberg, F. P., and Ballantyne, S. B.: The separation of geochemical anomalies from background by fractal methods, J. Geochem. Explor., 51, 109–130, https://doi.org/10.1016/0375-6742(94)90013-2, 1994.
Chilès, J. P. and Delfiner, P.: Geostatistics: Modeling Spatial Uncertainty, Wiley, New York, 695 pp., 1999.
Cox, D. and Singer, D.: Mineral deposits models, US Geological Survey Bulletin, 1693 pp., 1986.
Craig, G. R. and Vaughan, D.: Ore Microscopy and Ore Petrography, John Wiley and Sons, Inc., New York, 434 pp., 1994.
David, M.: Geostatistical Ore Reserve Estimation, Elsevier, Amsterdam, 283 pp., 1970.
Deng, J., Wang, C. M., and Li, G. J.: Style and process of the superimposed mineralization in the Sanjiang Tethys, Acta Petrol. Sin., 28, 1349–1361, 2012 (in Chinese with English abstract).
Deng, J., Wang, Q. F., Li, G. J., and Santosh, M.: Cenozoic tectono-magmatic and metallogenic processes in the Sanjiang region, southwestern China, Earth Sci. Rev., 138, 268–299, https://doi.org/10.1016/j.earscirev.2014.05.015, 2014a.
Deng, J., Wang, Q. F., Li, G. J., Li, C. S., and Wang, C. M.: Tethys tectonic evolution and its bearing on the distribution of important mineral deposits in the Sanjiang region, SW China, Gondwana Res., 26, 419–437, https://doi.org/10.1016/j.gr.2013.08.002, 2014b.
Deng, J., Wang, Q. F., Li, G. J., Hou, Z. Q., Jiang, C. Z., and Danyushevsky, L.: Geology and genesis of the giant Beiya porphyry–skarn gold deposit, northwestern Yangtze Block, China, Ore Geol. Rev., 70, 457–485, https://doi.org/10.1016/j.oregeorev.2015.02.015, 2015.
Faure, K., Matsuhisa, Y., Metsugi, H., Mizota, C., and Hayashi, S.: The Hishikari Au–Ag epithermal deposit, Japan: oxygen and hydrogen isotope evidence in determining the source of paleo hydrothermal fluids, Econ. Geol., 97, 481–498, https://doi.org/10.2113/gsecongeo.97.3.481, 2002.
Goncalves, M. A., Mateus, A., and Oliveira, V.: Geochemical anomaly separation by multifractal modeling, J. Geochem. Explor., 72, 91–114, https://doi.org/10.1016/S0375-6742(01)00156-X, 2001.
Goovaerts, P.: Geostatistics for Natural Resources Evaluation, Oxford University Press, New York, 496 pp., 1997.
Leng, C. B., Zhang, X. C., Hu, R. Z., Wang, S. X., Zhong, H., Wang, W. Q., and Bi, X. W.: Zircon U–Pb and molybdenite Re–Os geochronology and Sr–Nd–Pb–Hf isotopic constraintson the genesis of the Xuejiping porphyry copper deposit in Zhongdian, Northwest Yunnan, China, J. Asian Earth Sci., 60, 31–48, 2012.
Li, C., Xu, Y., and Jiang, X.: The fractal model of mineral deposits, Geol. Zhejiang, 10, 25–32, 1994 (in Chinese with English Abstract).
Li, C., Ma, T., and Shi, J.: Application of a fractal method relating concentrations and distances for separation of geochemical anomalies from background, J. Geochem. Explor., 77, 167–175, https://doi.org/10.1016/S0375-6742(02)00276-5, 2003.
Li, W. C., Zeng, P. S., Hou, Z. Q., and White, N. C.: The Pulang porphyry copper deposit and associated felsic intrusions in Yunnan Province, Southwest China, Econ. Geol., 106, 79–92, https://doi.org/10.2113/econgeo.106.1.79, 2011.
Li, W. C., Yu, H. J., and Yin, G. H.: Porphyry metallogenic system of Geza arc in the Sanjiang region, southwestern China, Acta Petrol. Sin., 29, 1129–1144, 2013 (in Chinese with English abstract).
Liu, X. L., Li, W. C., Yin, G. H., and Zhang, N.: The geochronology, mineralogy and geochemistry study of the Pulang porphyry copper deposits in Geza arc of Yunnan Province, Acta Petrol. Sin., 29, 3049–3064, 2013 (in Chinese with English abstract).
Lowell, J. D.: Geology of the Kalamazoo orebody, San Manuel district, Arizona, Econ. Geol., 63, 645–654, https://doi.org/10.2113/gsecongeo.63.6.645, 1968.
Lowell, J. D. and Guilbert, J. M.: Lateral and vertical alteration-mineralization zoning in porphyry ore deposits, Econ. Geol., 65, 373–408, https://doi.org/10.2113/gsecongeo.65.4.373, 1970.
Mandelbrot, B. B.: The Fractal Geometry of Nature, W. H. Freeman, San Fransisco, 468 pp., 1983.
Mao, J. W., Zhou, Z. H., Feng, C. Y., Wang, Y. T., Zhang, C. Q., Peng, H. J., and Yu, M.: A preliminary study of the Triassic large-scale mineralization in China and its geodynamic setting, Geol. China, 39, 1437–1471, 2012 (in Chinese with English abstract).
Mao, J. W., Pirajno, F., Lehmann, B., Luo, M. C., and Berzina, A.: Distribution of porphyry deposits in the Eurasian continent and their corresponding tectonic settings, J. Asian Earth Sci., 79, 576–584, https://doi.org/10.1016/j.jseaes.2013.09.002, 2014.
Mao, Z., Peng, S., Lai, J., Shao, Y., and Yang, B.: Fractal study of geochemical prospecting data in south area of Fenghuanshan copper deposit, Tongling Anhui, J. Earth Sci. Environ., 26, 11–14, 2004.
Melfos, V., Vavelidis, M., Christodes, G., and Seidel, E.: Origin and evolution of the Tertiary Maronia porphyry copper–molybdenum deposit, Thrace, Greece, Miner. Deposita, 37, 648–668, https://doi.org/10.1007/s00126-002-0277-4, 2002.
Pang, Z. S., Du, Y. S., Wang, G. W., Guo, X., Cao, Y., and Li, Q.: Single-grain zircon U–Pb isotopic ages, geochemistry and its implication of Pulang complex in Yunnan Province, China, Acta Petrol. Sin., 25, 159–165, 2009 (in Chinese with English abstract).
Sadeghi, B., Moarefvand, P., Afzal, P., Yasrebi, A. B., and Saein, L. D.: Application of fractal models to outline mineralized zones in the Zaghia iron ore deposit, Central Iran, J. Geochem. Explor., 122, 9–19, https://doi.org/10.1016/j.gexplo.2012.04.011, 2012.
Sanderson, D. J., Roberts, S., and Gumiel, P.: A fractal relationship between vein thickness and gold grade in drill core from La Codosera, Spain. Econ. Geol., 89, 168–173, 1994.
Schwartz, G. M.: Hydrothermal alteration in the “porphyry copper” deposits, Econ. Geol., 42, 319–352, https://doi.org/10.2113/gsecongeo.42.4.319, 1947.
Shi, J. and Wang, C.: Fractal analysis of gold deposits in China: implication for giant deposit exploration, Earth Sci. J. China Univ. Geosci., 23, 616–618, 1998 (in Chinese with English abstract).
Sillitoe, R. H.: Characteristics and controls of the largest porphyry copper–gold and epithermal gold deposits in the circum-pacific region, Aust. J. Earth Sci., 44, 373–388, https://doi.org/10.1080/08120099708728318, 1997.
Sillitoe, R. H. and Gappe, I. M.: Philippine porphyry copper deposits: geologic setting and characteristics, Common Coordination Joint Resource (CCOP), 14, 1–89, 1984.
Sim, B. L., Agterberg, F. P., and Beaudry, C.: Determining the cutoff between background and relative base metal contamination levels using multifractal methods, Comput. Geosci., 25, 1023–1041, 1999.
Soltani, F., Afzal, P., and Asghari, O.: Delineation of alteration zones based on Sequential Gaussian Simulation and concentration–volume fractal modeling in the hypogene zone of Sungun copper deposit, NW Iran, J. Geochem. Explor., 140, 64–76, https://doi.org/10.1016/j.gexplo.2014.02.007, 2014.
Spalla, M. I., Morotta, A. M., and Gosso, G.: Advances in interpretation of geological processes: refinement of multi-scale data and integration in numerical modelling, Geolog. Soc., London, 240 pp., 2010.
Sun, T. and Liu, L.: Delineating the complexity of Cu-Mo mineralization in a porphyry intrusion by computational and fractal modeling: A case study of the Chehugou deposit in the Chifeng district, Inner Mongolia, China, J. Geochem. Explor., 144, 128–143, https://doi.org/10.1016/j.gexplo.2014.02.015, 2014.
Turcotte, D. L.: A fractal approach to the relationship between ore grade and tonnage, Econ. Geol., 18, 1525–1532, 1986.
Turcotte, D. L.: Fractals in geology and geophysics, Pure Appl. Geophys., 131, 171–196, 1989.
Turcotte, D. L.: Fractals and Chaos in Geophysics, second edn., 81–99, Cambridge University Press, Cambridge UK, 1996.
Wang, G. W., Carranza, E. J. M., Zuo, R., Hao, Y. L., Du, Y. S., Pang, Z. S., and Sun, Y.: Mapping of district-scale potential targets using fractal models, J. Geochem. Explor., 122, 34–46, https://doi.org/10.1016/j.gexplo.2012.06.013, 2012.
Wang, Q. F., Deng, J., Liu, H., Wang, Y., Sun, X., and Wan, L.: Fractal models for estimating local reserves with different mineralization qualities and spatial variations, J. Geochem. Explor., 108, 196–208, https://doi.org/10.1016/j.gexplo.2011.02.008, 2011.
Wang, Q. F., Deng, J., Li, C. S., Li, G. J., Yu, L., and Qiao, L.: The boundary between the Simao and Yangtze blocks and their locations in Gondwana and Rodinia: constraints from detrital and inherited zircons, Gondwana Res., 26, 438–448, https://doi.org/10.1016/j.gr.2013.10.002, 2014.
White, N. C. and Hedenquist, J. W.: Epithermal gold deposits: styles, characteristics and exploration, SEG Newsletter, 23, 1–14, 1995.
Wilson, A. J., Cooke, D. R., Harper, B. J., and Deyell, C. L.: Sulfur isotopic zonation in the Cadia district, southeastern Australia: exploration significance and implications for the genesis of alkalic porphyry gold–copper deposits, Miner. Deposita, 42, 465–487, https://doi.org/10.1007/s00126-006-0071-9, 2007.
Yamamoto, J. K.: Comparing Ordinary Kriging Interpolation Variance and Indicator Kriging Conditional Variance for Assessing Uncertainties at Unsampled Locations, in: Application of Computers and Operations Research in the Mineral Industry, edited by: Dessureault, S., Ganguli, R., Kecojevic, V., and Girard-Dwyer, J., Balkema, 2005.
Yunnan Diqing Nonferrous Metal Co. Ltd.: Exploration Report of Pulang Copper Deposit, Diqing, Yunnan, China, Yunnan Diqing Nonferrous Metal Co. Ltd., Diqing Tibetan Autonomous Prefecture, 2009 (in Chinese).
Zeng, P. S., Hou, Z. Q., Li, L. H., Qu, W. J., Wang, H. P., Li, W. C., Meng, Y. F., and Yang, Z. S.: Age of the Pulang porphyry copper deposit in NW Yunnan and its geological significance, Geological Bulletin of China, 23, 1127–1131, 2004 (in Chinese with English abstract).
Zuo, R. and Wang, J.: Fractal/multifractal modeling of geochemical data: A review, J. Geochem. Explor., 164, 33–41, https://doi.org/10.1016/j.gexplo.2015.04.010, 2016.
Zuo, R., Cheng, Q., and Xia, Q.: Application of fractal models to characterization of vertical distribution of geochemical element concentration, J. Geochem. Explor., 102, 37–43, https://doi.org/10.1016/j.gexplo.2008.11.020, 2009.
- Abstract
- Introduction
- Fractal models
- Geological setting of the Pulang porphyry copper deposit
- Fractal modeling
- Comparison of the fractal models and geological model of the deposit
- Conclusions
- Data availability
- Author contributions
- Competing interests
- Acknowledgements
- Financial support
- Review statement
- References