the Creative Commons Attribution 4.0 License.
the Creative Commons Attribution 4.0 License.
 | 06 Jan 2026
Exploring urban heat islands with a simple thermodynamic model
Mijeong Jeon
Kyeongjoo Park
Woosok Moon
Jae-Jin Kim
Jong-Jin Baik
The urban heat island (UHI), where urban areas experience higher near-surface temperatures than surrounding rural areas, has long been recognized as a serious issue in urban climatology due to global warming and rapid urbanization. This study investigates the key mechanisms of the UHI through a simple theoretical thermodynamic model. Using a simple day-night model based on the surface energy balance (SEB), we demonstrate that the UHI primarily results from two mechanisms: reduced diurnal temperature range (DTR) due to larger heat capacity of urban materials and increased mean temperature due to lower urban albedo. These mechanisms explain why the UHI intensity is stronger at night than during the day. The UHI intensity obtained from the theoretical model shows a qualitatively similar diurnal variation to that found in observations, supporting the applicability of the theoretical model for understanding the UHI. An analysis of temporal dynamics of UHIs in a megacity (Seoul) and a major city (Suwon) in South Korea shows that the long-term changes in the UHI in both cities are significantly correlated with those in the urban-rural difference in DTR, highlighting the role of urban heat storage in the UHI. In particular, this study emphasizes that well-known UHI mechanisms can be explained in a simple and intuitive manner through a time-integrated theoretical framework, underscoring the academic value of simplified models in interpreting complex urban climate processes. Moreover, this approach demonstrates broader applicability beyond UHI research, suggesting that such models can serve as practical tools in diverse climatic and environmental contexts.
- Article
(3870 KB) - Full-text XML
- BibTeX
- EndNote


Urban areas have higher near-surface temperatures than nearby rural areas (Luber and McGeehin, 2008; Zhao et al., 2014; Chapman et al., 2017). This phenomenon, called the urban heat island (UHI), has become a serious issue in urban environments, especially with global warming. Global urbanization is expected to continue over the next 30 years, the percentage of urban population being projected to increase from 56 % in 2021 to 68 % by 2050 (UN-Habitat, 2022). Due to the rapid urbanization, the UHI will likely become more severe, making it an issue that cannot be ignored.
There are many different causes of the UHI. One of the main causes is that impervious materials like asphalt and concrete, used for roads and buildings, absorb and store more heat during the day and release it at night, which raises the temperature more than nearby rural areas (Wanphen and Nagano, 2009; Ryu and Baik, 2012; Santamouris, 2015; Mohajerani et al., 2017). In addition to this material property, the relatively large thermal inertia of urban areas, arising from inefficient longwave cooling and the increased surface area due to buildings, further amplifies the UHI (Oke, 1982; Varquez and Kanda, 2018; Li et al., 2024). Moreover, the evapotranspiration in urban areas is less than that in rural areas due to limited green spaces and water bodies (Gunawardena et al., 2017; Qiu et al., 2017). This plays a major role in accelerating heat accumulation (Oke, 1982). Moreover, anthropogenic heat resulting from vehicles, industrial activities, and building heating and cooling systems, increases the temperature difference between cities and surrounding areas (Taha, 1997; Grimmond, 2007; Wen and Lian, 2009; Sailor, 2011; Wang et al., 2023). Air pollutants also contribute to heat accumulation (Grimm et al., 2008; Zhao et al., 2014; Cao et al., 2016; Han et al., 2020), and tall and densely packed buildings block airflow, further intensifying the UHI (Memon et al., 2008; Rajagopalan et al., 2014; Yuan et al., 2020).
The primary causes of the UHI vary depending on climatic and environmental factors. For example, in regions with hot and dry climates, the lack of evaporative cooling due to low evapotranspiration leads to the development of the UHI (Corumluoglu and Asri, 2015). In humid regions, water vapor in the atmosphere suppresses radiative cooling and slows down the release of heat into the air. In regions with low wind speeds, the stagnation of airflow causes heat to accumulate (Rajagopalan et al., 2014; Mohammed et al., 2020; Al-Obaidi et al., 2021).
Although the UHI intensity differs depending on climatic and environmental factors, there is a common feature: in most regions, the UHI intensity is stronger at night than during the day (Goward, 1981; Stanhill and Kalma, 1995; Fujibe, 1997; Montávez et al., 2000; Runnalls and Oke, 2000; Christen and Vogt, 2004; Nichol et al., 2009; Lee and Baik, 2010; Elagib, 2011; Pal et al., 2012; Berwal et al., 2016; Parker, 2021). In several regions where the UHI is stronger during the day than at night (Ferreira et al., 2013; Borbora and Das, 2014; Mathew et al., 2018), monsoon seasons or frequent heavy rainfall events which bring abundant atmospheric moisture typically appear. In addition to the general feature that the UHI tends to be stronger at night, another universal cause of the UHI across regions is that impervious urban materials increase heat storage. These urban materials accumulate more heat during the day and release it at night, which contributes to the stronger UHI at night (Grimmond and Oke, 1999; Li et al., 2024). This heat storage is a well-established key process in explaining the mechanisms of the UHI and plays a crucial role in understanding the temporal characteristics.
To explain the main mechanisms of the UHI, many previous studies have used the SEB framework to understand the UHI. Mitchell (1961) first emphasized that the heat capacity of urban materials is a primary factor of the UHI, laying the theoretical foundation for quantitative modeling. Myrup (1969) developed the first one-dimensional numerical model based on the SEB; however, this simple model did not reproduce the typical observation that nighttime UHI intensity exceeds daytime UHI. Oke (1982) subsequently provided a comprehensive mathematical explanation for this nighttime phenomenon and established the energetic basis of the UHI, and the concept of the urban SEB was well established (Oke, 1988).
Building on this foundation, Grimmond and Oke (1999) conducted the first quantitative SEB analysis of urban heat storage and developed the Objective Hysteresis Model (OHM) to parameterize heat storage flux in urban climate models. Sailor (1995) used three-dimensional meteorological simulations to quantify the effects of surface albedo changes, showing that an increase in albedo leads to a decrease in air temperature. Adachi et al. (2016) demonstrated that incorporating high-resolution sea surface temperature and urban morphology data into regional climate models significantly improves the estimation of surface air temperature, highlighting the importance of detailed SEB parameterization in urban environments. Theeuwes et al. (2017) derived a diagnostic SEB equation for maximum UHI intensity through dimensional analysis and validated it across several European cities. More recently, based on global climate model simulations and SEB theory, Li et al. (2024) revealed that urban areas exhibit stronger temperature persistence compared with rural areas due to impervious materials with large thermal inertia. Together, these studies have deepened the quantitative understanding of UHI mechanisms – such as heat capacity, heat storage, albedo, and thermal inertia – through both numerical modeling and empirical analyses.
The UHI has mainly been explained by focusing on the differences in flux components of the SEB between urban and rural areas. However, while the differences in the magnitude of the SEB terms such as incoming longwave radiation, sensible heat flux, and anthropogenic heat flux between urban and rural areas tend to peak during the day (Oke, 1982, 1988; Li et al., 2015), the UHI is stronger at night. This suggests that the analysis of the SEB based solely on the urban-rural differences in flux terms is insufficient to explain how heat accumulated during the day affects temperatures at night. To address this, it is necessary to analyze the impacts of the SEB on the temporal evolution of temperature by integrating the SEB equation over time, thereby capturing the cumulative effects of fluxes on temperature changes. This time-integrated approach offers a new perspective that has not been explicitly addressed in previous studies and serves as the starting point of the present study. Through this approach, we aim to revisit the well-established mechanisms of the UHI from a time-integrated perspective.
Integrating the SEB over time to construct the relationship between the temperature and the heat fluxes is challenging due to the complexity of the SEB. A simplified version of the SEB should be introduced to represent the effect of the heat storage on the temperature. We introduce a day-night model, a simple theoretical thermodynamic model, based on the two-season model introduced by Thorndike (1992) and Moon and Wettlaufer (2012). The two-season model is a simplified model that divides the year into winter and summer to study the seasonal variability of Arctic sea ice. In Thorndike (1992), the two-season model was first introduced to show the existence of bifurcation in sea ice thermodynamics under global warming. This model was useful for intuitively understanding the dynamics of sea ice growth in relation to atmospheric radiation and climatic forcing. The follow-up study by Moon and Wettlaufer (2012) further investigated why sea ice stabilizes and does not bifurcate when it disappears during the summer, something that Thorndike (1992) could not explain. Although the two-season model used in both studies is a crude approximation, it effectively represents the main seasonal cycle of sea ice. This is because the representative characteristics found in a complex model can also be extracted using a simpler model. In the Arctic, the summer experiences continuous daylight (polar day) and the winter continuous night (polar night), creating a large cycle based on the presence or absence of solar radiation. This is very similar to the daily cycle, where solar radiation is present during the day and absent at night. Therefore, we expected that by introducing such a simple structure, the mechanism of the UHI could be easily found.
This study employs a day-night model that divides a day into daytime and nighttime, assuming a constant solar energy input of S0 during the day and no solar energy input at night. This approach simplifies the complex SEB integration process, allowing for constructing analytic solutions for the daily cycle and diurnal temperature range (DTR) and clearly illustrating how heat accumulation during the day and heat release at night affect the UHI. A control case is then assumed to represent rural conditions. Subsequently, the effects of the larger heat capacity of urban materials and the lower urban albedo are incorporated into the model to analyze the UHI. Through this simple and intuitive framework, the well-established mechanisms of the UHI can be demonstrated, and the broader applicability of the approach can be considered.
In addition, we utilize observational data in a megacity (Seoul) and a major city (Suwon) in South Korea to compare the diurnal variation of the UHI intensity obtained from the theoretical model with that observed in reality. Furthermore, we analyze long-term observational records to examine how UHI intensity evolves differently depending on the stage of urbanization. Through this, we demonstrate that the time-integrated SEB perspective provides a new lens that extends beyond short-term mechanisms to the interpretation of long-term UHI variations.
In Sect. 2, we present a simple theoretical thermodynamic model to investigate the mechanisms of the UHI. Section 3 explains methods for obtaining the analytical solutions of the theoretical model and provides details on the observational data used in this study. Section 4 presents the analysis results which include the key mechanisms of the UHI found from the theoretical model and how the UHI intensities in the two cities have evolved with urbanization. Finally, Sect. 5 concludes the present study with a summary of the findings and a discussion of the study's limitations.
The SEB explains the exchange of energy between the Earth's surface and the atmosphere in a specific region. If the surface energy fluxes are not in balance, the surface temperature changes. Here, the surface temperature means the temperature of a thin layer including surface and subsurface. Different SEB characteristics and surface temperature between urban and rural areas make weather and climate in urban areas distinct from those in rural areas, resulting in the UHI.
For a thin layer including surface and subsurface, the SEB equation is given by:
where C is the heat capacity of the unit surface area of the layer, Ts is the surface temperature, S(t) is the incoming shortwave radiation, α is the surface albedo, Ln is the net longwave radiation, H is the sensible heat flux, LE is the latent heat flux, and G is the ground heat flux (Zeng et al., 2017; Manoli et al., 2019).
The first term on the right-hand side S(t)(1−α) represents the net shortwave radiation at the surface. Urbanization tends to decrease α due to darker surfaces, reduced snow cover in winter, and surface geometry where buildings lead to multiple reflections of incoming shortwave radiation and increase heat storage capacity (Taha, 1997; Lamptey et al., 2005; Yang and Li, 2015). The value of α varies depending on local characteristics. Urban areas generally have lower α compared with rural areas (Oke, 1988; Liu and Wang, 2007; Sugawara and Takamura, 2014), indicating that the net shortwave radiation is generally greater in urban areas compared with rural areas.
The second term Ln consists of downward longwave radiation from the atmosphere to the surface and upward longwave radiation from the surface to the atmosphere . Thus, Ln can be written as:
where ϵa and ϵs are the emissivities of the atmosphere and surface, respectively, σ is the Stefan-Boltzmann constant, and Ta is the near-surface air temperature.
The sensible heat flux H is given by where ρ is the mean air density, cp is the specific heat of dry air at constant pressure, and ra is the aerodynamic resistance (Zhao et al., 2014). It represents the transfer of heat between the surface and the atmosphere due to the temperature difference between them. The latent heat flux LE is expressed as where λ is the latent heat of vaporization, β is the water stress factor, gc is the fraction of vegetated area, qsat,s=qsat(Ts) is the specific humidity at saturation, qa is the specific humidity of air, and rc is the vegetation canopy resistance (Manoli et al., 2019). It represents the transfer of latent heat between the surface and the atmosphere by evapotranspiration and condensation. G is the ground heat flux between the layer and a subsurface layer below and can be simply expressed as where k is the thermal conductivity, Tg is the temperature of the subsurface layer below, and Δz is the length between the mid-points of the two layers.
Then, the SEB equation can be expressed as:
Assuming that the net longwave radiation, sensible heat flux, latent heat flux and ground heat flux are functions of Ts and letting simplify the equation to:
To understand the mechanisms of the UHI in terms of the SEB, we make the assumption that where c is a constant. This approach considers that the near-surface (canopy layer) air temperature is primarily driven by the surface temperature. However, this simplification has the following limitation. According to actual observations, while the canopy layer UHI is prominent at night, the surface UHI tends to be stronger during the day (Chakraborty and Lee, 2019; Stewart et al., 2021), making it difficult to assume that Ta and Ts fluctuate in the same manner. Although temperature change mechanisms can be different between daytime and nighttime and between the canopy layer and the surface, under the primary objective of understanding the UHI mechanisms in terms of the SEB holistically, this study utilizes the simplicity and ease of interpretation provided by the assumption. This makes the model structure simple, the model remaining sufficiently useful for evaluating the quantitative impacts of key factors (e.g., heat capacity, albedo).
Now, we introduce a day-night model that divides a day into daytime and nighttime with the same duration (12 h) and assumes a constant solar radiation of S0 during daytime and a constant solar radiation of 0 during nighttime . This model is designed to simplify the analysis of energy flux variations over a diurnal cycle focusing on capturing differences in incoming shortwave radiation between daytime and nighttime. In other words, this model aims to eliminate complex variabilities and clearly identify essential characteristics of heat accumulation and release processes. This makes it possible to analytically derive the diurnal variation of the UHI.
The introduction of the day-night model is inspired by the two-season model in the field of sea ice by Thorndike (1992) and Moon and Wettlaufer (2012). The two-season model divides the year into two seasons, summer and winter, characterized by two distinct constant values of shortwave radiance. Even with the crude simplification of the seasonal cycle of shortwave radiance, the periodic solutions contain major features of the seasonal cycle of sea ice thickness. Based on the two-season model, Thorndike (1992) revealed the existence of a tipping point in sea ice under global warming. Moon and Wettlaufer (2012) extended the model to show a new feature of sea ice stability in summer. Despite its simplicity, this model has the advantage of being able to easily extract representative characteristics of the seasonal cycle of sea ice. In this model, total period is divided into two distinct periods (summer and winter in the two-season model and daytime and nighttime in the day-night model) and representative values for each period are used, a periodic non-autonomous system being transformed into two autonomous system. The seasonal cycle in the Arctic, with its midnight sun and polar night, is very similar to the daily cycle of day and night. Therefore, it is expected that the day-night model can simply extract representative characteristics of the daily cycle of the UHI. The day-night model can be represented as follows:
where t=1 corresponds to 24 h and the average solar radiation becomes .
The simple model proposed in this study is expected to effectively capture key physical mechanisms while explaining the UHI in a simplified manner. In particular, this approach is useful for intuitively identifying the effects of specific factors; as in this study, where solar radiation was simplified, other factors can also be simplified in different contexts to clearly assess their influence. This model has the potential to serve as a useful tool for understanding the UHI and analyzing characteristics of the UHI under various urban and climatic conditions, as well as for exploring broader environmental and climate mechanisms.
3.1 Theoretical modeling
In this subsection, the solution of the theoretical model introduced in Sect. 2 is derived. In Eq. (4), Ts is divided into (average) and ηs (deviation) and S is divided into (average) and s(t) (deviation). Since and are time-independent, and satisfy the following:
Here, . Considering that the scale of is around 300 K which is much larger than that of ηs around 10 K, it is possible to apply the Taylor expansion around to the Eq. (4), which results in:
where or . Then, we can rearrange Eq. (4) as:
Using Eq. (6):
where
and
The sensitivity of the temperature-dependent SEB terms is represented by λ. Here, the sensitivity refers to how these terms respond to small changes in , which in turn indicates the overall stability of the system. The system stability refers to the ability to return to the original state, which in the context of climate systems means how resilient the system is in response to changing external conditions.
The time-dependent thermal forcing, represented by the daily cycle of the deviation of incoming shortwave radiation, is included in χ(t). The integration of the Eq. (9) over time leads to:
The solution is mainly controlled by the stability λ. For a bounded solution, it is required that λ>0. If not, ηs increases exponentially and Ts is unstable to a small perturbation. When λ>0, represents a response time-scale of the SEB which can be interpreted as a memory of the system. When the memory is longer, the solar radiation received from sunrise to sunset accumulates for a longer period, allowing the effects of the day to persist into the night. By placing e−λt on the right-hand side of Eq. (12) inside the integral, ηs(t) can be expressed as . Let's consider an example where the current time is 20:00 LT, the sun rises at 06:00 LT, and it set at 18:00 LT. We examine the accumulation process from 06:00 to 20:00 LT. Between 06:00 and 20:00 LT, the forcing of solar radiation, denoted as χ(t′), is applied at each moment. This χ(t′) accumulates in proportion to . The impacts of χ(t′) at 06:00 LT and at 18:00 on 20:00 LT are and , respectively. Normally, the effect of 18:00 LT is greater than that of 06:00 LT. The larger λ is, the smaller the impact, so the effect near sunrise almost disappears with a larger λ, leaving only the influence near sunset. This corresponds to rural areas that quickly respond to changes in solar radiation. However, the smaller λ is, the greater the impact, meaning that the effect during the day can persist longer even after sunset. This implies that solar radiation does not easily escape, which corresponds to urban areas. Here, λ is inversely proportional to heat capacity C. As the heat capacity C increases due to urban materials in cities, λ decreases, leading to an extended memory and the appearance of an accumulation effect.
From past to present, as t becomes sufficiently large, the influence of the initial conditions diminishes and the integral converges to a periodic steady state. Considering that ηs is a periodic function, time can be expressed as . Here, n represents the number of complete cycles (days) and refers to the time within the current cycle. Therefore,
The integrals in Eq. (13) are elaborated as:
and
The detailed process can be referenced in Moon and Wettlaufer (2013). And the expression for is represented by:
The minimum value of ηs occurs at t=0, and the maximum value is observed at , thus and . Therefore, the DTR, defined as ηs,max−ηs,min, is , implying that the DTR is determined by a nonlinear relationship among the energy absorbed in the surface, the sensitivity of the energy flux balance terms, and the heat capacity of the surface. The tanh x function representing the nonlinear relationship has two limiting behaviors. Near the origin, it can be approximated as y=x, while it converges to y=1 when x is large enough.
Let's first consider the case when λ is sufficiently large. In this case, , so the DTR where can be expressed as:
This is obtained by the balance between the negative feedback −ληs and the thermal forcing . The heat reservoir effect measured by the heat capacity C is negligible, thus the deficit or surplus of heat from the SEB is compensated or consumed by the strong negative feedback immediately. Considering various daily cycles of surface temperature in cities, this limit seems to be unrealistic.
Conversely, when is appropriately small, the function resembles the function. Therefore, the DTR can be expressed as:
In this limit, the negative feedback is much smaller than the heat reservoir term. Thus, some of the incoming shortwave radiation is stored during the day and the stored heat is released to the atmosphere at night, which becomes the major process affecting the DTR. Hence, the DTR is associated with how much heat is stored by materials at the surface. Therefore, as the heat capacity C increases (decreases), the DTR decreases (increases). Similarly, as the albedo α increases (decreases), the DTR decreases (increases). The higher heat capacity in urban areas acts to decrease the DTR, while the lower albedo contributes to increasing the DTR. The contrasting effects of these two factors are quantitatively examined in Sect. 4.1 through an analysis of their relative contributions.
3.2 Observational analysis
To compare the diurnal variation of the UHI intensity obtained from the theoretical model and that found in observations and analyze changes in UHI intensity with urbanization, the UHI intensities in Seoul and Suwon, South Korea, are calculated. The Korea Meteorological Administration operates 103 weather observation stations equipped with Automated Synoptic Observing Systems (ASOS) to measure 16 meteorological elements including temperature, wind, relative humidity, and solar radiation (Korea Meteorological Administration, 2025). These observations began in 1904, with variations in the measurement period and elements recorded by each station. Since 1972, the majority of stations have consistently collected data. The data are collected at intervals ranging from 4 to 1 h, with more recent observations tending towards 1 h resolutions. The locations of the 56 weather stations that have continuously collected data from 1972 to the present are shown in Fig. 1.
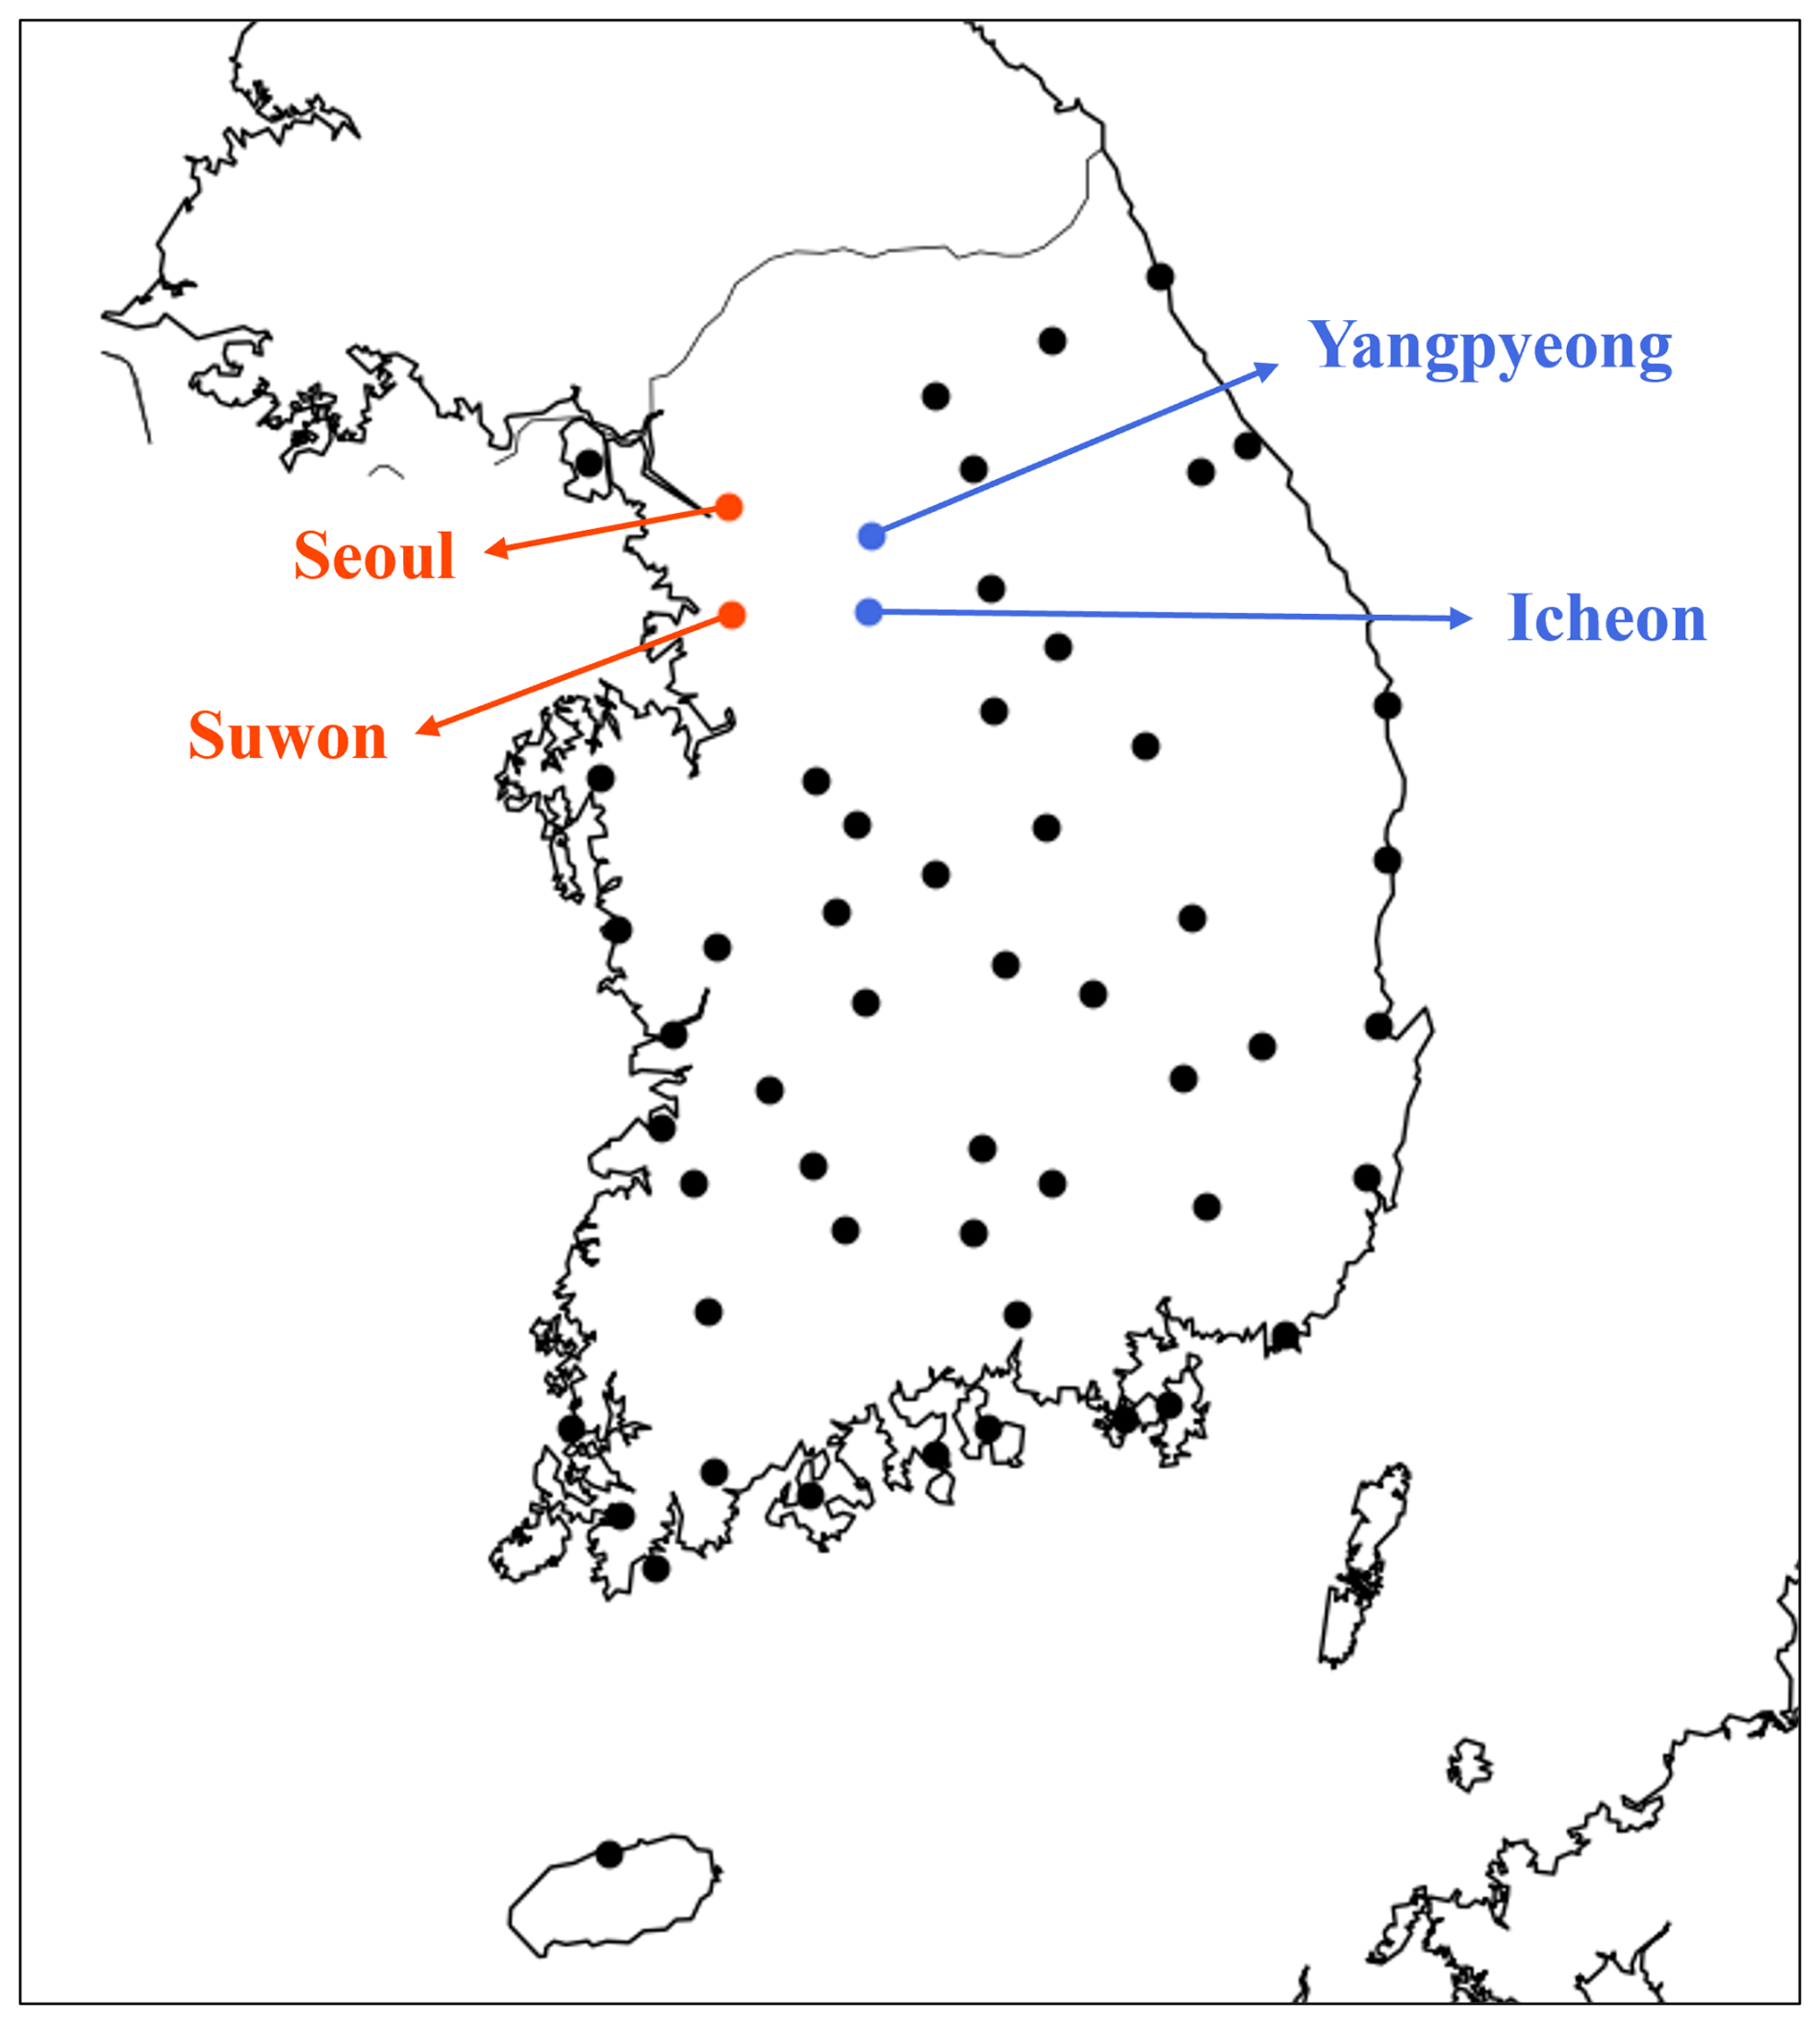
Figure 1Locations of 56 Automated Synoptic Observing Systems (ASOSs) used in this study. The urban (Seoul and Suwon) stations and rural (Yangpyeong and Icheon) stations used for analysis of the UHI are indicated by orange and blue dots, respectively. Map lines delineate study areas and do not necessarily depict accepted national boundaries.
Prior to data analysis, data preprocessing is conducted to fill missing data up. For short-term missing data occurring at intervals of several hours, such as 4 h interval data from early observations, cubic spline interpolation is used to convert to hourly data. Different methods are used for longer-term missing data. For example, Seoul, the capital of South Korea, has been under observation since 1908. However, there is a missing period from November 1950 to November 1951 due to the Korean War. This is replaced with the average values from the corresponding dates in 1949 and 1952. In this study, the analysis is conducted after applying these preprocessing steps to all weather stations.
The UHI intensity in Seoul is calculated as the difference in near-surface air temperature between the Seoul and Yangpyeong stations (Kim and Baik, 2004), and the UHI intensity in Suwon is calculated as that between the Suwon and Icheon stations. As shown in Fig. 2, the urban stations are mainly surrounded by built-up areas while the rural stations are mainly surrounded by vegetation and relatively sparsely built-up areas. The distance between the Seoul and Yangpyeong (Suwon and Icheon) stations is 47.5 (44.4) km, and the difference in elevation between them is 38.4 (−40.3) m.
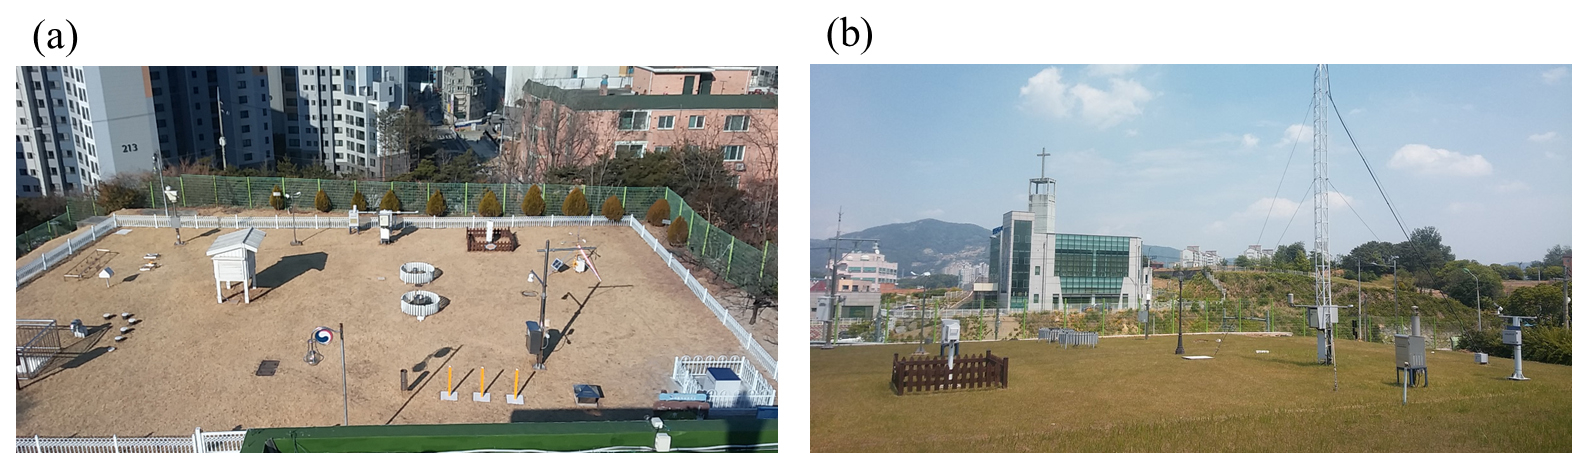
Figure 2Two observation sites in (a) an urban area (Seoul) and (b) a rural area (Yangpyeong). Photographs provided by the Korea Meteorological Administration, Seoul Regional Office of Meteorology.
Before analyzing UHI variations, it is important to note the climatic characteristics of South Korea, as background climate strongly influences UHI intensity. South Korea is located in the mid-latitudes of the Northern Hemisphere, with an annual average temperature of around 13 °C and a DTR of approximately 8 °C (Fig. 3). In South Korea, distinct seasonal characteristics and large temperature variations appear in a year, with hot and humid summers, cold and dry winters, and mild temperatures in spring and autumn. The territory encompasses diverse topography including mountainous regions, coastal areas, and plains. Coastal regions experience relatively smaller temperature fluctuations due to the influence of maritime climate.
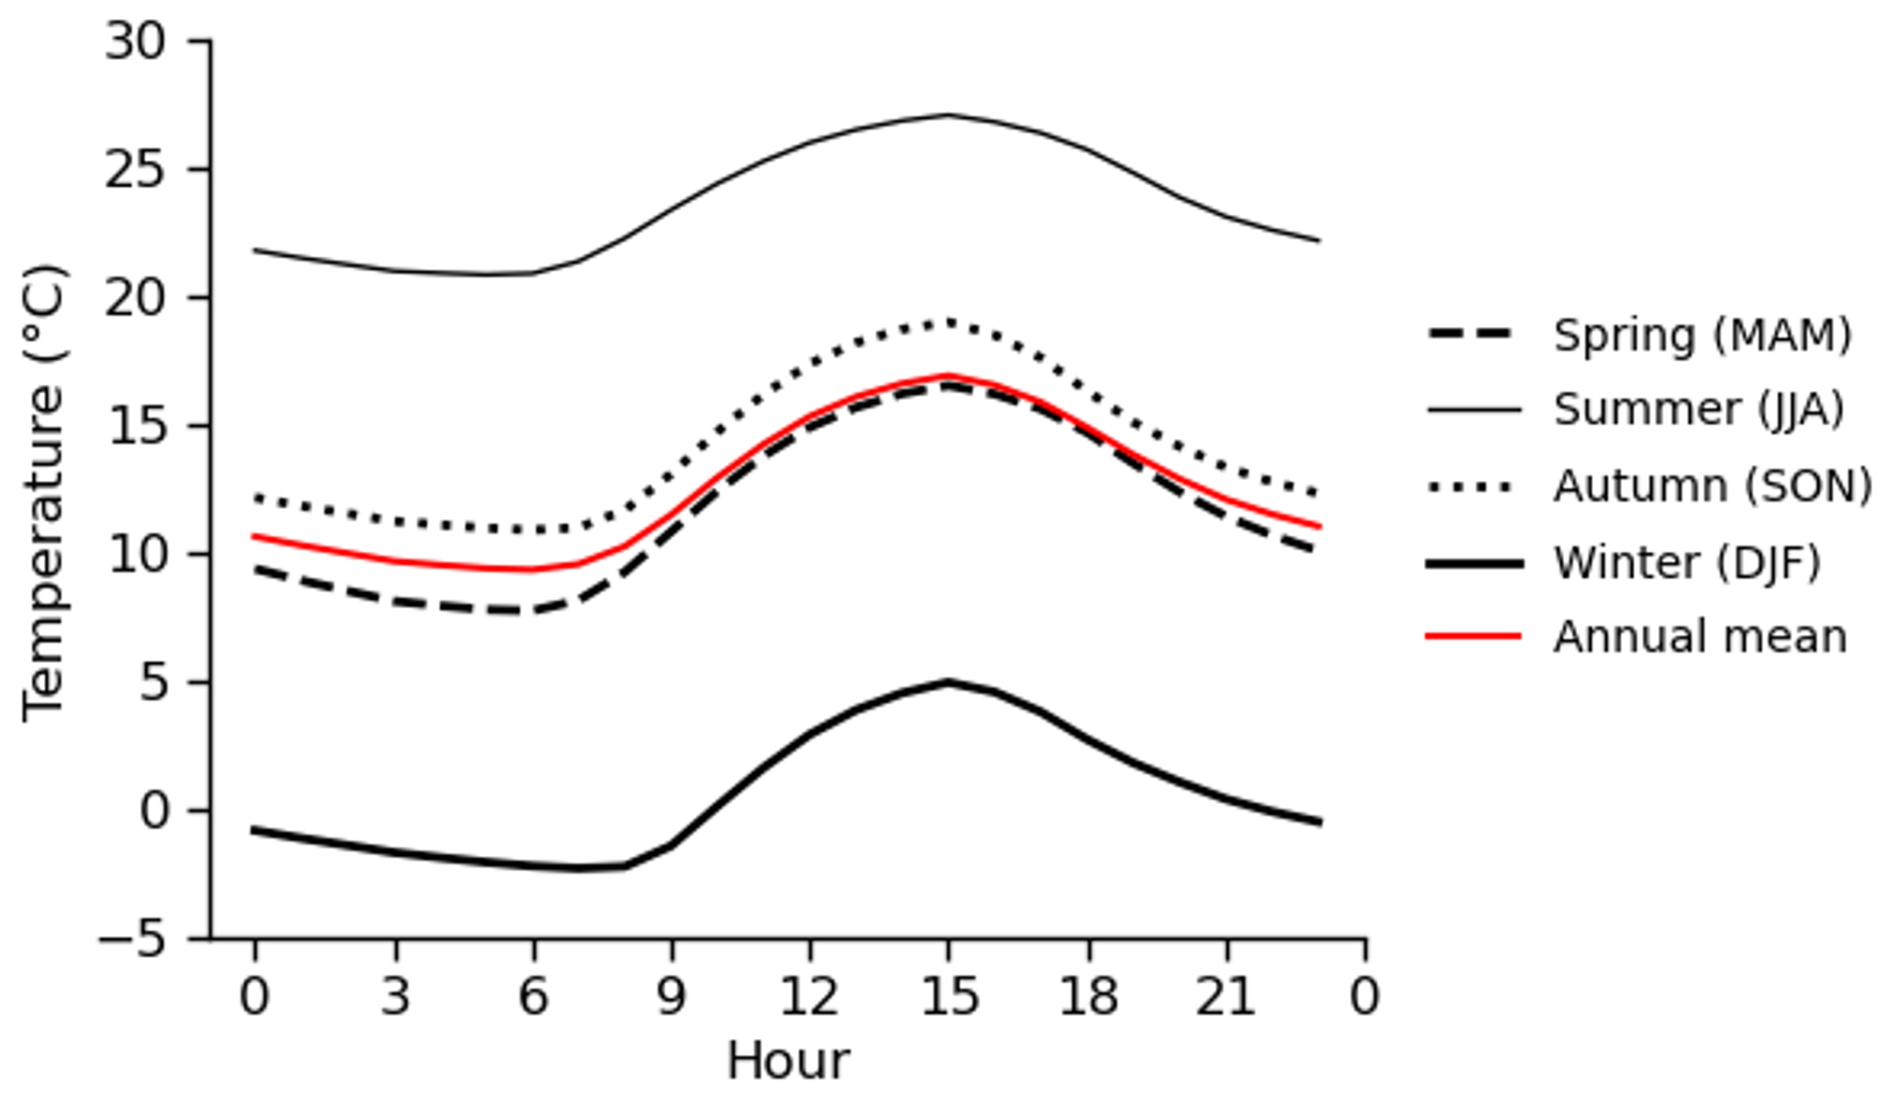
Figure 3Diurnal variation of near-surface air temperature for each season (black) and the annual mean (red), averaged over 51 years (1972–2022) and 56 stations.
Since the 1970s, South Korea has undergone explosive urbanization and industrialization due to economic development. Among these changes, Seoul, which currently houses approximately 18.3 % of the country's total population, has emerged as a center of development while experiencing particularly rapid urbanization. In Seoul's case, a sharp rise in temperature could be observed during the rapid development period of the 1980s (Fig. 4), indicating that urbanization has a significant impact on the long-term increasing trend of temperature.
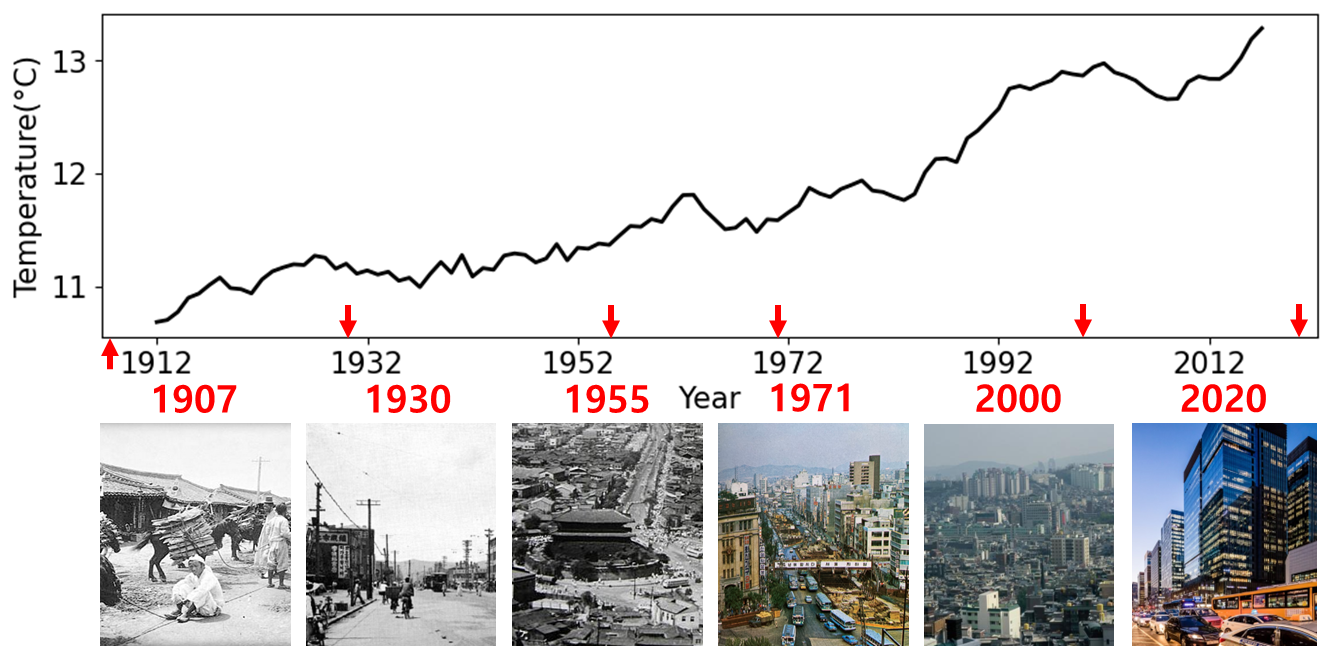
Figure 4Long-term changes in annual average near-surface air temperature in Seoul. The images below show adjacent areas to Seoul weather station in 1907, 1930, 1955, 1971, 2000, and 2020. Photographs for 2000 and 2020 are reproduced with permission from Seoul 2000, 2020 Urban Form and Landscape, Seoul Metropolitan Government. Photographs from 1907, 1930, and 1955 are in the public domain under Korean copyright law (published before 1977).
4.1 Mechanisms of the UHI
To explore the mechanisms of the UHI using the theoretical model, the diurnal variations of urban and rural near-surface air temperatures are examined. For calculations with the theoretical model, the values of key input parameters including λ, c, S0, C, α, and ϵs need to be specified. λ is dependent on , which represents the background state. To obtain representative values of for typical urban and rural areas, a two-dimensional idealized numerical simulation is performed using the Weather Research and Forecasting (WRF) model (Skamarock et al., 2019) coupled with the Seoul National University Urban Canopy Model (SNUUCM) (Ryu et al., 2011). The simulation setup is the same as that adopted in Park et al. (2024) except that the simulation period is 00:00 LST 19 March–00:00 LST 21 March (24 h spin-up period) and the initial surface potential temperature is set to 288.15 K. An urban area is surrounded by cropland/woodland rural areas under flat terrains and mid-latitude spring clear-sky conditions. From this numerical simulation, the values of obtained for the urban and rural areas are 11.8 and 30.9 , respectively. These values may exhibit diurnal variation. However, such variations have little influence on the results at the main timescale considered in this simplified model, and their overall order of magnitude remains similar. The values for the urban area remain smaller than those for the rural area, indicating slower radiative cooling and thermal adjustment. Therefore, the daily mean values are used as representative values in this study. c is set to 6.5 K for both urban and rural areas, which is the mean value of the difference between surface and air temperatures in the simulation. S0 is set to 900 W m−2 and ϵs is set to 0.95 for both urban and rural areas. Here, S0 is used as a representative forcing scale and is chosen to be of the order of the clear-sky solar radiation at local noon. To consider the effects of larger urban heat capacity and lower urban albedo on the UHI, C and α are set to 21 (14) and 0.15 (0.16) for the urban (rural) area in the calculations, respectively. The values of emissivity and albedo considered are within the typical ranges founded for urban and natural surface materials (Oke et al., 2017). We first conduct calculations where is set to 30.9 for both urban and rural areas to isolate the effects of C and α. Next, to account for the background state differences between urban and rural areas, we additionally conduct calculations where is set to 11.8 (30.9) for urban (rural) areas. In the first case, the value of λ used in the theoretical model is 1.5 (2.2) s−1 for urban (rural) areas, while in the second case, it is 0.6 (2.2) s−1. This implies that in both cases, the system stability of urban areas is lower than that of rural areas.
Now, let us compare the effects of heat capacity and albedo on DTR and examine how each factor influences the UHI. In the first case, where the background state is assumed to be the same, varying only C (Fig. 5a) keeps the average temperature similar between urban and rural areas, but the DTR in urban areas is smaller by 3.67 °C compared to rural areas. When only α is varied (Fig. 5b), the DTR in urban and rural areas remains nearly the same, while the average temperature in urban areas increases by 0.86 °C. Thus, varying both C and α (Fig. 5c) leads to a decrease in DTR and an increase in average temperature.
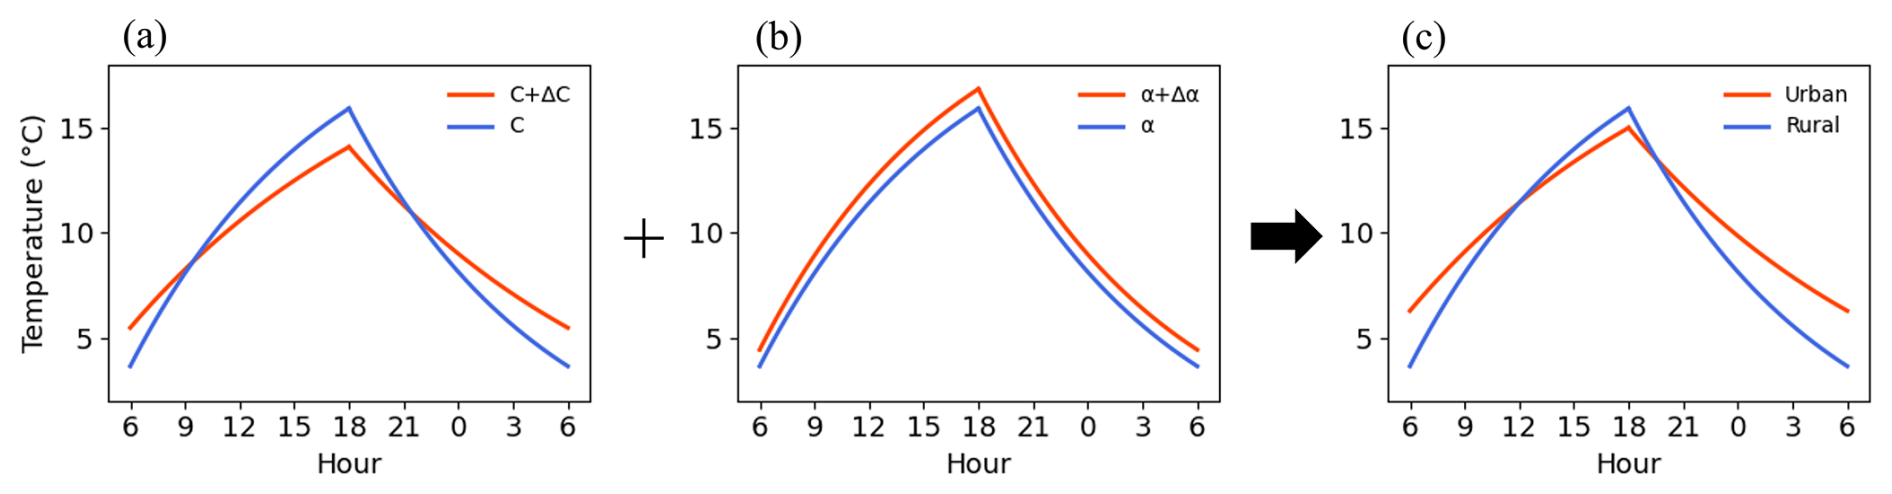
Figure 5(a) Effects of increase in heat capacity on the diurnal variation of the UHI, (b) effects of reduction in albedo on the diurnal variation of the UHI, and (c) effects of both increase in heat capacity and reduction in albedo on the diurnal variation of the UHI found from the theoretical model under the same background state in urban and rural areas.
In the second case which considers background state differences, the overall results remain similar except that the lower alpha in urban areas increases the DTR by 1.18 °C compared to rural areas (Fig. 6b). However, since the reduction in DTR due to the increase in C (Fig. 6a) outweighs the increase caused by the decrease in α, the final result still shows a decrease in DTR (Fig. 6c).
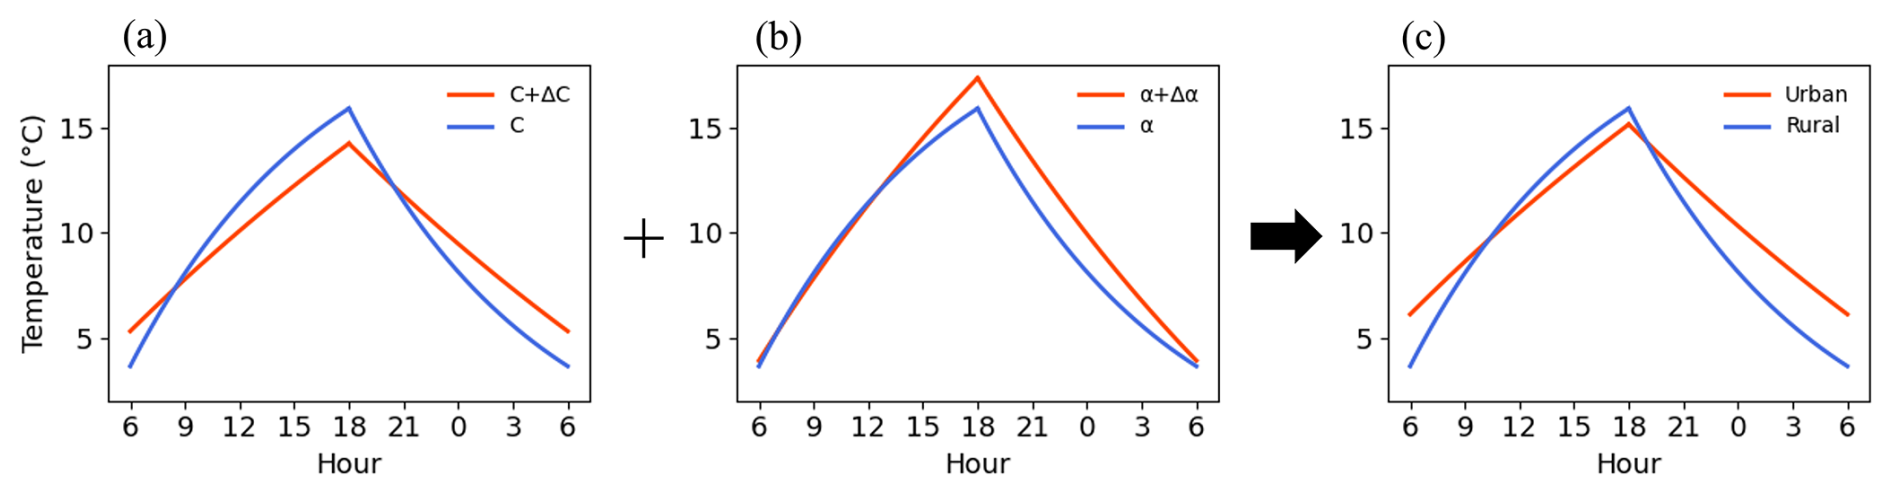
In conclusion, when urbanization occurs, the increase in heat capacity leads to a reduction in DTR as past effects accumulate over longer periods. Here, the temperature in urban areas is higher than in rural areas at night, but during the day, the temperature in urban areas can be lower than that in rural areas. This phenomenon occurs because the high heat capacity of urban surfaces allows them to store a significant amount of heat and to be warmed more slowly than rural areas, leading to the urban cool island (UCI) during the day. The causes of the UCI have been similarly discussed in Giovannini et al. (2011), Ganbat et al. (2013), and Santamouris (2015). Additionally, the decrease in albedo does contribute to an increase in DTR, but its effect is minimal. Therefore, among the increase in heat capacity and the decrease in albedo, the increase in heat capacity has a greater influence on DTR, while the decrease in albedo plays a more significant role in increasing the average temperature. When these two changes co-occur, there is little temperature difference between urban and rural areas during the day but the temperature difference is pronounced at night, meaning that the UHI is stronger at night (Figs. 5c and 6c).
Furthermore, urban vulnerability is closely linked to decreased system stability, suggesting that cities will be more vulnerable when global warming occurs. Vulnerability is defined by the magnitude of λ in Eq. (10), where λ is inversely proportional to heat capacity C. Therefore, the high heat capacity of cities leads to smaller λ values, resulting in reduced system stability, causing temperatures to react more dramatically to even small external factors. Although several studies have revealed that cities are highly vulnerable to climate change, urban climate vulnerability is not limited to the effect of heat capacity but is instead determined by much more complex and broader factors such as infrastructure, population density, urban land use, and geographical location (McCarthy et al., 2010; Lankao and Qin, 2011; Garschagen and Romero-Lankao, 2015; Dodman et al., 2022). Therefore, the heat capacity effect emphasized in this study should be understood as one mechanism among many. Moreover, λ is influenced not only by heat capacity but also by various combined fluxes and can significantly vary depending on regional, seasonal, and temporal factors. However, we assume it as a constant value for urban and rural areas, which limits the ability to fully capture the subtle variabilities present in actual urban environments.
Nevertheless, the main purpose of this study is to qualitatively understand the key mechanisms of the UHI by simplifying the problem. To achieve this, we track the core physical processes of the UHI by introducing a simple day-night model to the SEB equation and present a simplified theoretical framework applicable even in complex environments. In particular, we demonstrat that this approach is also effective in understanding the diurnal variability of the UHI by incorporating the concept of the two-season model, which was used to explain the seasonal variability of sea ice, into our day-night model. So, the results of this study not only contribute to a qualitative understanding of the main characteristics of the UHI but also suggest that this theoretical approach can be utilized in various environmental and climate research fields in the future.
4.2 Diurnal variations of UHI intensity
In this subsection, we focus on showcasing the similarity between our theoretical model's predictions and the observed data. Our findings argue that urbanization can be theoretically articulated and its effects are quantitatively mirrored in observed data.
Seoul is selected as an urban area, while Yangpyeong is selected as rural area. Seoul, as South Korea's representative city, reflects the characteristics of urbanization. As of 2024, Seoul's population density is 15 506 people per km2, approximately 107 times that of Yangpyeong (144 people per km2). This stark difference in population density provides an important background for comparing the effects of urbanization between the two regions.
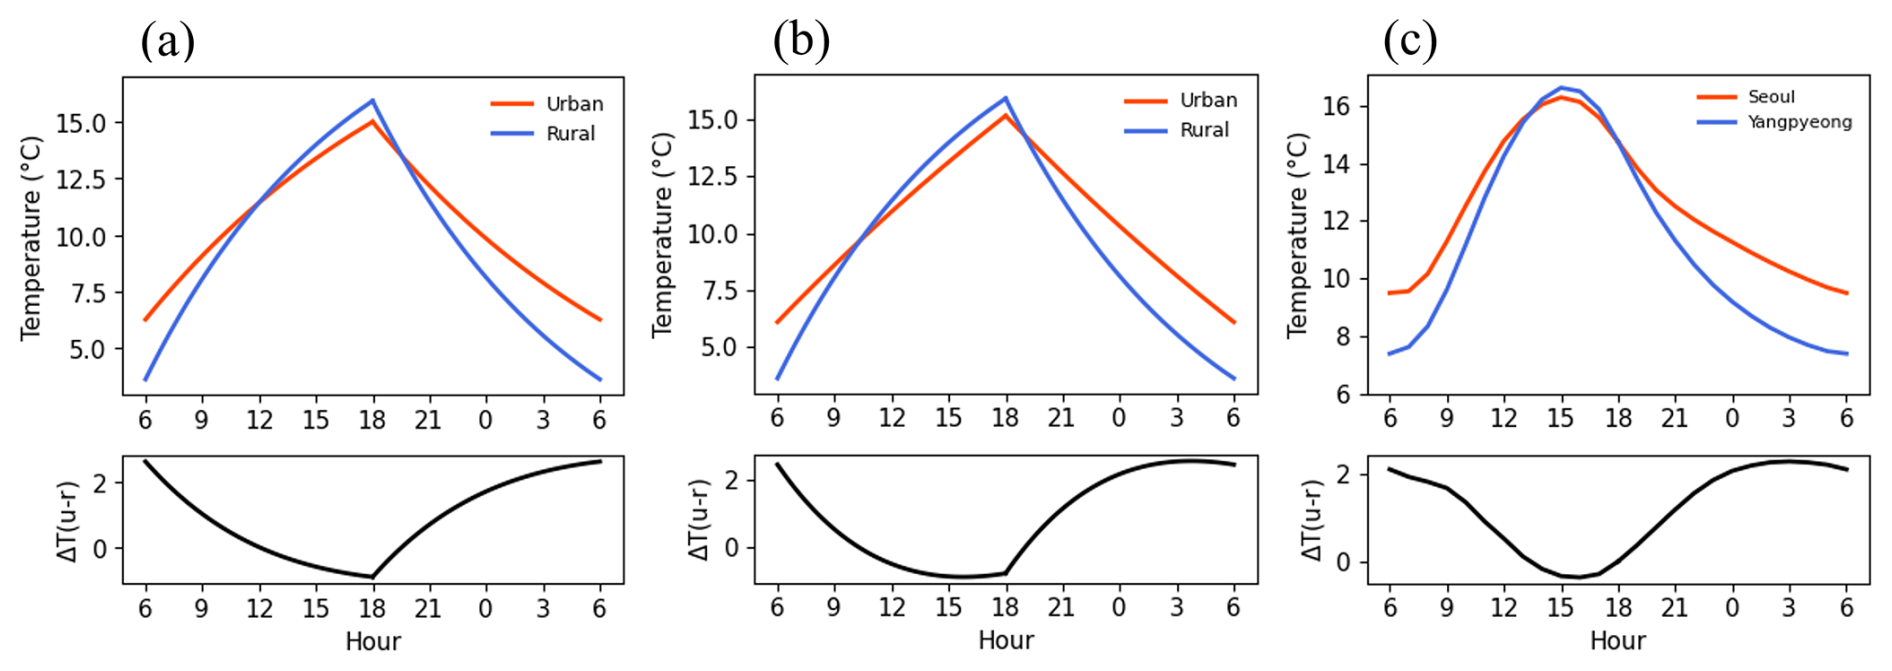
Figure 7(a) Diurnal variations of urban (orange) and rural (blue) near-surface air temperatures and UHI intensity (black) calculated by the theoretical model under the same background state. (b) Same as (a) except for different background state. (c) Same as (a) except for those found in observations at Seoul (orange) and Yangpyeong (blue) stations.
The core of our analysis lies in the qualitative agreement between the model results and the observed UHI in Seoul and Yangpyeong. The model, grounded in fundamental principles, captures the phenomenon where urban areas retain heat accumulated during the day, resulting in significantly higher nighttime temperatures compared to rural areas (Fig. 7a). This pattern is consistently reproduced in the model even when background state differences between urban and rural areas are considered (Fig. 7b). The observational data also show that nighttime temperatures in Seoul are higher than those in Yangpyeong (Fig. 7c). Additionally, in both the model and observational data, a temporary UCI appears at peak daytime temperatures, which is expected to result from the high heat capacity of urban materials, as shown in Fig. 5a. These results indicate that Seoul has a significant heat storage effect, which is consistently captured by both the SEB model and the observational data.
However, the nighttime temperature rise observed in the data is also strongly influenced by the difference in boundary layer height between day and night. During the day, a deep mixed boundary layer develops, which dilutes the urban–rural heat flux differences, whereas at night, a shallow stable boundary layer forms, amplifying the same differences (Pal et al., 2012; Wouters et al., 2013; Barlow et al., 2015). Although this process is not explicitly considered in our simplified model, it represents an important complementary factor for understanding the enhanced nighttime UHI observed in reality.
The significance of our study lies in showing that the seemingly complex UHI can be fundamentally interpreted and explained through a simple theoretical model. While the model's monotonic pattern and differences in the timing of peak temperatures highlight the limitations of the simplified day-night model compared to actual observations, the fundamental characteristic of the UHI – where daytime temperatures are similar, but nighttime temperatures in rural areas are significantly lower than those in urban areas – is consistently captured. This approach not only validates the theoretical foundation of our model but also enhances its practical relevance.
4.3 Long-term changes in UHI inensity in Seoul and Suwon with urbanization
In the previous subsection, the simplified day-night model is shown to qualitatively agree with the observations in Seoul and Yangpyeong. This agreement demonstrates the fundamental mechanism whereby heat accumulated during the day is retained at night, thereby strengthening the UHI. Building on this insight, this subsection extends the analysis to long-term observational records, analyzing changes in the UHI intensity in a megacity (Seoul) and a major city (Suwon) and comparing the impacts of their different urbanization rates. Seoul has experienced rapid urbanization since the 1970s due to industrialization and population growth. Suwon also began urbanizing in the 1970s, but its development progressed more gradually, with key milestones such as the formation of a central business district in the 1980s and new city developments in the 1990s. Based on this, the study examines the patterns of the UHI, DTR, and average temperature changes to find the relationship between urbanization and UHI. To analyze these changes, Yangpyeong is selected as the rural reference area for Seoul, and Icheon is selected for Suwon. Since they have similar topographical features, making them suitable for comparison.
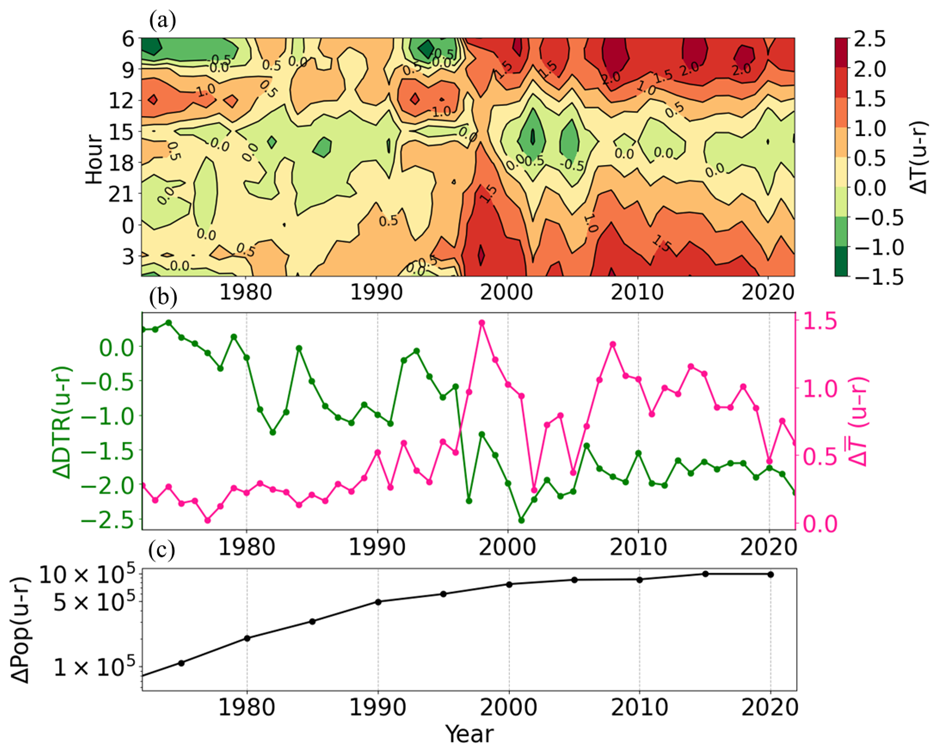
For Seoul, the late-night to early morning UHI intensity exhibits an increasing trend between 1972 and 1990 (p<0.05; Fig. 8a). This pattern matches the urbanization process in Seoul and the concurrent reduction in DTR qualitatively supports the core insight of our model: heat accumulated during the day influences nighttime temperatures (Fig. 8b). On the other hand, during the same period, the afternoon UHI intensity exhibits a decreasing trend (p<0.05). Since site-specific factors such as differences in elevation and latitude remain nearly constant in time, this decrease can be interpreted as a strengthening of UCI characteristics associated with long-term urbanization. The SEB model analysis (Fig. 5a) also suggests that an increase in heat capacity in urban areas can cause a temporary UCI during the day. These changes in UHI and UCI correspond to the increasing DTR difference and average temperature difference between Seoul and Yangpyeong, reinforcing the consistency between the long-term observations and the SEB-based model (Fig. 8b).
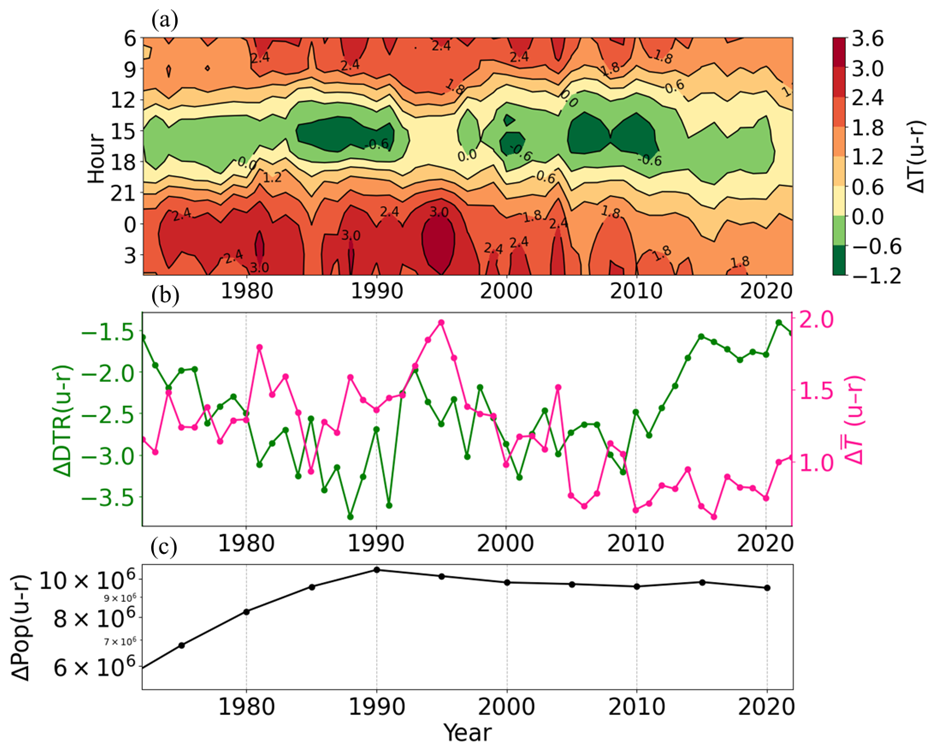
Figure 8(a) Long-term changes in annual average UHI intensity in Seoul (shade) for each hour, (b) long-term changes in annual average UHI intensity in Seoul (pink) and urban-rural difference in DTR (green), and (c) long-term changes in urban-rural difference in population between Seoul and Yangpyeong.
After 1990, the UHI pattern in Seoul began to change. The daytime UHI intensity exhibits an insignificant trend, but the nighttime UHI intensity exhibits a decreasing trend (p<0.05; Fig. 8a). It is also seen that both the DTR difference and the average temperature difference decline. This may be associated with the overall decreasing urban-rural population difference between Seoul and Yangpyeong which indicates the migration of people to nearby areas and the urbanization of rural areas like Yangpyeong (Fig. 8c). In particular, while the area surrounding the Seoul station experienced rapid urban development from the 1970s and underwent little additional development after the 1990s, the area around the Yangpyeong station, which had been predominantly agricultural, has gradually urbanized since the 1990s following the reopening of the railway station. While population change alone cannot fully explain these patterns, they can be interpreted as additional evidence of how heat storage and release mechanisms operate over the long term during the urbanization process.
For Suwon, there was little difference in temperature between Suwon and Icheon in 1972. The UHI intensity is weak both during the day and at night, while the DTR is larger in Suwon than in Icheon and the average temperature is nearly comparable between the two sites (Fig. 9a). However, from 1972 to 2022, the nighttime UHI intensity exhibits an increasing trend (p<0.05), while the daytime UHI intensity exhibits an insignificant trend. More specifically, from 1972 to 1990, the nighttime UHI intensity exhibits an increasing trend (p<0.05), while the daytime UHI intensity exhibits a decreasing trend (p<0.05). The increasing trend in nighttime UHI intensity becomes more prominent from 1990 to 2000 (p<0.05), whereas the trend in daytime UHI intensity becomes statistically insignificant. In particular, the abrupt change observed around 1998 can be interpreted as reflecting the urbanization of the surrounding environment, as a large residential complex was constructed about 200 m from the station in 1984. Since the 2000s, both daytime and nighttime UHI intensities exhibit insignificant trends. The increasing trend in UHI intensity is align with those in the DTR difference and average temperature difference between Suwon and Icheon (Fig. 9b), indicating that the growing urban-rural population difference and the enhanced nighttime heat storage effect associated with urbanization play an important role. This interpretation is also in line with the time-integrated SEB perspective proposed in this study (Fig. 9c).
Comparing the UHI changes in Seoul and Suwon shows that the UHI growth and stabilization follow different patterns depending on the stage of urbanization. Seoul exhibits an increasing trend in UHI intensity from 1972 to 1990 but later with the urban-rural population difference decline, UHI intensity has exhibited a decreasing trend. In contrast, Suwon exhibits an increasing trend in UHI intensity as urbanization has progressed since the 1970s. At a certain level, even if urbanization continues, the UHI growth may slow down or stabilize.
Long-term temperature trends in real urban environments arise from the combined and interacting effects of multiple factors, including not only changes in heat capacity emphasized in this study, but also increases in anthropogenic heat emissions, suppressed evapotranspiration due to the expansion of impervious surfaces, and modifications of radiative balance associated with atmospheric pollutants. Nevertheless, these long-term observational changes support the conclusion of our model that urbanization amplifies the differences in heat accumulation and release mechanisms between urban and rural areas.
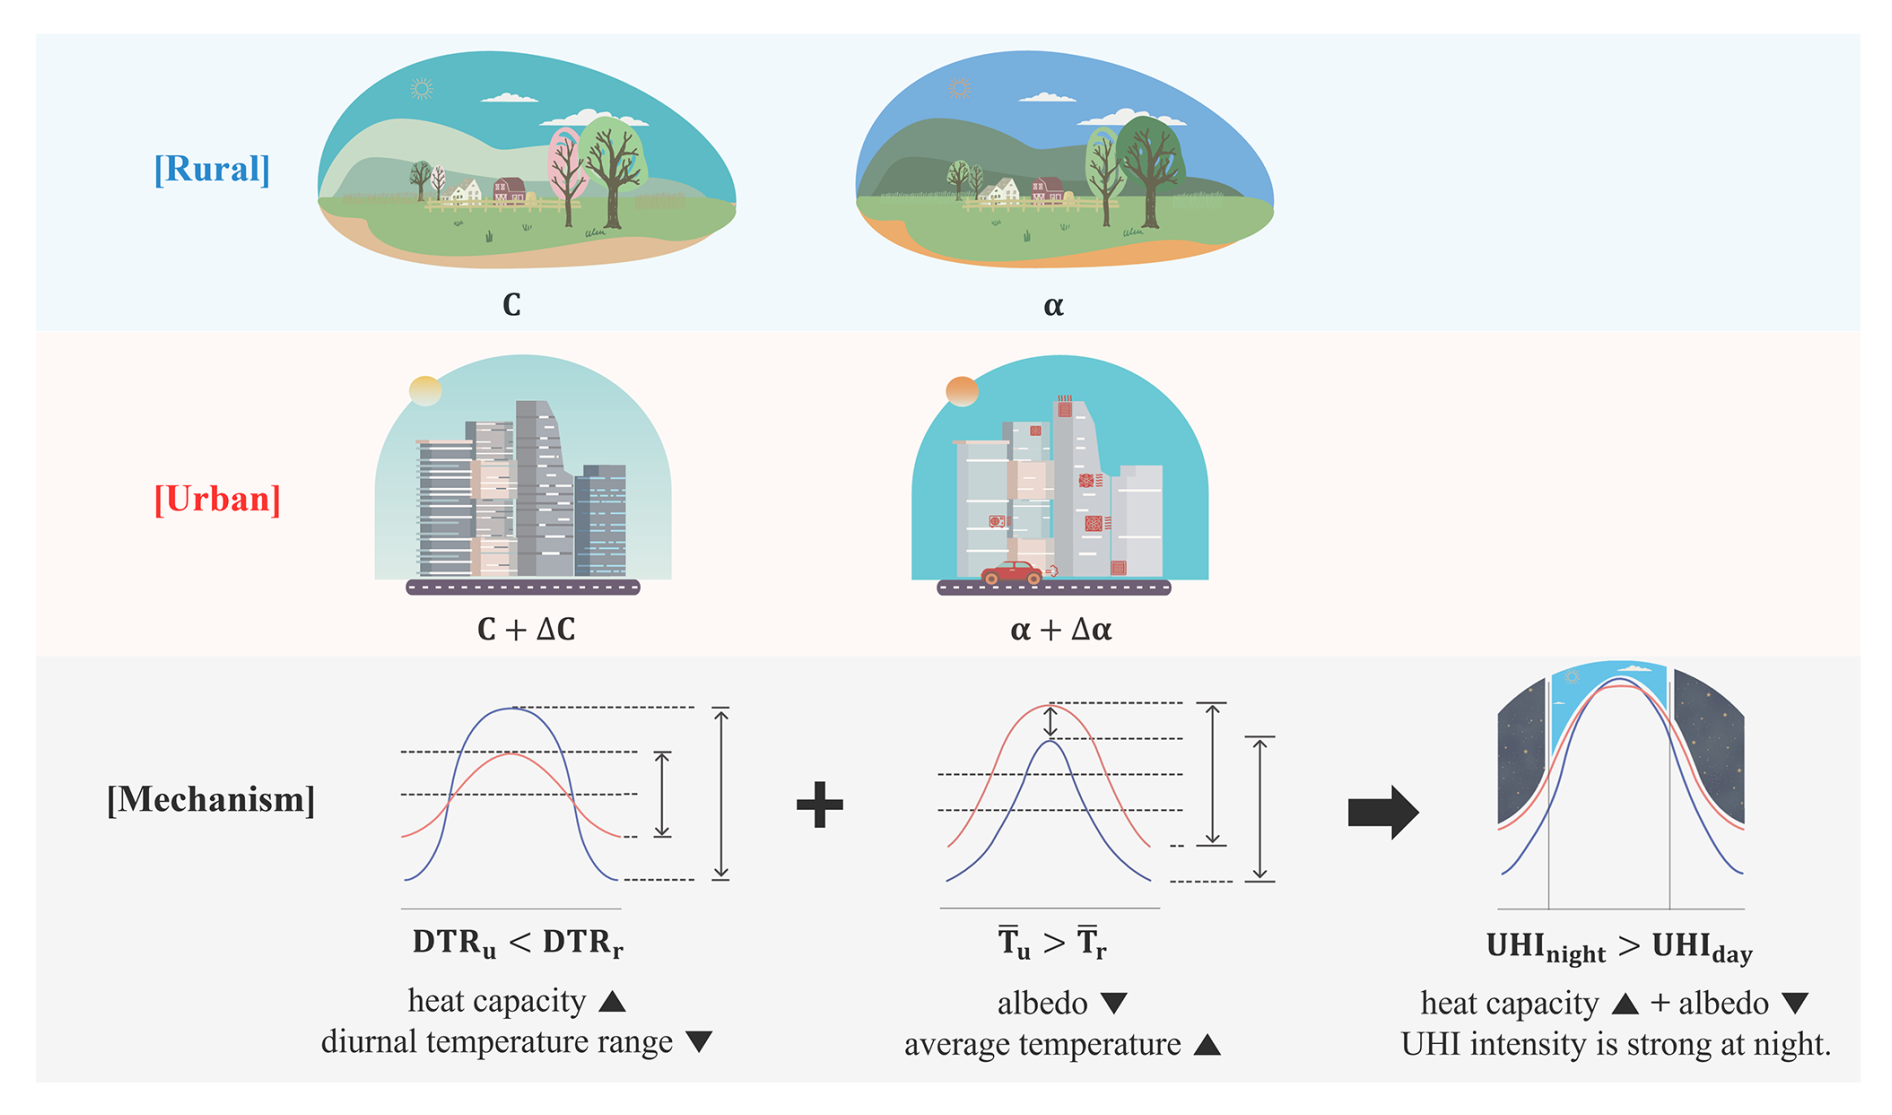
Figure 10Schematic diagram of the main mechanisms of the UHI. In this study, we analyze the mechanisms of the UHI using a SEB model coupled with a simple day-night model. Compared to rural areas, urban areas exhibit larger heat capacity (ΔC) due to man-made materials such as concrete and asphalt. Due to the larger heat capacity in urban areas, heat is more stored during the day and is more released at night, leading to a reduction in DTR. In addition, due to lower albedo in urban areas (Δα), more energy is absorbed at the surface, raising the average temperature in urban areas. These two processes – “decreased DTR due to larger urban heat capacity (ΔC)” and “increased average temperature due to lower urban albedo (Δα)” – make the UHI particularly strong at night. The diurnal variation of the UHI obtained from observational data is qualitatively similar to that obtained from the theoretical model.
This study demonstrates how urbanization influences the formation of the UHI through a simplified theoretical model. In particular, we integrate the SEB equation with a simplified day–night model and introduce a time-integrated approach to analyze how cumulative energy affects air temperature variations. The transformation of a periodic non-autonomous system, such as the day–night model, into two autonomous systems allows the extraction of representative characteristics in a simple and transparent way. This integral perspective, which has not been sufficiently emphasized in previous studies, provides a new lens to reinterpret well-known UHI mechanisms over time. Through this simple and intuitive model, the primary mechanisms of the UHI can be identified: The results confirm that the primary drivers of the UHI are the reduction in DTR due to the increased heat capacity of urban surface materials and the increase in average temperature due to lower albedo in urban areas (Fig. 10). The combination of these factors results in a UHI characterized by higher nighttime temperatures in cities compared to rural areas, while also leading to the occurrence of a temporary UCI during the day.
To validate the SEB model against real-world observations, we compare theoretical predictions with observational data from Seoul (urban) and Yangpyeong (rural). Both the model and the data consistently exhibit a strong heat storage effect, showing that heat absorbed during the day is released at night and intensifies the nighttime UHI. The observed temporary UCI during the day supports the predictions of the simplified SEB model.
To explore the long-term evolution of the UHI, we compare two cities with different urbanization trajectories. In Seoul, which has experienced rapid urbanization from the 1970s, the nighttime temperature exhibits an increasing trend while the daytime temperature exhibits a decreasing trend between 1972 and 1990. However, after reaching saturation in the 1990s, the UHI intensity between the urban and rural areas began to decline. This pattern broadly corresponds to population changes and urbanization processes. In contrast, Suwon, which has developed gradually, exhibits a gradual increase in nighttime temperature differences in parallel with population growth and urban expansion. Moreover, the observed reduction in DTR and increase in average temperature align well with SEB model predictions. These findings highlight the significant impact of urban development patterns on UHI evolution.
Incorporating a simplified day-night model into the SEB framework and confirming its agreement with observations, this study demonstrates the utility of theoretical models in explaining complex UHI and provides a foundation for predictive tools in future research. While this study establishes a theoretical framework for understanding the UHI, several challenges remain. First, it is difficult to quantify the contribution of each flux individually. In particular, while this study emphasizes the large heat capacity of urban surface materials, urban thermal inertia is not determined by material properties alone. Therefore, the heat capacity effect highlighted in this study should be understood as one mechanism among many. Second, the SEB model expresses temperature as a function of surface temperature (Ts) and subsequently assumes a linear relationship between surface and air temperatures () for analytical purposes. This assumption represents a clear limitation of the model, as it does not fully capture the complex interactions between surface and atmospheric processes. However, this simplification is necessary to construct a model that maintains computational efficiency while retaining key physical mechanisms. Third, this study does not account for anthropogenic heat in the calculation process, although anthropogenic heat is expected to further amplify the difference in between urban and rural areas. Finally, this study does not take into account the day–night differences in boundary layer depth, which can influence how strongly temperatures respond to the same flux differences.
Nevertheless, this study demonstrates that the essence of UHI mechanisms can be intuitively explained through a simplified time-integrated model, highlighting that theoretical modeling still plays an important role in interpreting complex urban climate systems. Additionally, by utilizing ASOS data from South Korea, this study provides valuable insights into UHI dynamics in mid-latitude regions and can contribute to a broader understanding of the UHI by extending research to other areas with similar climatic and urbanization characteristics. In conclusion, this study bridges theoretical modeling and empirical observations, providing a new approach to understanding the UHI. The findings reinforce the necessity of sustainable urban development and establish a foundation for advancing knowledge on complex urban climate dynamics.
The code used in this study is available from the corresponding author upon reasonable request.
The observational data used in this study are publicly available from the Korea Meteorological Administration (KMA) via the Weather Data Open Portal at https://data.kma.go.kr/data/grnd/selectAsosRltmList.do?pgmNo=36 (last access: 18 December 2025).
MJ contributed to the original draft writing, software development, data curation, validation, investigation, visualization, and formal analysis. KP contributed to software development, validation, investigation, and manuscript editing. WM contributed to conceptualization, methodology development, formal analysis, supervision, and manuscript editing. JJK contributed to supervision and manuscript editing. JJB contributed to supervision and manuscript editing.
The contact author has declared that none of the authors has any competing interests.
Publisher's note: Copernicus Publications remains neutral with regard to jurisdictional claims made in the text, published maps, institutional affiliations, or any other geographical representation in this paper. The authors bear the ultimate responsibility for providing appropriate place names. Views expressed in the text are those of the authors and do not necessarily reflect the views of the publisher.
This research was supported by the 2023 Capstone Design course.
This research has been supported by the Korea Meteorological Administration (grant no. RS-2024-00404042) and by the LAMP Program of the National Research Foundation of Korea (NRF), funded by the Ministry of Education (grant no. RS-2023-00301702).
This paper was edited by Takemasa Miyoshi and reviewed by two anonymous referees.
Adachi, S. A., Kimura, F., Takahashi, H. G., Hara, M., Ma, X., and Tomita, H.: Impact of high-resolution sea surface temperature and urban data on estimations of surface air temperature in a regional climate, Journal of Geophysical Research: Atmospheres, 121, 10 486–10 504, 2016. a
Al-Obaidi, I., Rayburg, S., Półrolniczak, M., and Neave, M.: Assessing the impact of wind conditions on urban heat islands in large Australian cities, Journal of Ecological Engineering, 22, 1–15, 2021. a
Barlow, J. F., Halios, C. H., Lane, S. E., and Wood, C. R.: Observations of urban boundary layer structure during a strong urban heat island event, Environmental Fluid Mechanics, 15, 373–398, 2015. a
Berwal, S., Kumar, D., Pandey, A. K., Singh, V. P., Kumar, R., and Kumar, K.: Dynamics of thermal inertia over highly urban city: a case study of Delhi, in: Remote Sensing Technologies and Applications in Urban Environments, SPIE, 108–114, https://doi.org/10.1117/12.2241741, 2016. a
Borbora, J. and Das, A. K.: Summertime urban heat island study for Guwahati city, India, Sustainable Cities and Society, 11, 61–66, 2014. a
Cao, C., Lee, X., Liu, S., Schultz, N., Xiao, W., Zhang, M., and Zhao, L.: Urban heat islands in China enhanced by haze pollution, Nature Communications, 7, 12509, https://doi.org/10.1038/ncomms12509, 2016. a
Chakraborty, T. and Lee, X.: A simplified urban-extent algorithm to characterize surface urban heat islands on a global scale and examine vegetation control on their spatiotemporal variability, International Journal of Applied Earth Observation and Geoinformation, 74, 269–280, 2019. a
Chapman, S., Watson, J. E., Salazar, A., Thatcher, M., and McAlpine, C. A.: The impact of urbanization and climate change on urban temperatures: a systematic review, Landscape Ecology, 32, 1921–1935, 2017. a
Christen, A. and Vogt, R.: Energy and radiation balance of a central European city, International Journal of Climatology, 24, 1395–1421, 2004. a
Corumluoglu, O. and Asri, I.: The effect of urban heat island on Izmir's city ecosystem and climate, Environmental Science and Pollution Research, 22, 3202–3211, 2015. a
Dodman, D., Hayward, B., Pelling, M., Broto, V. C., Chow, W., Chu, E., Dawson, R., Khirfan, L., McPhearson, T., and Prakash, A.: Cities, Settlements and Key Infrastructure, in: Climate Change 2022: Impacts, Adaptation, and Vulnerability. Contribution of Working Group II to the Sixth Assessment Report of the Intergovernmental Panel on Climate Change, IPCC AR6 WGII chapter (full bibliographic details/DOI not provided in source list), https://doi.org/10.1017/9781009325844.008, 2022. a
Elagib, N. A.: Evolution of urban heat island in Khartoum, International Journal of Climatology, 31, 1377–1388, 2011. a
Ferreira, M. J., de Oliveira, A. P., and Soares, J.: Diurnal variation in stored energy flux in São Paulo city, Brazil, Urban Climate, 5, 36–51, 2013. a
Fujibe, F.: Time-of-the-day dependence of long-term temperature changes at urban meteorological stations in Japan, Journal of the Meteorological Society of Japan Ser. II, 75, 1041–1051, 1997. a
Ganbat, G., Han, J.-Y., Ryu, Y.-H., and Baik, J.-J.: Characteristics of the urban heat island in a high-altitude metropolitan city, Ulaanbaatar, Mongolia, Asia-Pacific Journal of Atmospheric Sciences, 49, 535–541, 2013. a
Garschagen, M. and Romero-Lankao, P.: Exploring the relationships between urbanization trends and climate change vulnerability, Climatic Change, 133, 37–52, 2015. a
Giovannini, L., Zardi, D., and De Franceschi, M.: Analysis of the urban thermal fingerprint of the city of Trento in the Alps, Journal of Applied Meteorology and Climatology, 50, 1145–1162, 2011. a
Goward, S. N.: Thermal behavior of urban landscapes and the urban heat island, Physical Geography, 2, 19–33, 1981. a
Grimm, N. B., Faeth, S. H., Golubiewski, N. E., Redman, C. L., Wu, J., Bai, X., and Briggs, J. M.: Global change and the ecology of cities, Science, 319, 756–760, 2008. a
Grimmond, C. and Oke, T. R.: Heat storage in urban areas: Local-scale observations and evaluation of a simple model, Journal of Applied Meteorology and Climatology, 38, 922–940, 1999. a, b
Grimmond, S.: Urbanization and global environmental change: local effects of urban warming, The Geographical Journal, 173, 83–88, 2007. a
Gunawardena, K. R., Wells, M. J., and Kershaw, T.: Utilising green and bluespace to mitigate urban heat island intensity, Science of the Total Environment, 584, 1040–1055, 2017. a
Han, W., Li, Z., Wu, F., Zhang, Y., Guo, J., Su, T., Cribb, M., Fan, J., Chen, T., Wei, J., and Lee, S.-S.: The mechanisms and seasonal differences of the impact of aerosols on daytime surface urban heat island effect, Atmos. Chem. Phys., 20, 6479–6493, https://doi.org/10.5194/acp-20-6479-2020, 2020. a
Kim, Y.-H. and Baik, J.-J.: Daily maximum urban heat island intensity in large cities of Korea, Theoretical and Applied Climatology, 79, 151–164, 2004. a
Korea Meteorological Administration (KMA): Automated Surface Observing System (ASOS) data [data set], Weather Data Open Portal, https://data.kma.go.kr/data/grnd/selectAsosRltmList.do?pgmNo=36 (last access: 18 December 2025), 2025. a
Lamptey, B., Barron, E., and Pollard, D.: Impacts of agriculture and urbanization on the climate of the northeastern united states, Global and Planetary Change, 49, 203–221, 2005. a
Lankao, P. R. and Qin, H.: Conceptualizing urban vulnerability to global climate and environmental change, Current Opinion in Environmental Sustainability, 3, 142–149, 2011. a
Lee, S.-H. and Baik, J.-J.: Statistical and dynamical characteristics of the urban heat island intensity in Seoul, Theoretical and Applied Climatology, 100, 227–237, 2010. a
Li, D., Sun, T., Liu, M., Yang, L., Wang, L., and Gao, Z.: Contrasting responses of urban and rural surface energy budgets to heat waves explain synergies between urban heat islands and heat waves, Environmental Research Letters, 10, 054009, https://doi.org/10.1088/1748-9326/10/5/054009, 2015. a
Li, D., Wang, L., Liao, W., Sun, T., Katul, G., Bou-Zeid, E., and Maronga, B.: Persistent urban heat, Science Advances, 10, eadj7398, https://doi.org/10.1126/sciadv.adj7398, 2024. a, b, c
Liu, W. and Wang, Y.: Temporal comparison of land surface albedo for three different land use cover types in the Beijing area, in: Remote Sensing and Modeling of Ecosystems for Sustainability IV, SPIE, 136–145, https://doi.org/10.1117/12.731303, 2007. a
Luber, G. and McGeehin, M.: Climate change and extreme heat events, American Journal of Preventive Medicine, 35, 429–435, 2008. a
Manoli, G., Fatichi, S., Schläpfer, M., Yu, K., Crowther, T. W., Meili, N., Burlando, P., Katul, G. G., and Bou-Zeid, E.: Magnitude of urban heat islands largely explained by climate and population, Nature, 573, 55–60, 2019. a, b
Mathew, A., Khandelwal, S., and Kaul, N.: Analysis of diurnal surface temperature variations for the assessment of surface urban heat island effect over Indian cities, Energy and Buildings, 159, 271–295, 2018. a
McCarthy, M. P., Best, M. J., and Betts, R. A.: Climate change in cities due to global warming and urban effects, Geophysical Research Letters, 37, L09705, https://doi.org/10.1029/2010GL042845, 2010. a
Memon, R. A., Leung, D. Y. C., and Liu, C.-H.: A review on the generation, determination and mitigation of urban heat island, Journal of Environmental Sciences, 20, 120–128, 2008. a
Mitchell, J. M. J.: The temperature of cities, Weatherwise, 14, 224–258, 1961. a
Mohajerani, A., Bakaric, J., and Jeffrey-Bailey, T.: The urban heat island effect, its causes, and mitigation, with reference to the thermal properties of asphalt concrete, Journal of Environmental Management, 197, 522–538, 2017. a
Mohammed, A., Pignatta, G., Topriska, E., and Santamouris, M.: Canopy urban heat island and its association with climate conditions in Dubai, UAE, Climate, 8, 81, https://doi.org/10.3390/cli8060081, 2020. a
Montávez, J. P., Rodríguez, A., and Jiménez, J. I.: A study of the urban heat island of Granada, International Journal of Climatology, 20, 899–911, 2000. a
Moon, W. and Wettlaufer, J.: On the existence of stable seasonally varying arctic sea ice in simple models, Journal of Geophysical Research: Oceans, 117, C07007, https://doi.org/10.1029/2012JC008006, 2012. a, b, c, d
Moon, W. and Wettlaufer, J.: A stochastic perturbation theory for non-autonomous systems, Journal of Mathematical Physics, 54, 123303, https://doi.org/10.1063/1.4848776, 2013. a
Myrup, L. O.: A numerical model of the urban heat island, Journal of Applied Meteorology and Climatology, 8, 908–918, 1969. a
Nichol, J. E., Fung, W. Y., Lam, K., and Wong, M. S.: Urban heat island diagnosis using ASTER satellite images and “in situ” air temperature, Atmospheric Research, 94, 276–284, 2009. a
Oke, T. R.: The energetic basis of the urban heat island, Quarterly Journal of the Royal Meteorological Society, 108, 1–24, 1982. a, b, c, d
Oke, T. R.: The urban energy balance, Progress in Physical Geography, 12, 471–508, 1988. a, b, c
Oke, T. R., Mills, G., Christen, A., and Voogt, J. A.: Urban Climates, Cambridge University Press, https://doi.org/10.1017/9781139016476, 2017. a
Pal, S., Xueref-Remy, I., Ammoura, L., Chazette, P., Gibert, F., Royer, P., Dieudonné, E., Dupont, J. C., Haeffelin, M., Lac, C., Lopez, M., Morille, Y., and Ravetta, F.: Spatio-temporal variability of the atmospheric boundary layer depth over the Paris agglomeration: An assessment of the impact of the urban heat island intensity, Atmospheric Environment, 63, 261–275, 2012. a, b
Park, K., Baik, J.-J., Jin, H.-G., and Tabassum, A.: Changes in urban heat island intensity with background temperature and humidity and their associations with near-surface thermodynamic processes, Urban Climate, 58, 102191, https://doi.org/10.1016/j.uclim.2024.102191, 2024. a
Parker, J.: The Leeds urban heat island and its implications for energy use and thermal comfort, Energy and Buildings, 235, 110636, https://doi.org/10.1016/j.enbuild.2020.110636, 2021. a
Qiu, G. Y., Zou, Z., Li, X., Li, H., Guo, Q., Yan, C., and Tan, S.: Experimental studies on the effects of green space and evapotranspiration on urban heat island in a subtropical megacity in China, Habitat International, 68, 30–42, 2017. a
Rajagopalan, P., Lim, K. C., and Jamei, E.: Urban heat island and wind flow characteristics of a tropical city, Solar Energy, 107, 159–170, 2014. a, b
Runnalls, K. and Oke, T.: Dynamics and controls of the near-surface heat island of Vancouver, British Columbia, Physical Geography, 21, 283–304, 2000. a
Ryu, Y.-H. and Baik, J.-J.: Quantitative analysis of factors contributing to urban heat island intensity, Journal of Applied Meteorology and Climatology, 51, 842–854, 2012. a
Ryu, Y.-H., Baik, J.-J., and Lee, S.-H.: A new single-layer urban canopy model for use in mesoscale atmospheric models, Journal of Applied Meteorology and Climatology, 50, 1773–1794, 2011. a
Sailor, D. J.: Simulated urban climate response to modifications in surface albedo and vegetative cover, Journal of Applied Meteorology and Climatology, 34, 1694–1704, 1995. a
Sailor, D. J.: A review of methods for estimating anthropogenic heat and moisture emissions in the urban environment, International Journal of Climatology, 31, 189–199, 2011. a
Santamouris, M.: Analyzing the heat island magnitude and characteristics in one hundred Asian and Australian cities and regions, Science of the Total Environment, 512, 582–598, 2015. a, b
Skamarock, W. C., Klemp, J. B., Dudhia, J., Gill, D. O., Liu, Z., Berner, J., Wang, W., Powers, J. G., Duda, M. G., Barker, D. M., and Huang, X. Y.: A description of the Advanced Research WRF model version 4, Tech. Rep. Tech. Note TN-556+STR, NCAR, https://doi.org/10.5065/1DFH-6P97, 2019. a
Stanhill, G. and Kalma, J.: Solar dimming and urban heating at Hong Kong, International Journal of Climatology, 15, 933–941, 1995. a
Stewart, I. D., Krayenhoff, E. S., Voogt, J. A., Lachapelle, J. A., Allen, M. A., and Broadbent, A. M.: Time evolution of the surface urban heat island, Earth's Future, 9, e2021EF002178, https://doi.org/10.1029/2021EF002178, 2021. a
Sugawara, H. and Takamura, T.: Surface albedo in cities: case study in Sapporo and Tokyo, Japan, Boundary-Layer Meteorology, 153, 539–553, 2014. a
Taha, H.: Urban climates and heat islands: albedo, evapotranspiration, and anthropogenic heat, Energy and Buildings, 25, 99–103, 1997. a, b
Theeuwes, N. E., Steeneveld, G. J., Ronda, R. J., and Holtslag, A. A. M.: A diagnostic equation for the daily maximum urban heat island effect for cities in northwestern Europe, International Journal of Climatology, 37, 443–454, 2017. a
Thorndike, A.: A toy model linking atmospheric thermal radiation and sea ice growth, Journal of Geophysical Research: Oceans, 97, 9401–9410, 1992. a, b, c, d, e
UN-Habitat: World cities report 2022: envisaging the future of cities, UN, https://digitallibrary.un.org/record/3984713?&v=pdf (last accessed: 18 December 2025), 2022. a
Varquez, A. C. G. and Kanda, M.: Global urban climatology: a meta-analysis of air temperature trends (1960–2009), npj Climate and Atmospheric Science, 1, 32, https://doi.org/10.1038/s41612-018-0042-8, 2018. a
Wang, A., Li, X. X., Xin, R., and Chew, L. W.: Impact of anthropogenic heat on urban environment: a case study of Singapore with high-resolution gridded data, Atmosphere, 14, 1499, https://doi.org/10.3390/atmos14101499, 2023. a
Wanphen, S. and Nagano, K.: Experimental study of the performance of porous materials to moderate the roof surface temperature by its evaporative cooling effect, Building and Environment, 44, 338–351, 2009. a
Wen, Y. and Lian, Z.: Influence of air conditioners utilization on urban thermal environment, Applied Thermal Engineering, 29, 670–675, 2009. a
Wouters, H., De Ridder, K., Demuzere, M., Lauwaet, D., and van Lipzig, N. P. M.: The diurnal evolution of the urban heat island of Paris: a model-based case study during Summer 2006, Atmos. Chem. Phys., 13, 8525–8541, https://doi.org/10.5194/acp-13-8525-2013, 2013. a
Yang, X. and Li, Y.: The impact of building density and building height heterogeneity on average urban albedo and street surface temperature, Building and Environment, 90, 146–156, 2015. a
Yuan, C., Adelia, A. S., Mei, S., He, W., Li, X. X., and Norford, L.: Mitigating intensity of urban heat island by better understanding on urban morphology and anthropogenic heat dispersion, Building and Environment, 176, 106876, https://doi.org/10.1016/j.buildenv.2020.106876, 2020. a
Zeng, Z., Piao, S., Li, L. Z. X., Zhou, L., Ciais, P., Wang, T., Li, Y., Lian, X., Wood, E. F., Friedlingstein, P., Mao, J., Estes, L. D., Myneni, R. B., Peng, S., Shi, X., Seneviratne, S. I., and Wang, Y.: Climate mitigation from vegetation biophysical feedbacks during the past three decades, Nature Climate Change, 7, 432–436, 2017. a
Zhao, L., Lee, X., Smith, R. B., and Oleson, K.: Strong contributions of local background climate to urban heat islands, Nature, 511, 216–219, 2014. a, b, c