the Creative Commons Attribution 4.0 License.
the Creative Commons Attribution 4.0 License.
Dynamic–statistic combined ensemble prediction and impact factors of China's summer precipitation
Xiaojuan Wang
Zihan Yang
Shuai Li
Qingquan Li
Guolin Feng
The dynamic–statistic prediction shows excellent performance with regard to monthly and seasonal precipitation prediction in China and has been applied to several dynamical models. In order to further improve the prediction skill of summer precipitation in China, the unequal-weighted ensemble prediction (UWE) using outputs of the dynamic–statistic prediction is presented, and its possible impact factors are also analysed. Results indicate that the UWE has shown promise in improving the prediction skill of summer precipitation in China on account of the fact that the UWE can overcome shortcomings with regard to the structural inadequacy of individual dynamic–statistic predictions, reducing formulation uncertainties and resulting in more stable and accurate predictions. Impact factor analysis indicates that (1) the station-based ensemble prediction, with an anomaly correlation coefficient (ACC) of 0.10–0.11 and a prediction score (PS) score of 69.3–70.2, has shown better skills than the grid-based one as the former produces a probability density distribution of precipitation that is closer to observations than the latter. (2) The use of the spatial average removed anomaly correlation coefficient (SACC) may lower the prediction skill and introduce obvious errors into the estimation of the spatial consistency of prediction anomalies. SACC could be replaced by the revised anomaly correlation coefficient (RACC), which is calculated directly using the precipitation anomalies of each station without subtracting the average precipitation anomaly of all stations. (3) The low dispersal intensity among ensemble samples of the UWE implies that the historically similar errors selected by means of different approaches are quite close to each other, making the correction of the model prediction more reliable. Therefore, the UWE is expected to further improve the accuracy of summer precipitation prediction in China by considering impact factors such as the grid- or station-based ensemble approach, the method of calculating the ACC, and the dispersal intensity of ensemble samples in the application and analysis process of the UWE.
- Article
(8370 KB) - Full-text XML
- BibTeX
- EndNote
Accurate prediction of summer precipitation across China is paramount for dealing with critical issues such as flood and drought management and economic development and for ensuring food security. However, this task is fraught with challenges due to the intricate interplay among various atmospheric-circulation components, including the East Asian summer monsoon (Ding, 1994; Lu, 2005), the Northwest Pacific subtropical high (Tao and Wei, 2006), and the East Asia–Pacific teleconnection patterns (Huang, 2004; Huang and Li, 1988). Additionally, external influences, such as the El Niño–Southern Oscillation (ENSO) (Sun et al., 2021) and the snow cover on the Tibetan Plateau (Si and Ding, 2013), further complicate the prediction process. Some studies have also shown that improving the real-time multivariate Madden–Julian oscillation (RMM) index or introducing better intraseasonal signal extraction methods may allow for higher predictability limits in real-time forecasting (Ding and Seo, 2010). Due to these complexities, increasing the accuracy of summer rainfall prediction in China still faces challenges, and the pursuit of more precise summer rainfall predictions in China is an endeavour that warrants the utmost attention from climate scientists (Gong et al., 2016; Wang et al., 2012).
Over the past few decades, there has been a remarkable progression in the foundation of observational data and theoretical understanding, which has significantly enhanced the capabilities of climate dynamical models in predicting seasonal rainfall (Gettelman et al., 2022; Jie et al., 2017). High-resolution climate simulations, such as those with atmospheric resolutions of approximately 50 km and oceanic resolutions of 0.25°, have been successfully implemented by several research institutions (Roberts et al., 2016; Satoh et al., 2014; Wu et al., 2021). These dynamic models have also demonstrated success in long-term prediction of atmospheric-circulation patterns and sea surface temperatures in low-latitude regions (Zhu and Shukla, 2013). However, the current performance of seasonal predictions for key climate elements, including rainfall and temperature, particularly in monsoon-influenced areas like East Asia (Gong et al., 2017; Wang et al., 2015), remains somewhat constrained due to inherent limitations in parameterization schemes and the challenges associated with boundary value problems (Wang et al., 2015). This has spurred meteorologists to delve deeper into understanding how to effectively enhance the seasonal prediction skills of climate models to better align with the needs of end-users (Gong et al., 2016). It is well recognized that regional climate characteristics can significantly influence local rainfall patterns and that atmospheric predictability varies significantly between regions, altitudes, and seasons (Li and Ding, 2011). Despite this, dynamic models still struggle to accurately capture these nuances, suggesting that there is potential for improvement in rainfall prediction through a statistical–dynamic approach (Specq and Batté, 2020). This integrated methodology could provide a more robust framework for prediction, ultimately leading to more reliable and actionable climate predictions. The relative impact of initial conditions and model uncertainties on local predictability also varies with the system state. Therefore, strategically reducing uncertainties in sensitive regions can effectively improve forecasting skills (Li et al., 2020b). Apart from that, warm events are easier to predict than cold events (Li et al., 2020a).
To enhance the precision of rainfall prediction, Chou (1974) initially suggested the integration of dynamical model data with statistical analogue information. This approach leverages the prediction errors from historical years with analogous initial conditions, such as similar circulation anomalies, snow cover, and sea surface temperature (SST), to refine dynamic–analogue correction techniques. For instance, Huang et al. (1993) introduced the evolutionary analogue-based multi-time prediction method, Ren and Chou (2006, 2007) employ historical analogue data to estimate model errors in accordance with the atmospheric analogy principle, and Feng et al. (2020, 2013) further develop this concept with their correction method focused on key regional impact factors. Wang and Fan (2009) proposed a scheme that integrates model forecasts with the observed spatial patterns of historical “analogue years”, while Gong et al. (2018) advanced the leading mode-based correction method. In addition to these advancements, dynamic–statistic correction methods have been successfully applied to rainfall predictions in regions such as northern China (Yang et al., 2012) and northeastern China (Xiong et al., 2011). Furthermore, the application of these dynamic–statistic predictions has been extended to seasonal predictions, including those for autumn, winter, and spring (Lang and Wang, 2010). At the Beijing Climate Center, various error selection methods have been operationalized for rainfall prediction, including the raw field-based similar-error selection method, the empirical orthogonal function-based similar-error selection method, the grid-based similar-error selection method, the regional key impact factor-based similar-error selection method, and the abnormal-factor-based similar-error selection method (Feng et al., 2020). These innovative approaches underscore the ongoing efforts to harness both dynamical and statistical insights to achieve more accurate and reliable rainfall predictions.
Research has consistently demonstrated the benefits of integrating predictions from multiple climate models. For instance, the Bayesian model averaging approach (Luo et al., 2007) and the moving-coefficient ensemble approach (Yang et al., 2024) are two such approaches that have shown promise. The use of a multi-model ensemble can mitigate the collective local biases that can occur in space and time and across different variables when using individual models (Krishnamurti et al., 2016). This approach not only assigns higher weights to the outputs of more accurate models but also enhances overall predictive skill and reduces the uncertainty associated with single-model ensembles (Yan and Tang, 2013). By accounting for comprehensive uncertainties stemming from both model discrepancies and initial conditions, multi-model ensembles often outperform single models (Palmer et al., 2004). Furthermore, the diverse assumptions inherent in different model frameworks can potentially compensate for our incomplete understanding of atmospheric dynamics (Yan and Tang, 2013). The multi-model approach has been successfully applied across a broad spectrum of forecasting needs, including medium-range weather forecasting (Candille, 2009) and seasonal climate prediction (Vitart, 2006). Given the aforementioned advantages of dynamic–statistic methods in seasonal predictions, it is imperative to adopt an ensemble approach that combines the predictions from these methods. This integration is crucial for further enhancing prediction accuracy and reliability. By leveraging the collective strengths of various models and techniques, we can achieve a more robust and nuanced understanding of climate patterns, ultimately leading to improved prediction capabilities.
In the process of examining the ensemble prediction, it is crucial to take into account the various factors that can influence its predictive accuracy (Kumar and Krishnamurti, 2012). The ensemble's output is particularly sensitive to several key elements: the number of models incorporated, the duration of the dataset utilized for training, and the distribution of weights for both downscaling and the integration of multiple models or schemes (Krishnamurti et al., 2016). Both grid-based reanalysis data and station-based observational data can serve as the foundation for model training or validation (Ding et al., 2004; Gong et al., 2016; Wang et al., 2015). It is therefore essential to explore and discuss the differential impacts that the use of these two distinct types of datasets may have on ensemble predictions. Furthermore, the dispersion of samples across different models or methodologies cannot be overlooked as this also affects the ensemble's predictive skill and deserves certain attention (Houze et al., 2015).
Based on the above statement, the aim of this research is to construct an unequal-weighted ensemble prediction (UWE) employing a comprehensive array of dynamic–statistic methods and to explore the potential factors that may influence its predictive capabilities. Specifically, the study is designed to delve into three primary areas: (1) elucidating the process of establishing the UWE through a suite of dynamic–statistic methods, highlighting the distinctions between grid-based ensembles and station-based ensembles; (2) examining the most effective methodologies for evaluating the spatial congruence between observational data and the UWE's output; and (3) investigating the connection between the dispersal of samples across various dynamic–statistic methods and the predictive accuracy of the UWE. This study will provide a comprehensive analysis of the UWE's development and its performance, offering valuable insights into the factors that influence its predictive success.
2.1 Data
The monthly precipitation data of 1634 stations for 1983–2020 are from the National Meteorological Information Center of the China Meteorological Administration. The monthly grid precipitation data for 1983–2020 are derived from the combined rainfall analysis (CMAP) data of the US Climate Prediction Center. The model prediction data for summer precipitation in China are hindcast datasets of the BCC_CPSv3. Monthly climate indices during 1983–2020, including circulation indices (i.e. Arctic Oscillation, AO, and Antarctic Oscillation, AAO), SST indices (i.e. Niño 3.4, Niño 4, and Pacific Decadal Oscillation), and snow cover indices (i.e. Tibet snow cover area index and northeastern China snow cover area index), are available from the Beijing Climate Center website (http://cmdp.ncc-cma.net/Monitoring/ cn_index_130.php, last access: 3 September 2024) (Gong et al., 2016).
2.2 Climate region division
Climate in China is influenced by various climate systems, such as monsoons, middle- to high-latitude circulation systems, and westerly jet circulation systems (Ding, 1994; Li et al., 2010; Jie et al., 2017). Since summer rainfall has regional characteristics and potential impact factors, we divide the whole country into eight regions (Feng et al., 2020): southern China (20–25° N, 110–120° E), eastern China (25–35° N, 110–123° E), northern China (35–42.5° N, 110–123° E), northeastern China (42.5–55° N, 110–135° E), eastern northwestern China (35–43° N, 90–110° E), western northwestern China (35–48° N, 75–90° E), the Tibet area (27–35° N, 80–100° E), and southwestern China (22–33° N, 95–110° E). Each region is treated separately by the dynamic–statistic prediction process.
2.3 The dynamic–statistic predictions
The numerical model is an approximation of the behaviour of the actual atmosphere. The dynamic–statistic prediction is employed to utilize the information of historical analogues to estimate the model's prediction errors through the statistical method, thereby compensating for the model deficiencies and reducing the model errors (Huang et al., 1993). As addressed by Feng et al. (2020), the dynamic–statistic prediction can be explained by Eq. (1):
where is the corrected prediction; p(ψ0) is the original model prediction; p(ψj) is the model prediction of the historical year, with similar initial conditions to the current one; and is the corresponding historical observation. Equation (1) is the integral form of the similarity error correction equation, in which the error term of the similar historical prediction is added to the prediction results of the numerical model.
The core idea of the dynamic–statistic prediction is developing the scheme of how to select a similar year and to estimate historical prediction errors (Feng et al., 2013; Gong et al., 2016). Equation (2) transforms the improvement in the dynamical model prediction into the estimation of model error (Feng et al., 2013; Ren and Chou, 2006; Xiong et al., 2011).
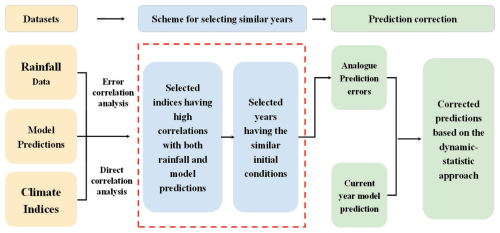
Figure 1The flow chart of the dynamic–statistic prediction method. The key step is the scheme for selecting the historically similar years, which is the step outlined by the dashed red box. The climate indices refer to the 130 monthly climate indices (SST indices, circulation indices, etc.) during 1983–2020 in Sect. 2.1.
2.4 Schemes for the dynamic–statistic prediction
Figure 1 presents the flow chart of the dynamic–statistic prediction method. The key step is the scheme for selecting the historically similar years, which is the step outlined by the dashed red box. Different schemes of selecting similar years from the historical dataset correspond to different dynamic–statistic prediction schemes. In previous years, a series of the dynamic–statistic prediction schemes were developed for selecting similar years from the historical information, and excellent results have been achieved in predicting summer precipitation anomalies in China (Feng et al., 2013; Wang and Fan, 2009; Wang et al., 2015; Xiong et al., 2011).
Six kinds of dynamic–statistic prediction approaches representing different schemes for analogue error selection are introduced as follows:
-
First is the scheme for the original model-prediction-based similar-error selection (ORM). With the dynamical model original prediction, we select 4 historical years that have the most similar features in terms of anomaly distribution for the current year's prediction. Then we calculate the analogue prediction error using these similar years, add to the current prediction, and produce the corrected prediction.
-
Next is the scheme for empirical orthogonal function (EOF) mode-based similar-error selection. This is done by calculating the model prediction error filed and producing the corresponding spatial modes and corresponding principal components using the EOF method. Similar years are selected based on the Euclidean distance of the principal components. Historically similar errors are calculated using the selected similar years and are added to the current model prediction, which then produces the corrected prediction (Gong et al., 2018).
-
Next is the scheme for the regional average precipitation-based similar-error selection (REG). The whole country is divided into eight regions according to the introduction of Sect. 2.2. We select the climate indices that have high correlations with the regional average precipitation of each region. With these highly correlated indices, multiple factors are randomly configured and used to calculate the shortest Euclidean distance to choose the historically similar years and to produce the similar error. Cross-validation is carried out to correct the model prediction error and to obtain the optimal multi-factor configuration. Based on this final optimal multi-predictor configuration, the dynamic–statistic prediction can be implemented (Xiong et al., 2011).
-
Next, we have the scheme for the grid precipitation-based similar-error selection (GRD). The similar-error selection is the same as the REG approach, but the model prediction error correction is carried out for each grid point within a region.
-
Next, we have the scheme for the abnormal-factor-based similar-error selection (ABN). We establish which factors have significant correlations with the regional precipitation, and then we determine the anomaly threshold of each factor and select the key factors reaching that threshold. Based on the selected abnormal factors, similar years are selected by means of the shortest Euclidean distance of the factor set between the current year and historical years. Then the analogue errors can be calculated by using the method of weighted average integration, and these can be added to the current year's model prediction, which can produce the corrected prediction (Feng et al., 2020).
-
Finally, we have the scheme for systematic error selection (SYS). The arithmetic mean of the model prediction errors over the years is calculated, after which it is superimposed onto the model's original prediction results to obtain the systematic-error-revised prediction of the model. This scheme is primarily used for comparison with the other five dynamic–statistic schemes.
The selected similar years are not consistent with each other among these six schemes; the analogue errors usually show similar patterns but also show differences with regard to the details. Besides the dynamic–statistic prediction, the system error correction is also presented for comparison.
2.5 The dynamic–statistic combined ensemble prediction
In order to further improve the effectiveness of summer precipitation predictions by various dynamic–statistic schemes, this study conducted the dynamic–statistic combined ensemble prediction called unequal-weighted ensemble prediction (UWE).
Based on the six dynamic–statistic prediction schemes, the unequal-weighting ensemble prediction (UWE) Em is calculated using Eq. (3):
where Fkm is the single prediction of each dynamic–statistic scheme, and wkm is the weight coefficient of each member. n denotes the total number of dynamic–statistic schemes, and m denotes the current prediction year. wkm can be calculated using Eq. (4). Using a method similar to the cross-check, the temporal correlation coefficient (TCC) was calculated by removing the precipitation predictions of the screened members along with the precipitation actuals for the mth ( year of data.
The weights wkm were calculated for each member at each grid point in the year m, where Tkm is the TCC value calculated for the kth member at that station or grid point after excluding the precipitation data in year m, and wkm (k=1, 2, …, n) is the weight of the kth member at that grid point in year m. The anomaly correlation coefficient (ACC), PS score, and root mean standard error are used for evaluating the prediction skill for summer precipitation in China. The PS score can be calculated using Eq. (5):
where N is the total number of stations; N0 is the number of correctly predicted stations with abnormalities within (−20 %, 20 %); f0 is the weight coefficient of N0; N1 and f1 are for the stations with abnormal within (−50 %, −20 %) or (20 %, 50 %); N2 and f2 are for the stations with abnormal within (−100 %, −50 %) or (50 %, 100 %); and M is the total number of correctly predicted stations with abnormal below −100 % or above 100 %. In this study, we set f0=2, f1=2, and f2=4.
Normally, the spatial average removed ACC (SACC) is calculated by means of Eq. (6) to assess the spatial consistency of predictions for summer precipitation in China (Fan et al., 2012; Xiong et al., 2011):
where n is the total number of stations, xi is the summer precipitation abnormal of observation at station i, while yi is the summer precipitation abnormal of predictions at station i. and are, respectively, the average abnormal of observations and predictions for all the stations. This so-called SACC is needed to subtract the average precipitation anomaly of all stations from the precipitation anomaly of each station before calculating the ACC.
In order to confirm if the SACC can properly estimate the spatial consistency of predictions for summer precipitation, we also calculated the revised anomaly correlation coefficient (RACC) using Eq. (7):
where n is the total number of stations, and and are, respectively, the observed and predicted summer precipitation at station i. and refer to the averages of observations and predictions of summer precipitation for all the years at each station i. The RACC is calculated directly using the precipitation anomalies of each station without removing the average precipitation anomaly of all stations.
Table 1The 10-year average of RACC and PS scores of the summer precipitation prediction from 2011 to 2020 for the dynamic–statistic predictions and system error correction.
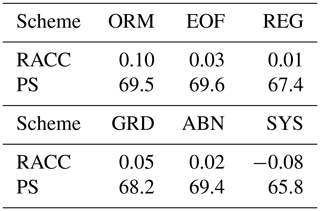
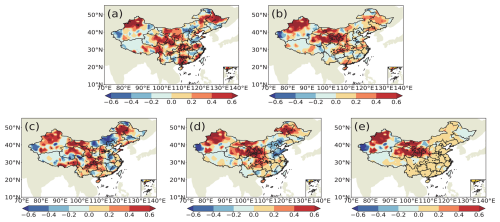
Figure 2The differences in the temporal correlation coefficients for summer precipitation predictions in China from 2011 to 2020. Values indicate differences between the dynamic–statistic method and the SYS method. (a) ORM, (b) EOF, (c) REG, (d) GRD, and (e) ABN.
The RACC and PS scores of the summer precipitation in China produced by the six dynamic–statistic methods are presented in Table 1. The 10-year average of the PS score of the dynamic–statistic methods varied from 67.4 to 69.6, showing better performance compared to the SYS method (65.8). In Fig. 2, the temporal correlation coefficients of the dynamic–statistic methods are higher than those of the SYS method over most China, with the distribution spatial patterns being similar to each other, but the most improved areas varied between the different methods. It has further been confirmed by previous studies that the merging of prediction errors estimated via the statistical method and dynamic model-based original output represents a potential means for improving the prediction skill of summer rainfall in China (Feng et al., 2020).
Based on Eq. (1), four schemes of the UWE prediction using the single dynamic–statistic predictions as ensemble members and their corresponding 1-year-out cross-validations are presented in Table 2. In order to distinguish the performances of the UWE prediction compared to the grid point observations and station observations, both the grid-based ensemble and the station-based ensemble are calculated. Comparing with the single scheme of the dynamic–statistic prediction, the E4 scheme has the best skill among the four ensemble schemes, with the RACC score being 0.9 and the PS score being 70. The grid-based ensemble can somewhat improve the summer precipitation prediction in China, but its effect varied among different schemes. The skills of the station-based ensemble are obviously better than those of the grid-based one, with the RACC score being 0.10–0.11 and the PS score being 69.3–70.2. As addressed by Yan and Tang (2013), the multi-model ensemble approach (MME) considers the structural inadequacy of individual models and can reduce model formulation uncertainties. The reason why the ensemble of multiple dynamic–statistic predictions can improve the summer precipitation in China is similar to that in the case of MME, which can somewhat overcome the shortcomings of a single prediction and produce the more stable prediction.
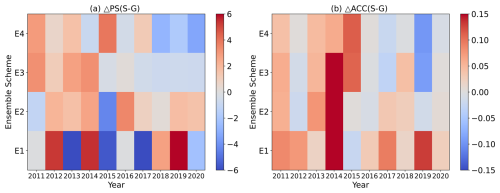
Figure 3Scatter distribution of differences in (a) PS and (b) RACC for summer precipitation prediction during 2011–2020 between station-based and grid-based UWE. Values indicate the differences between the station-based ensemble and the grid-based ensemble.
Figure 3 shows that there is no significant difference between the PS scores of the station-based and grid-based UWE for the E1 scheme. However, for the E2 scheme, the station-based UWE clearly outperforms the grid-based UWE. Additionally, the station-based UWE of the E3 and E4 schemes also has relatively higher PS scores. RACC values of the station-based predictions for all four schemes are generally higher than those for the grid-based UWE. In summary, compared to the grid-based UWE, the station-based one obviously has higher PS scores and RACC values, indicating better prediction performance.
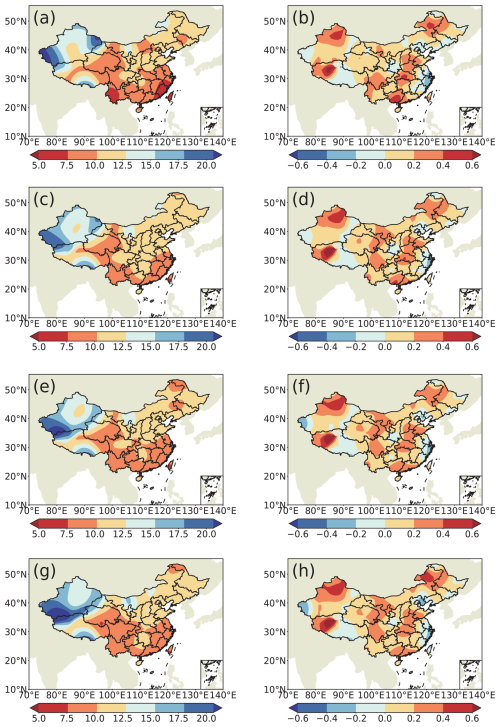
In Fig. 4, the TCC scores of the station-based ensemble for summer precipitation prediction show positive values in most of China, with the high-value centres being distributed in western southern China, central China, southern northern China, western northeastern China, etc. The similar spatial distributions are observed in the predictions of the four station-based ensemble schemes (Fig. 4a, c, e, g). The TCC differences between the station-based ensemble and the grid-based ensemble indicate that the former has higher values than the latter in most areas of China, except for part of central China and eastern China (Fig. 4b, d, f, h). The spatial distribution of TCC indicates that the improvement in the station-based ensemble is suitable for most stations in China and implies that this approach can bring the summer precipitation prediction closer to the observation. Bueh et al. (2008) also addressed the fact that the training phase of the multi-model ensemble learns from the recent past performances of models and is used to determine statistical weights from a least square minimization via a simple multiple regression. During the training process, more precise objective data can produce better weight coefficients and lead to more accurate ensemble results, which might be the reason for the station-based ensemble producing better predictions of summer precipitation in China than the grid-based one.
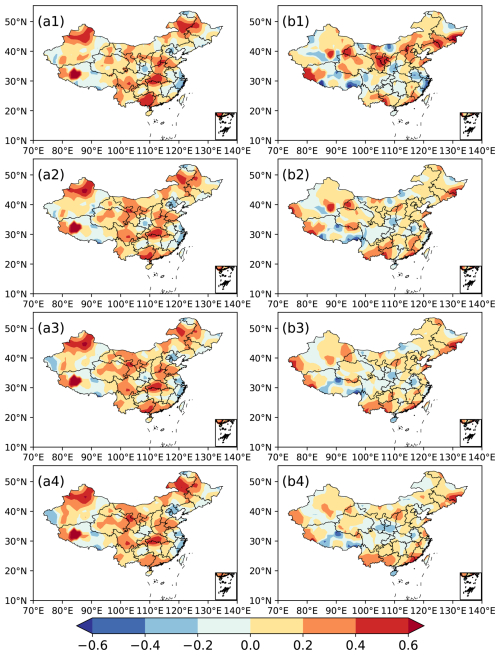
Figure 4Spatial distribution of TCC scores of station-based UWE for summer precipitation in China during 2011–2020 (a1–a4) and TCC differences between the station-based ensemble and the grid-based ensemble (b1–b4). (a1, b1) Ensemble scheme E1, (a2, b3) ensemble scheme E2, (a3, b3) ensemble scheme E3, (a4, b4) ensemble scheme E4.
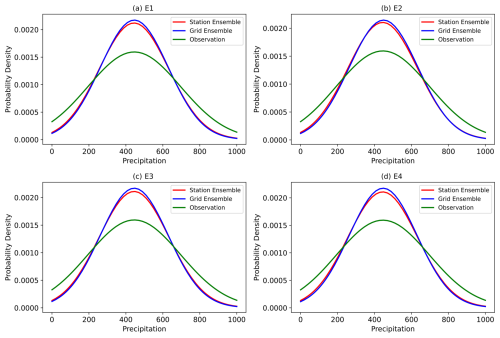
Figure 5Probability density distribution of the total precipitation for observations and the UWE. (a) Ensemble scheme E1, (b) Ensemble scheme E2, (c) Ensemble scheme E3, (d) Ensemble scheme E4.
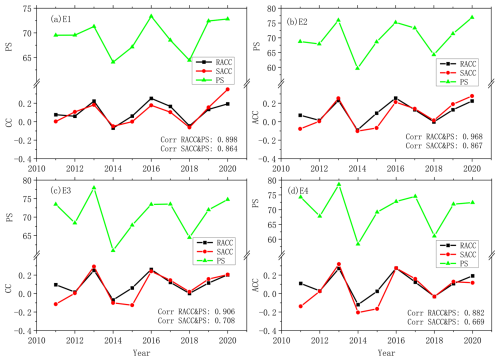
Figure 6Annual RACC, SACC, and PS of station-based ensemble predictions for summer precipitation in China. Prediction of (a) E1, (b) E2, (c) E3, and (d) E4.
Figure 5 indicates that the probability density distribution of station-based ensemble predictions is closer to the observations, especially at the peak part, than that of the grid-based ensemble, and this feature is observed in four ensemble predictions. If the on-site observation dataset can be used for training, we may have a parameterization scheme containing precise information for each single station, which may be of help in producing the prediction to be close to the real situation of summer precipitation in China. Since the grid-based dataset is normally made up of the reproduced observation data, it may lose certain precise information, especially for extreme values. This flaw in the grid data may cause poor performance in terms of improving the prediction accuracy compared to the station data (Kim et al., 2012; Xiong et al., 2011; Yang et al., 2024).
The station-based and grid-based UWE values, as well as the actual precipitation data, all exhibit characteristics of a normal distribution in Fig. 5 instead of the typical skewed distribution. This is primarily because this study focuses on summer precipitation over the entire China region, which covers a large area and spans a long period, rather than the precipitation in a single grid or at a single station in a short period. Within this range, various types of precipitation events, including light, moderate, and heavy rain, make the probability distribution closer to the normal distribution. Besides this, in Fig. 5, the probability distribution is calculated based on the monthly anomaly precipitation and after treatment with the probability function of the Python probability function, which smoothes the distribution curve. Therefore, the final probability distribution appears to be a normal distribution.
In Fig. 6, the SACCs and RACCs are not consistent with each other, and the former are more frequently lower than the latter. The 10-year average values of SACC for each ensemble prediction for summer precipitation in China are also lower than those of the RACC (Table 3). The SACC is calculated after subtracting the spatial average of anomalies for all the stations from the original precipitation anomaly. This approach may cause the new value for each station to be unable to reflect the real situation and could lead to a decrease in RACC between the predictions and observations. In Fig. 7, the correlations between the RACC and PS are all higher than those between the SACC and PS, which further indicates that RACC can better assess the prediction skill of summer precipitation. It is also noted that the differences between the SACC and RACC are quite obvious in 2011 and 2015 for ensemble schemes E2, E3, and E4 (Fig. 6b, c, d). Comparing with the PS scores, it seems that the RACC scores for each prediction have more consistent features than those of the SACC. In order to figure out if the RACC has better performance compared to the SACC in terms of indicating the spatial consistency of precipitation prediction, the observations and predictions of summer precipitation in 2011 and 2015 are presented in Fig. 7. Comparing with the observations (Fig. 7a5), predicted precipitation anomalies in summer 2011 show consistent features in most of China (Fig. 7a1–a4). The PS scores of the four ensemble schemes are 69.5, 68.7, 73.5, and 74.3, and the RACC scores are 0.08, 0.07, 0.10, and 0.11, which properly indicate the prediction skill of these four schemes with regard to the summer precipitation in 2011. It is also noted that the SACCs of the 2011 predictions are 0.01, −0.08, −0.11, and −0.14, which obviously show flaws in terms of assessing the performance of these four schemes in predicting the precipitation. This shortcoming of the SACC is also exhibited in the prediction of summer precipitation anomalies in 2015 (Fig. 7b1–b5), owing to improperly low SACC values of 0.01, −0.07, −0.13, and −0.17.
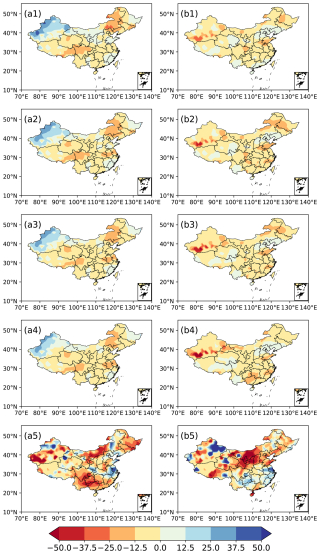
Figure 7The spatial distribution of anomalies (unit: %) in observations and predictions of summer precipitation in 2011 and 2015. (a1–a4) Predictions of schemes E1–E4 and (a5) observations for 2011; (b1–b4) prediction of schemes E1–E4 and (b5) observations for 2015.
Table 3The 10-year average of the RACC and SACC scores of station-based ensemble predictions for summer precipitation in China during 2011–2020.

The dispersal intensity (Di), also called the coefficient of variation, is a variable measure of the differences among single samples and can be calculated with Eq. (8). The dispersal intensity is also a relative measure of variability that indicates the size of a standard deviation in relation to its mean. It is a standardized, unitless measure that allows one to compare variability between disparate groups and characteristics (Tyralis and Papacharalampous, 2024).
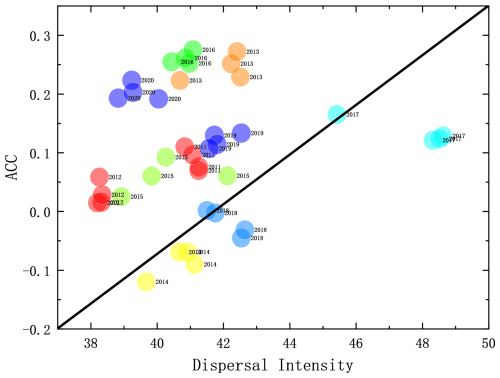
Since the dispersal intensity of each statistic–dynamic prediction has obvious interannual variations, it is necessary to analyse its probable impact on the ensemble prediction of summer prediction in China. Figure 8 presents the relationship between the ACC and dispersal intensity of summer precipitation predictions, in which high ACC scores of summer precipitation predictions mostly correspond to the low dispersal intensity among statistic–dynamic predictions. The variabilities in the signal and noise for the ensemble prediction can be measured as the variance of the ensemble mean and ensemble spread of all the initial conditions (Liu et al., 2019; Zheng et al., 2009); with regard to the sampling error in measuring the signal variance, the more reasonable estimation of the signal variance can be given and used to measure the overall potential predictability of the prediction system (DelSole, 2004; DelSole and Tippett, 2007). The UWE follows a similar theory to the ensemble prediction: the low dispersal intensity among ensemble samples implies that the historically similar errors selected by different approaches are quite close to each other, which makes the correction of the model prediction more trustworthy and, hence, produces a more accurate prediction than those cases with high dispersal intensity.
In Fig. 9, the 10-year averages of the dispersal intensity of each UME scheme show similar patterns compared to the spatial distribution of TCC scores of summer prediction produced by UME. Except for part of northwestern China and middle eastern China, the low dispersal intensity also tends to produce high TCC scores of statistic–dynamic combined ensemble predictions in most of China. In the middle region of China, the negative correlation between the dispersal intensity and TCC is not so evident. This could be due to the limitations of the parameterization schemes in the forecasting models for this region, which may result in inaccurate simulations of the diffusion process. Additionally, the diversity of meteorological conditions in the middle region could lead to inconsistencies in the relationship between dispersal intensity and TCC across different areas. For instance, the middle region may be influenced by specific meteorological systems, such as frontal systems and cyclones, which can affect the relationship between dispersal intensity and TCC. Therefore, a positive relationship between the dispersal intensity and the ACC can be found in this study; however, this kind of relationship has uncertainty in different areas, which still needs to be considered in the operational predictions. These aspects require further detailed investigation. In conclusion, the low dispersal intensity among the single predictions corresponds to the major physical processes captured by each prediction scheme being similar to each other, which is of help in the more reasonable estimation of the signal variance and produces better precipitation predictions.
This study presents the UWE scores of the dynamic–statistic schemes in order to enhance summer precipitation prediction in China. The analysis also includes an examination of factors that may impact the prediction skill of the UWE, such as grid-based and station-based prediction, the calculation of prediction skill, and the influence of sample dispersion on prediction accuracy.
The UWE's performance surpasses the model and the dynamic–statistic scheme predictions, potentially due to its ability to overcome individual model or scheme inadequacies, reduce formulation uncertainties, and yield more stable and accurate predictions. The average RACC and PS values for the six dynamic–statistic schemes that were ensemble members are 0.02–0.10 and 67.4–69.6. In contrast, the grid-based ensemble prediction of the UWE becomes 0.04–0.09 and 69.2–70.9, which is an improvement compared to the dynamic–statistic schemes. Station-based ensemble prediction shows superior performance for this compared to grid-based ensemble prediction and dynamic–statistic methods, achieving average RACC values of 0.10–0.11 and average PS values of 69.3–70.7.
The average RACC and PS values for the station-based ensemble prediction fluctuated between 0.10–0.11 and 69.3–70.2 from 2011 to 2020, indicating significantly higher proficiency compared to the grid-based ensemble prediction. The ensemble prediction based on station data can produce precipitation with a probability density distribution function that is closer to the observed data compared to the grid-based prediction, making the former more accurate. The use of the SACC needs to remove the spatial average of the entirety of the stations from the original value, which may produce inaccurate station values and lead to a lower correlation between predictions and observations. This makes SACC unsuitable for estimating the spatial consistency of summer precipitation predictions. The commonly used SACC should be supplanted by the updated RACC, which is computed by directly utilizing the precipitation anomalies at each station without the need to deduct the overall average precipitation anomaly from all stations.
Moreover, the higher RACCs in summer precipitation prediction are predominantly associated with lower dispersal intensity among the dynamic–statistic predictions. This indicates that a more concentrated ensemble, where predictions are closely aligned, tends to result in more accurate forecasts. Accordingly, the dispersal intensity of ensemble samples is a crucial factor affecting the prediction accuracy of the dynamic–statistic combined UWE. The UWE shares a similar theoretical foundation with ensemble prediction. Low dispersal intensity among ensemble samples suggests that the historically similar errors identified by various methods are closely aligned. This alignment enhances the reliability of corrections applied to model predictions, thereby yielding more accurate forecasts compared to cases with high dispersal intensities.
The datasets generated and/or analysed during the current study are available from the corresponding author upon reasonable request. The BCC_CPSv3 data were provided by the Beijing Climate Center (http://cmdp.ncc-cma.net/Monitoring/cn_index_130.php, Beijing Climate Center, 2024). The CMAP data were provided by the US Climate Prediction Center (https://www.cpc.ncep.noaa.gov/, CMAP, 2024). The monthly precipitation data were provided by the National Meteorological Information Center (https://data.cma.cn/, National Meteorological Information Center, 2024).
The programming environment used in this study is Jupyter Notebook, which supports Python 3.9.7. Jupyter Notebook was installed using Anaconda, a popular Python distribution that includes a wide range of scientific packages. Anaconda can be downloaded from the official Anaconda website: https://www.anaconda.com/ (Anaconda, Inc., 2024). Detailed installation instructions are available in the Anaconda documentation.
The conception of this study was the responsibility of XW and GF. Material preparation, data collection, and analysis were performed by XW and ZY. The paper was written by XW and revised by QL. All the authors commented on previous versions of the paper. All the authors have read and approved the final paper.
The contact author has declared that none of the authors has any competing interests.
The funding sponsors have not participated in the execution of the experiment, the decision to publish the results, or the writing of the paper.
Publisher's note: Copernicus Publications remains neutral with regard to jurisdictional claims made in the text, published maps, institutional affiliations, or any other geographical representation in this paper. While Copernicus Publications makes every effort to include appropriate place names, the final responsibility lies with the authors. Regarding the maps used in this paper, please note that Figs. 2, 4, 7, and 9 contain disputed territories.
This article is part of the special issue “Emerging predictability, prediction, and early-warning approaches in climate science”. It is not associated with a conference.
This work is supported by the National Natural Science Foundation of China (grant nos. 42130610, 42075057, and 42275050), the National Key Research and Development Program of China (grant no. 2022YFE0136000), and the Sixteenth Graduate Student Research and Innovation Program of Yunnan University (grant no. KC-242410028).
This research has been supported by the National Natural Science Foundation of China Project (grant nos. 42130610, 42075057, and 42275050), the National Key Research and Development Programme of China (grant no. 2022YFE0136000), and the Sixteenth Graduate Student Research and Innovation Programme of Yunnan University (grant no. KC-242410028).
This paper was edited by Wenping He and reviewed by Shiquan Wan and one anonymous referee.
Anaconda, Inc.: Jupyter Notebook, Python 3.9.7, Anaconda, Inc. [code], https://www.anaconda.com/ (last access: 3 September 2024), 2024.
Beijing Climate Center: BCC_CPSv3. CMDP Monitoring, Beijing Climate Center [data set], http://cmdp.ncc-cma.net/Monitoring/cn_index_130.php (last access: 3 September 2024), 2024.
Bueh, C., Shi, N., Ji, L., Wei, J., and Tao, S.: Features of the EAP events on the medium-range evolution process and the mid- and high-latitude Rossby wave activities during the Meiyu period, Chin. Sci. Bull., 53, 610–623, https://doi.org/10.1007/s11434-008-0005-2, 2008.
CMAP: The combined rainfall analysis data, The US Climate Prediction Center [data set], https://www.cpc.ncep.noaa.gov/ (last access: 3 September 2024), 2024.
Candille, G.: The multiensemble approach: The NAEFS example, Mon. Weather Rev., 137, 1655–1665, https://doi.org/10.1175/2008MWR2682.1, 2009.
Chou, J.: A problem of using past data in numerical weather forecasting, Sci. China Ser A., 6, 108–119, 1974 (in Chinese).
DelSole, T.: Predictability and information theory. Part I: measures of predictability, J. Atmos. Sci., 61, 2425–2440, https://doi.org/10.1175/1520-0469(2004)061<2425:PAITPI>2.0.CO;2, 2004.
DelSole, T. and Tippett, M. K.: Predictability: recent insights from information theory, Rev. Geophys., 45, RG4002, https://doi.org/10.1029/2006RG000202, 2007.
Ding, R. and Seo, K. H.: Predictability of the Madden-Julian Oscillation Estimated Using Observational Data, Mon. Weather Rev., 138, 1004–1013, https://doi.org/10.1175/2009MWR3082.1, 2010.
Ding, Y.: Monsoons over China, Adv. Atmos. Sci., 11, 252, https://doi.org/10.1007/BF02666553, 1994.
Ding, Y., Li, Q., Li, W., Luo, Y., Zhang, P., Zhang, Z., Shi, X., Liu, Y., and Wang, L.: Advance in Seasonal Dynamical Prediction Operation in China, Acta Meteorol Sin., 30, 598–612, https://doi.org/10.11676/qxxb2004.059, 2004.
Fan, K., Liu, Y., and Chen, H.: Improving the Prediction of the East Asian Summer Monsoon: New Approaches, Weather Forecast., 27, 1017–1030, https://doi.org/10.1175/WAF-D-11-00092.1, 2012.
Feng, G., Zhao, J., Zhi, R., and Gong, Z.: Recent progress on the objective and quantifiable forecast of summer precipitation based on dynamical statistical method, J. Appl. Meteor. Sci., 24, 656–665, 2013 (in Chinese).
Feng, G., Yang, J., Zhi, R., Zhao, J., Gong, Z., Zheng, Z., Xiong, K., Qiao, S., Yan, Z., Wu, Y., and Sun, G.: Improved prediction model for flood-season rainfall based on a nonlinear dynamics-statistic combined method, Chaos Soliton Fract., 140, 110-160, https://doi.org/10.1016/j.chaos.2020.110160, 2020.
Gettelman, A., Geer, A. J., Forbes, R. M., Carmichael, G. R., Feingold, G., Posselt, D. J., Stephens, G. L., Heever, S. C. V. D., Varble, A. C., and Zuidema., P.: The future of Earth system prediction: Advances in model-data fusion, Sci. Adv., 8, eabn3488, https://doi.org/10.1126/sciadv.abn3488, 2022.
Gong, Z., Hutin, C., and Feng, G.: Methods for Improving the Prediction Skill of Summer Precipitation over East Asia–West Pacific, Weather Forecast., 31, 1381–1392, https://doi.org/10.1175/WAF-D-16-0007.1, 2016.
Gong, Z., Dogar, M. M. A., Qiao, S., Hu, P., and Feng, G.: Limitations of BCC_CSM's ability to predict summer precipitation over East Asia and the Northwestern Pacific, Atmos. Res., 193, 184–191, https://doi.org/10.1016/j.atmosres.2017.04.016, 2017.
Gong, Z., Muhammad, D., Qiao, S., Hu, P., and Feng, G.: Assessment and Correction of BCC_CSM's Performance in Capturing Leading Modes of Summer Precipitation over North Asia, Int. J. Climatol., 38, 2201–2214, https://doi.org/10.1002/joc.5327, 2018.
Houze, R. A., Rasmussen, J. K. L., Zuluaga, M. D., and Brodzik, S. R.: The variable nature of convection in the tropics and subtropics: A legacy of 16 years of the Tropical Rainfall Measuring Mission satellite, Rev. Geophys., 53, 994–1021, https://doi.org/10.1002/2015RG000488, 2015.
Huang, G.: An Index Measuring the Interannual Variation of the East Asian Summer Monsoon – The EAP Index, Adv. Atmos. Sci., 21, 41–52, https://doi.org/10.1007/BF02915679, 2004.
Huang, J., Yi, Y., Wang, S., and Chou, J.: An analogue-dynamical long-range numerical weather prediction system incorporating historical evolution, Q. J. Roy. Meteor. Soc., 119, 547–565, https://doi.org/10.1002/qj.49711951111, 1993.
Huang, R. and Li, W.: Influence of heat source anomaly over the western tropical Pacific on the subtropical high over East Asia and its physical mechanism, Chinese Journal of Atmospheric Sciences, 12, 107–116, https://doi.org/10.3878/j.issn.1006-9895.1988.t1.08, 1988.
Jie, W., Vitart, F., Wu, T., and Liu, X.: Simulations of the Asian summer monsoon in the sub-seasonal to seasonal prediction project (S2S) database, Q. J. Roy. Meteor. Soc., 143, 2282–2295, https://doi.org/10.1002/qj.3085, 2017.
Kim, H.-M., Webster, P. J., and Curry, J. A.: Seasonal prediction skill of ECMWF System 4 and NCEP CFSv2 retrospective forecast for the Northern Hemisphere Winter, Clim. Dynam., 39, 2957–2973, https://doi.org/10.1007/s00382-012-1364-6, 2012.
Krishnamurti, T. N., Kumar, V., Simon, A., Bhardwaj, A., Ghosh, T., and Ross, R.: A review of multimodel superensemble forecasting for weather, seasonal climate, and hurricanes, Rev. Geophys., 54, 336–377, https://doi.org/10.1002/2015rg000513, 2016.
Kumar, V. and Krishnamurti, T. N.: Improved seasonal precipitation forecasts for the Asian Monsoon using a large suite of atmosphere ocean coupled models: Anomaly, J. Climate, 25, 65–88, https://doi.org/10.1175/2011JCLI4125.1, 2012.
Lang, X. and Wang, H.: Improving Extraseasonal Summer Rainfall Prediction by Merging Information from GCMs and Observations, Weather Forecast., 25, 1263–1274, https://doi.org/10.1175/2010waf2222342.1, 2010.
Li, H., Dai, A., Zhou, T., and Lu, J.: Responses of East Asian summer monsoon to historical SST and atmospheric forcing during 1950–2000, Clim. Dynam., 34, 501–514, https://doi.org/10.1007/s00382-008-0482-7, 2010.
Li, J. and Ding, R.: Temporal-Spatial Distribution of Atmospheric Predictability Limit by Local Dynamical Analogs, Mon. Weather Rev., 139, 3265–3283, https://doi.org/10.1175/MWR-D-10-05020.1, 2011.
Li, X., Ding, R., and Li, J.: Quantitative Comparison of Predictabilities of Warm and Cold Events Using the Backward Nonlinear Local Lyapunov Exponent Method, Adv. Atmos. Sci., 37, 951–958, https://doi.org/10.1007/s00376-020-2100-5, 2020a.
Li, X., Ding, R., and Li, j.: Quantitative study of the relative effects of initial condition and model uncertainties on local predictability in a nonlinear dynamical system, Chaos Soliton Fract., 139, 110094, https://doi.org/10.1016/j.chaos.2020.110094, 2020b.
Liu, T., Tang, Y., Yang, D., Cheng, Y., Song, X., Hou, Z., Shen, Z., Gao, Y., Wu, Y., Li, X., and Zhang, B.: The relationship among probabilistic, deterministic and potential skills in predicting the ENSO for the past 161 years, Clim. Dynam., 53, 6947–6960, https://doi.org/10.1007/s00382-019-04967-y, 2019.
Lu, R. Y.: Interannual variation of North China rainfall in rainy season and SSTs in the equatorial eastern Pacific, Chin. Sci. Bull., 50, 2069–2073, https://doi.org/10.1360/04wd0271, 2005.
Luo, L., Wood, E. F., and Pan, M.: Bayesian merging of multiple climate model forecasts for seasonal hydrological predictions, J. Geophys. Res.-Atmos., 112, D10102, https://doi.org/10.1029/2006JD007655, 2007.
National Meteorological Information Center: The monthly precipitation data, National Meteorological Information Center [data set], https://data.cma.cn/ (last access: 3 September 2024), 2024.
Palmer, T. N., Alessandri, A., Andersen, U., Cantelaube, P., Davey, M., Délécluse, P., Déqué M, D. E., Doblas-Reyes, F. J., Feddersen, H., Graham, R., Gualdi, S., Guérémy, J. F., Hagedorn, R., Hoshen, M., Keenlyside, N., LatifM, L. A., Maisonnave, E., Marletto, V., Morse, A. P., Orfila, B., Rogel, P., Terres, J.-M., and Thomson, M. C.: Development of a European multimodel ensemble system for seasonal-to-interannual prediction (DEMETER), B. Am. Meteorol. Soc., 85, 853–872, https://doi.org/10.1175/BAMS-85-6-853, 2004.
Ren, H. L. and Chou, J. F.: Introducing the updating ofmulti reference states into dynamical analogue prediction, Acta Meteorol. Sin., 64, 315–324, https://doi.org/10.1016/S1872-2032(06)60022-X, 2006.
Ren, H. L. and Chou, J. F.: Strategy and methodology ofdynamical analogue prediction, Sci. China D, 50, 1589–1599, https://doi.org/10.1007/s11430-007-0109-6, 2007.
Roberts, M. J., Hewitt, H. T., Hyder, P., Ferreira, D., Josey, S. A., Mizielinski, M., and Shelly, A.: Impact of ocean resolution on coupled air-sea fluxes and large-scale climate, Geophys. Res. Lett., 43, 10430–10438, https://doi.org/10.1002/2016GL070559, 2016.
Satoh, M., Tomita, H., Yashiro, H., Miura, H., Kodama, C., Seiki, T., Noda, A. T., Yamada, Y., Goto, D., and Sawada, M.: The non-hydrostatic icosahedral atmospheric model: Description and development, Prog. Earth Planet. Sci., 1, 1–32, https://doi.org/10.1186/s40645-014-0018-1, 2014.
Si, D. and Ding, Y.: Decadal Change in the Correlation Pattern between the Tibetan Plateau Winter Snow and the East Asian Summer Precipitation during 1979–2011, J. Climate, 26, 7622–7634, https://doi.org/10.1175/JCLI-D-12-00587.1, 2013.
Specq, D. and Batté, L.: Improving subseasonal precipitation forecasts through a statistical–dynamical approach: application to the southwest tropical Pacific, Clim. Dynam., 55, 1913–1927, https://doi.org/10.1007/s00382-020-05355-7, 2020.
Sun, L., Yang, X.-Q., Tao, L., Fang, J., and Sun, X.: Changing Impact of ENSO Events on the Following Summer Rainfall in Eastern China since the 1950s, J. Climate, 34, 8105–8123, https://doi.org/10.1175/JCLI-D-21-0018.1, 2021.
Tao, S. and Wei, J.: The Westward,Northward Advance of the Subtropical High over the West Pacific in Summer, J. Appl. Meteor. Sci., 17, 513–525, 2006 (in Chinese).
Tyralis, H. and Papacharalampous, G.: A review of predictive uncertainty estimation with machine learning, Artif. Intell. Rev., 57, 94, https://doi.org/10.1007/s10462-023-10698-8, 2024.
Vitart, F.: Seasonal forecasting of tropical storm frequency using a multi-model ensemble, Q. J. Roy. Meteor. Soc., 132, 647–666, https://doi.org/10.1256/qj.05.65, 2006.
Wang, H. and Fan, K.: A New Scheme for Improving the Seasonal Prediction of Summer Precipitation Anomalies, Weather Forecast., 24, 548–554, https://doi.org/10.1175/2008WAF2222171.1, 2009.
Wang, H., Fan, K., Sun, J., Li, S., Lin, Z., Zhou, G., Chen, L., Lang, X., Li, F., Zhu, Y., Chen, H., and Zheng, F.: A review of seasonal climate prediction research in China, Adv. Atmos. Sci., 32, 149–168, https://doi.org/10.1007/s00376-014-0016-7, 2015.
Wang, Q. J., Schepen, A., and Robertson, D. E.: Merging Seasonal Rainfall Forecasts from Multiple Statistical Models through Bayesian Model Averaging, J. Climate, 25, 5524–5537, https://doi.org/10.1175/jcli-d-11-00386.1, 2012.
Wu, T., Yu, R., Lu, Y., Jie, W., Fang, Y., Zhang, J., Zhang, L., Xin, X., Li, L., Wang, Z., Liu, Y., Zhang, F., Wu, F., Chu, M., Li, J., Li, W., Zhang, Y., Shi, X., Zhou, W., Yao, J., Liu, X., Zhao, H., Yan, J., Wei, M., Xue, W., Huang, A., Zhang, Y., Zhang, Y., Shu, Q., and Hu, A.: BCC-CSM2-HR: a high-resolution version of the Beijing Climate Center Climate System Model, Geosci. Model Dev., 14, 2977–3006, https://doi.org/10.5194/gmd-14-2977-2021, 2021.
Xiong, K., Feng, G., Huang, J., and Chou, J.: Analogue-dynamical prediction of monsoon precipitation in Northeast China based on dynamic and optimal configuration of multiple predictors, Acta. Meteor. Sin., 25, 316–326, https://doi.org/10.1007/s13351-011-0307-1, 2011.
Yan, X. and Tang, Y.: An analysis of multi-model ensembles for seasonal climate predictions, Q. J. Roy. Meteor. Soc., 139, 1179–1198, https://doi.org/10.1002/qj.2020, 2013.
Yang, J., Zhao, J., Zheng, Z., Xiong, K. G., and Shen, B.: Estimating the Prediction Errors of Dynamical Climate Model on the Basis of Prophase Key Factors in North China, Chin. J. Atmos. Sci., 36, 11–22, https://doi.org/10.3878/j.issn.1006-9895.2012.01.02, 2012.
Yang, Z., Bai, H., Tuo, Y., Yang, J., Gong, Z., Wu, Y., and Feng, G.: Analysis on the station-based and grid- based integration for dynamic-statistic combined predictions, Theor. Appl. Climatol., 155, 5169–5184, https://doi.org/10.1007/s00704-024-04935-5, 2024.
Zheng, F., Wang, H., and Zhu, J.: ENSO ensemble prediction: Initial error perturbations vs. model error perturbations, Chin. Sci. Bull., 54, 2516–2523, https://doi.org/10.1007/s11434-009-0179-2, 2009.
Zhu, J. and Shukla, J.: The Role of Air–Sea Coupling in Seasonal Prediction of Asia–Pacific Summer Monsoon Rainfall, J. Climate, 26, 5689–5697, https://doi.org/10.1175/JCLI-D-13-00190.1, 2013.
- Abstract
- Introduction
- Data and method
- The summer precipitation prediction using the dynamic–statistic scheme
- Calculating the spatial similarity of ensemble prediction
- Impact of dispersal intensity on the ensemble prediction
- Conclusions and discussion
- Code and data availability
- Author contributions
- Competing interests
- Disclaimer
- Special issue statement
- Acknowledgements
- Financial support
- Review statement
- References


