the Creative Commons Attribution 4.0 License.
the Creative Commons Attribution 4.0 License.
 | 15 Jun 2023
Exploring meteorological droughts' spatial patterns across Europe through complex network theory
Domenico Giaquinto
Warner Marzocchi
Jürgen Kurths
In this paper we investigate the spatial patterns and features of meteorological droughts in Europe using concepts and methods derived from complex network theory. Using event synchronization analysis, we uncover robust meteorological drought continental networks based on the co-occurrence of these events at different locations within a season from 1981 to 2020 and compare the results for four accumulation periods of rainfall. Each continental network is then further examined to unveil regional clusters which are characterized in terms of droughts' geographical propagation and source–sink systems. While introducing new methodologies in general climate network reconstruction from raw data, our approach brings out key aspects concerning drought spatial dynamics, which could potentially support droughts' forecast.
- Article
(6802 KB) - Full-text XML
- BibTeX
- EndNote


Droughts are among the most severe climate extremes, negatively affecting environments as well as societies and economies (Taufik et al., 2017; Feng et al., 2021; Doughty et al., 2015; Walthall et al., 2013). As reported by the World Meteorological Organization (WMO, 2021), they were one of the most impactful natural hazard in terms of human losses during the period 1979–2019, accounting for 34 % of disaster-related deaths. To make matters worse, droughts are expected to grow and become more severe in the near future due to human-related climate change (Spinoni et al., 2021). Additionally, although different drought types respond differently to increasing greenhouse gas concentrations and distinctions among geographic regions should be made, there is high confidence that water stress is increasing globally according to the Sixth Assessment Report of the Intergovernmental Panel on Climate Change (IPCC) (Wehner et al., 2021).
Despite the high scientific interest and effort towards a better understanding of this crucial topic, there are still substantial discrepancies concerning the assessment of droughts' trends for specific regions. As for Europe, significant impacts have been extensively reported over the years, e.g., on ecosystems (Bastos et al., 2020), economy (Naumann et al., 2021), and agriculture (Beillouin et al., 2020). This climate phenomenon is closely monitored and studied both under present and future climate conditions (Spinoni et al., 2016; Marinho Ferreira Barbosa et al., 2021). When it comes to future scenarios, some studies claim that the entire continent will suffer under the increase of droughts' frequency and severity (Spinoni et al., 2018; Cook et al., 2020). Others are more cautious in drawing such a conclusion, pointing to the critical role of internal climate variability and associated uncertainties (Zhao and Dai, 2017; Vicente-Serrano et al., 2021). There are multiple reasons for these incongruences.
First of all, droughts are characterized by ample spatial variability (Vicente-Serrano et al., 2021): subcontinental or sometimes even subnational areas behave discordantly than their neighbors, and different studies place emphasis on different territories (Spinoni et al., 2016; Vicente-Serrano et al., 2021; Spinoni et al., 2018; Böhnisch et al., 2021). In addition, we lack a unique and standardized definition of regions: each scientific team outlines the subcontinental area of interest discretionally, following political or economic boundaries, according to the obtained results, or using external classifications (Spinoni et al., 2016, 2018, 2015). Although they are completely understandable procedures, they make comparisons among studies difficult, if not unfeasible.
On top of that, there is not a unique definition of drought. Depending on causes and impacts, droughts are classified into different types, i.e., meteorological, agricultural, hydrological, and economic (Wilhite and Glantz, 1985; Seneviratne et al., 2012). These typologies are characterized by an increasing level of complexity, with impacts ranging from atmosphere to land, ecosystems, and even social and economic systems: an absolute definition could result in a misleading oversimplification (Lloyd-Hughes, 2014). Numerous indices have been proposed to classify, monitor, and assess this complex climate event (Wei et al., 2021). Some are defined in terms of anomalies of a single variable, while, for the most complicated cases, multiple atmospheric variables are taken into account (Marinho Ferreira Barbosa et al., 2021). Each of them has its strengths and limitations (Mishra and Singh, 2010; Zargar et al., 2011; Wei et al., 2021; Mukherjee et al., 2018), behaving differently when it comes to projections of future climate scenarios (Böhnisch et al., 2021; Vicente-Serrano et al., 2021). Using a hydrological and water-use model, Naumann et al. (2021) conclude that hydrological droughts' damage in Europe could strongly increase with global warming and cause a regional imbalance in future impacts. On the other hand, Vicente-Serrano et al. (2021) show that trends of meteorological droughts over western Europe are statistically non-significant from a long-term perspective.
Finally, the reference period used to identify the anomalies of the drought variable of interest, be it precipitation, soil humidity, or streamflow, etc., represents another important source of inhomogeneity between different studies (Spinoni et al., 2017). Just as an example, Vicente-Serrano et al. (2021) use the period 1871–2018 to compute the Standardized Precipitation Index (McKee et al., 1993), while Spinoni et al. (2018) choose 1981–2010 to compute the frequency of drought events.
In this study we focus on meteorological droughts, defined as a period with a precipitation deficit in relation to the long-term average condition for a given region. Being simply related to precipitation, meteorological droughts are the basis for every other drought class. A lack of precipitation may be the first precursor of soil humidity's reduction (agricultural drought) as well as the cause of streamflow shortage (hydrological drought) (Bevacqua et al., 2021).
The approach we propose in this study is based on complex networks, and it is designed to address some of the criticalities described before, while detecting unknown spatial features of European meteorological droughts. Complex networks have been applied for many different purposes, e.g., to study social dynamics, power grids, and epidemics. They are a powerful tool in systems composed of many units, where the interactions' structure is closely linked to system's dynamics (Boccaletti et al., 2006). Over the last 2 decades, complex network theory has been successfully applied to climate science too, proving to be an efficient method both to deepen our general understanding of various complex climate processes and to predict the occurrence of extremes (Boers et al., 2019; Tsonis et al., 2006; Ludescher et al., 2021). Complex networks have been applied to droughts too. Ciemer et al. (2020) developed a forecasting scheme to predict the occurrence of meteorological droughts in the Central Amazon basin. In their recent paper, Konapala et al. (2022) develop a method to assess droughts' propagation in North America.
Our main objective here is to uncover spatial features of meteorological droughts in Europe, highlighting underlying mechanisms and patterns which could potentially support drought's forecast in the future. We aim at distinguishing regions in Europe whose main feature lies in drought occurrence and propagation's coherence. Identifying such territories could be of a great importance to further investigate this phenomenon within those areas where its characteristics are homogeneous. Indeed, droughts display a high spatial and temporal variability, and it is thus fundamental to study their evolution accounting for these irregularities to possibly lower uncertainties. Furthermore, with our model we are able to describe the average historical patterns in droughts' evolution which could be a starting point for future climate studies to identify the spatial tracks that are followed by this climate hazard, building a forecasting scheme.
Our study is based on climate complex networks and on the concept of event synchronization (ES), a nonlinear statistical similarity method useful to determine the correlations among spatial locations in terms of event co-occurrences. Using these tools we are able to identify drought regions in Europe based on the process itself and not depending on any external classifications, bringing out key aspects concerning drought dynamics at a regional scale for different rainfall accumulation periods from 1981 to 2020, while introducing new methodologies in general climate networks reconstruction from raw data. The understanding and ability of describing droughts as a complex phenomenon is still in a preliminary stage, but climate complex networks prove to be a powerful tool to reveal hidden features of this climatic process.
The remainder of the paper is organized as follows: in Sect. 2 we describe the data and the methodology we adopted to construct the meteorological drought networks, and in Sect. 3 we present the results. Further insights and details on the methods are shown in the Appendix.
We follow the procedure described in Ludescher et al. (2021) and Fan et al. (2021) to reconstruct our meteorological droughts' networks from data, using the Standardized Precipitation Index (SPI) (McKee et al., 1993; Edwards, 1997; Guttman, 1999). The SPI measures precipitation's anomalies at a given location, based on a comparison of observed total rainfall for a certain accumulation time interval of interest (denoted SPI-1, SPI-3, SPI-6, SPI-9, and SPI-12 months) with the long-term historic record for that period and specific area (EDO, 2020). SPI values are positive (negative) for precipitation greater (less) than the median. The SPI is provided by the European Drought Observatory (EDO, 2020), computed from the monthly precipitation data of the Global Precipitation Climatology Centre. We focus on the time interval 1981–2020 and analyze four different accumulation periods, namely the SPI-3, SPI-6, SPI-9, and SPI-12, building one continental network for each of these cases, assessing their similarities and differences. The SPI-1 month is not considered, since it may not be accurate for regions with high probability of zero accumulated rainfall during 1 month (EDO, 2020), which is the case of some areas of northern Africa included in our study.
Our spatial domain is defined based on the Sixth Assessment Report of the IPCC (Jian and Hao-Ming, 2021; Iturbide et al., 2020): the regions NEU, WCE, and MED are taken as representation of Europe (Fig. 1). Notice that meteorological droughts are defined on land, and thus sea is not considered.
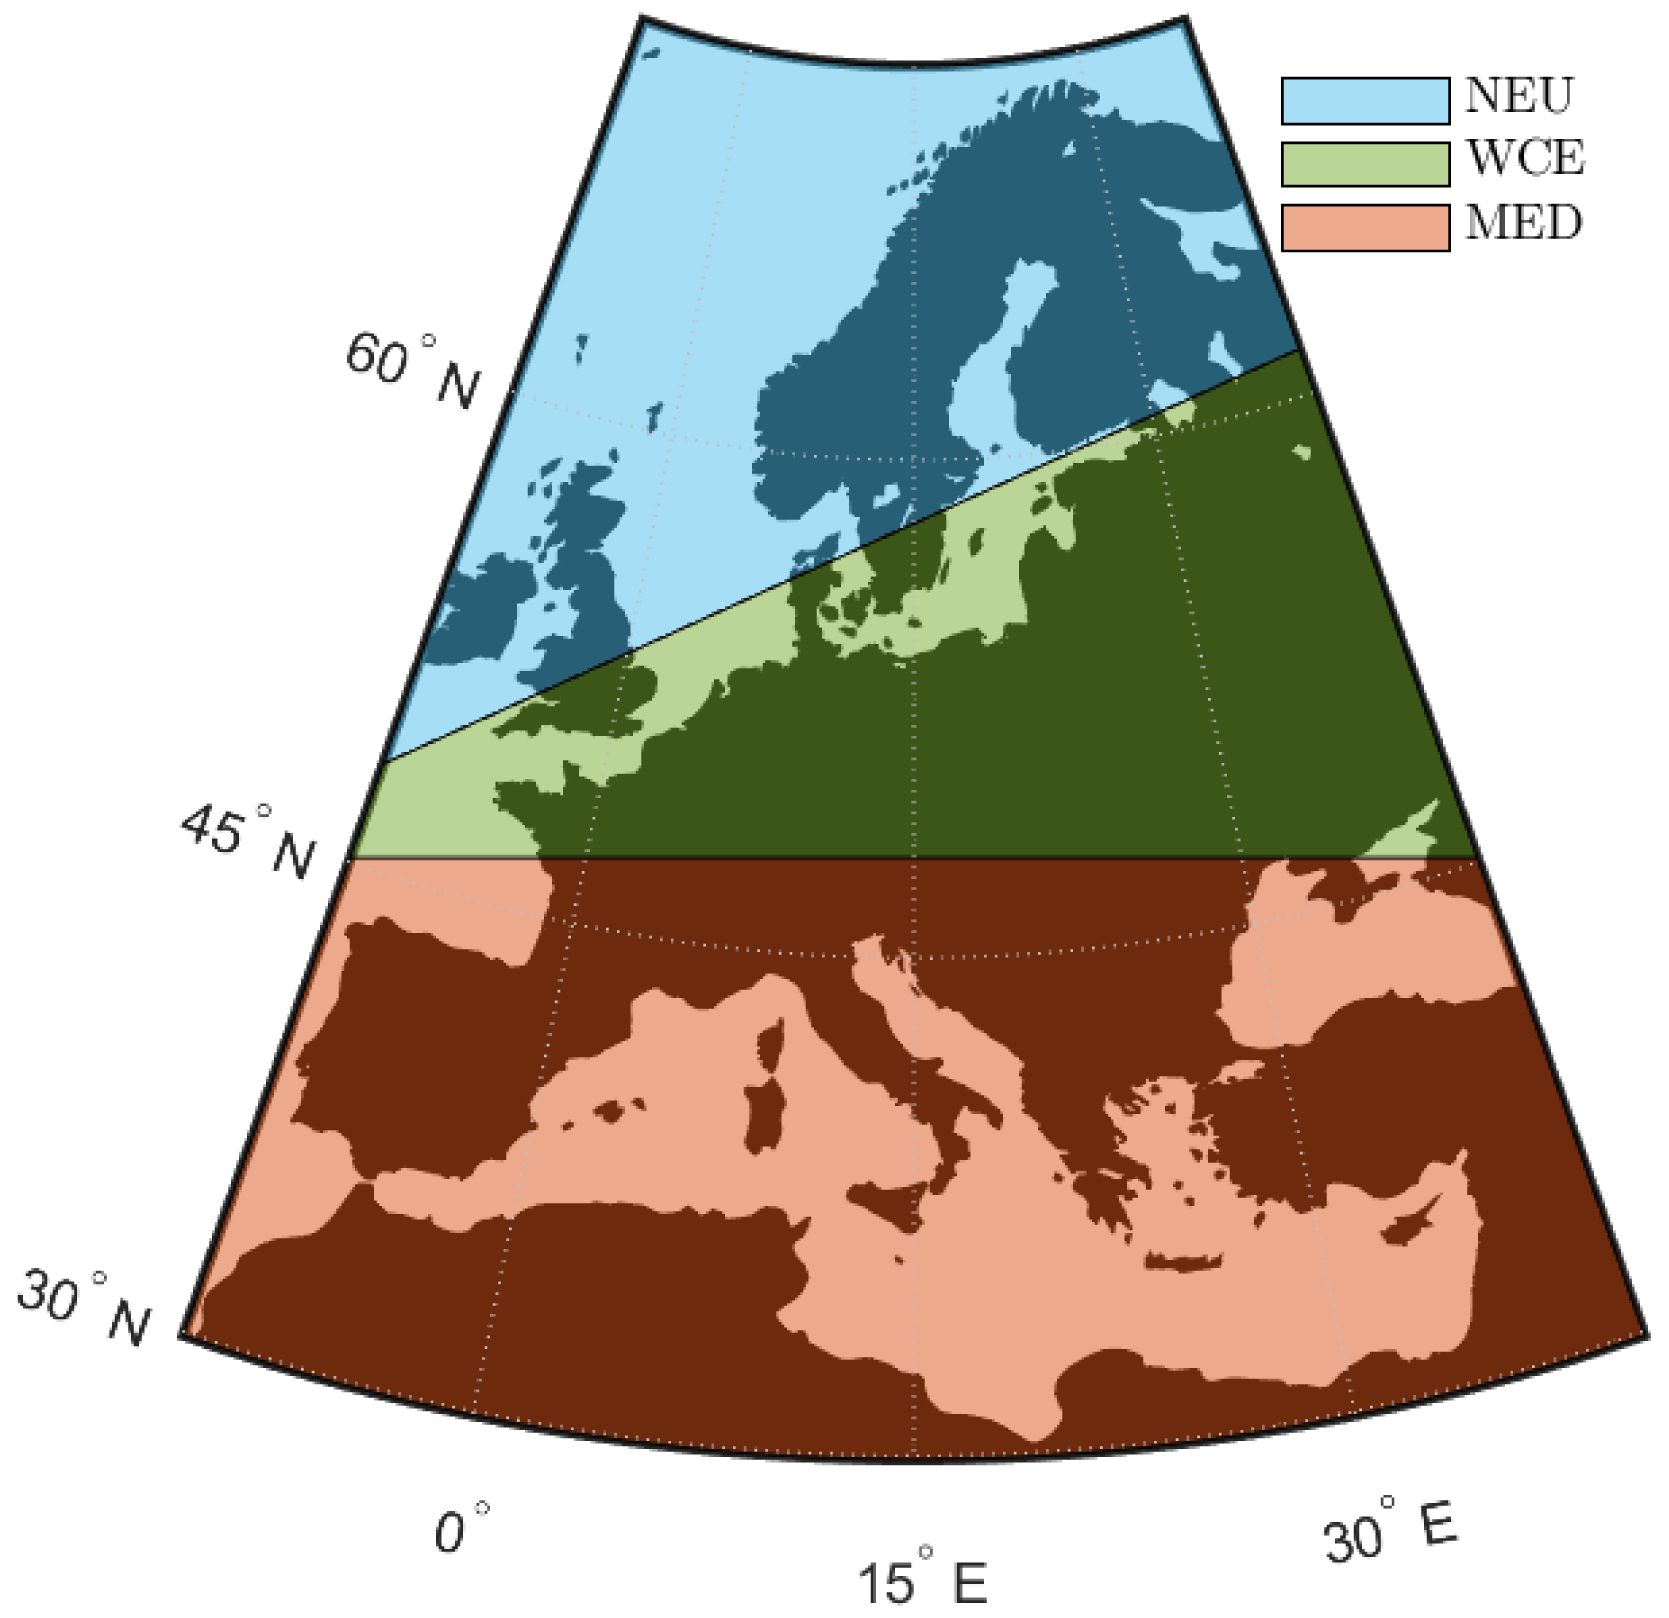
Figure 1The spatial domain analyzed in this study using the IPCC regions NEU, WCE, and MED (only land is considered). Latitude from 30∘ to 72.6∘ and longitude from to 40∘.
The spatial domain is discretized with a resolution of 0.25∘ × 0.25∘ (latitude × longitude). Each grid point is associated with four SPI series (one for each accumulation period) and will serve as a node of the graph.
To identify meteorological droughts in the SPI time series we refer to McKee's work (McKee et al., 1993), where the author proposes a functional and quantitative definition of drought using the SPI as indicator: a meteorological drought is an event that occurs whenever the value of the SPI ≤ −1, whatever the accumulation period is. This definition and the related drought's classes (Table 1) are still accepted and widely used (Spinoni et al., 2016; WMO, 2021). The event sequences from the complete SPI time series are recovered by selecting those occurrences with SPI ≤ −1, and consecutive events are removed, keeping only the first of successive drought conditions (see Fig. 2).
Table 1Meteorological drought categories defined for values of the SPI from McKee et al. (1993).
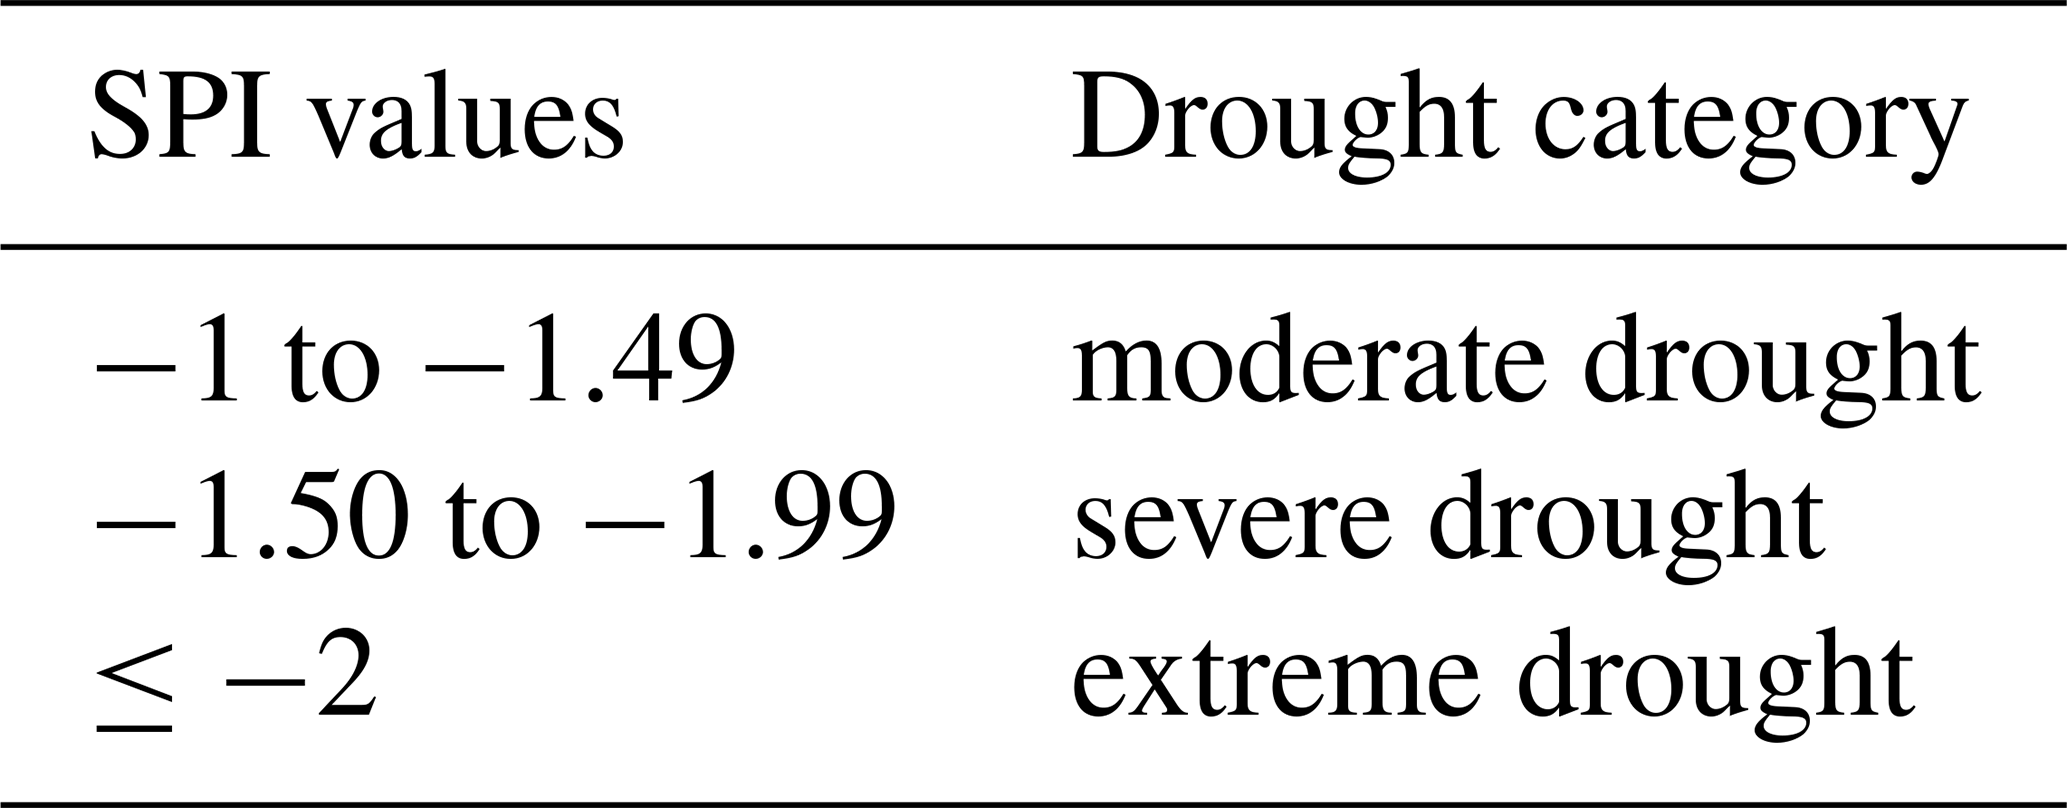
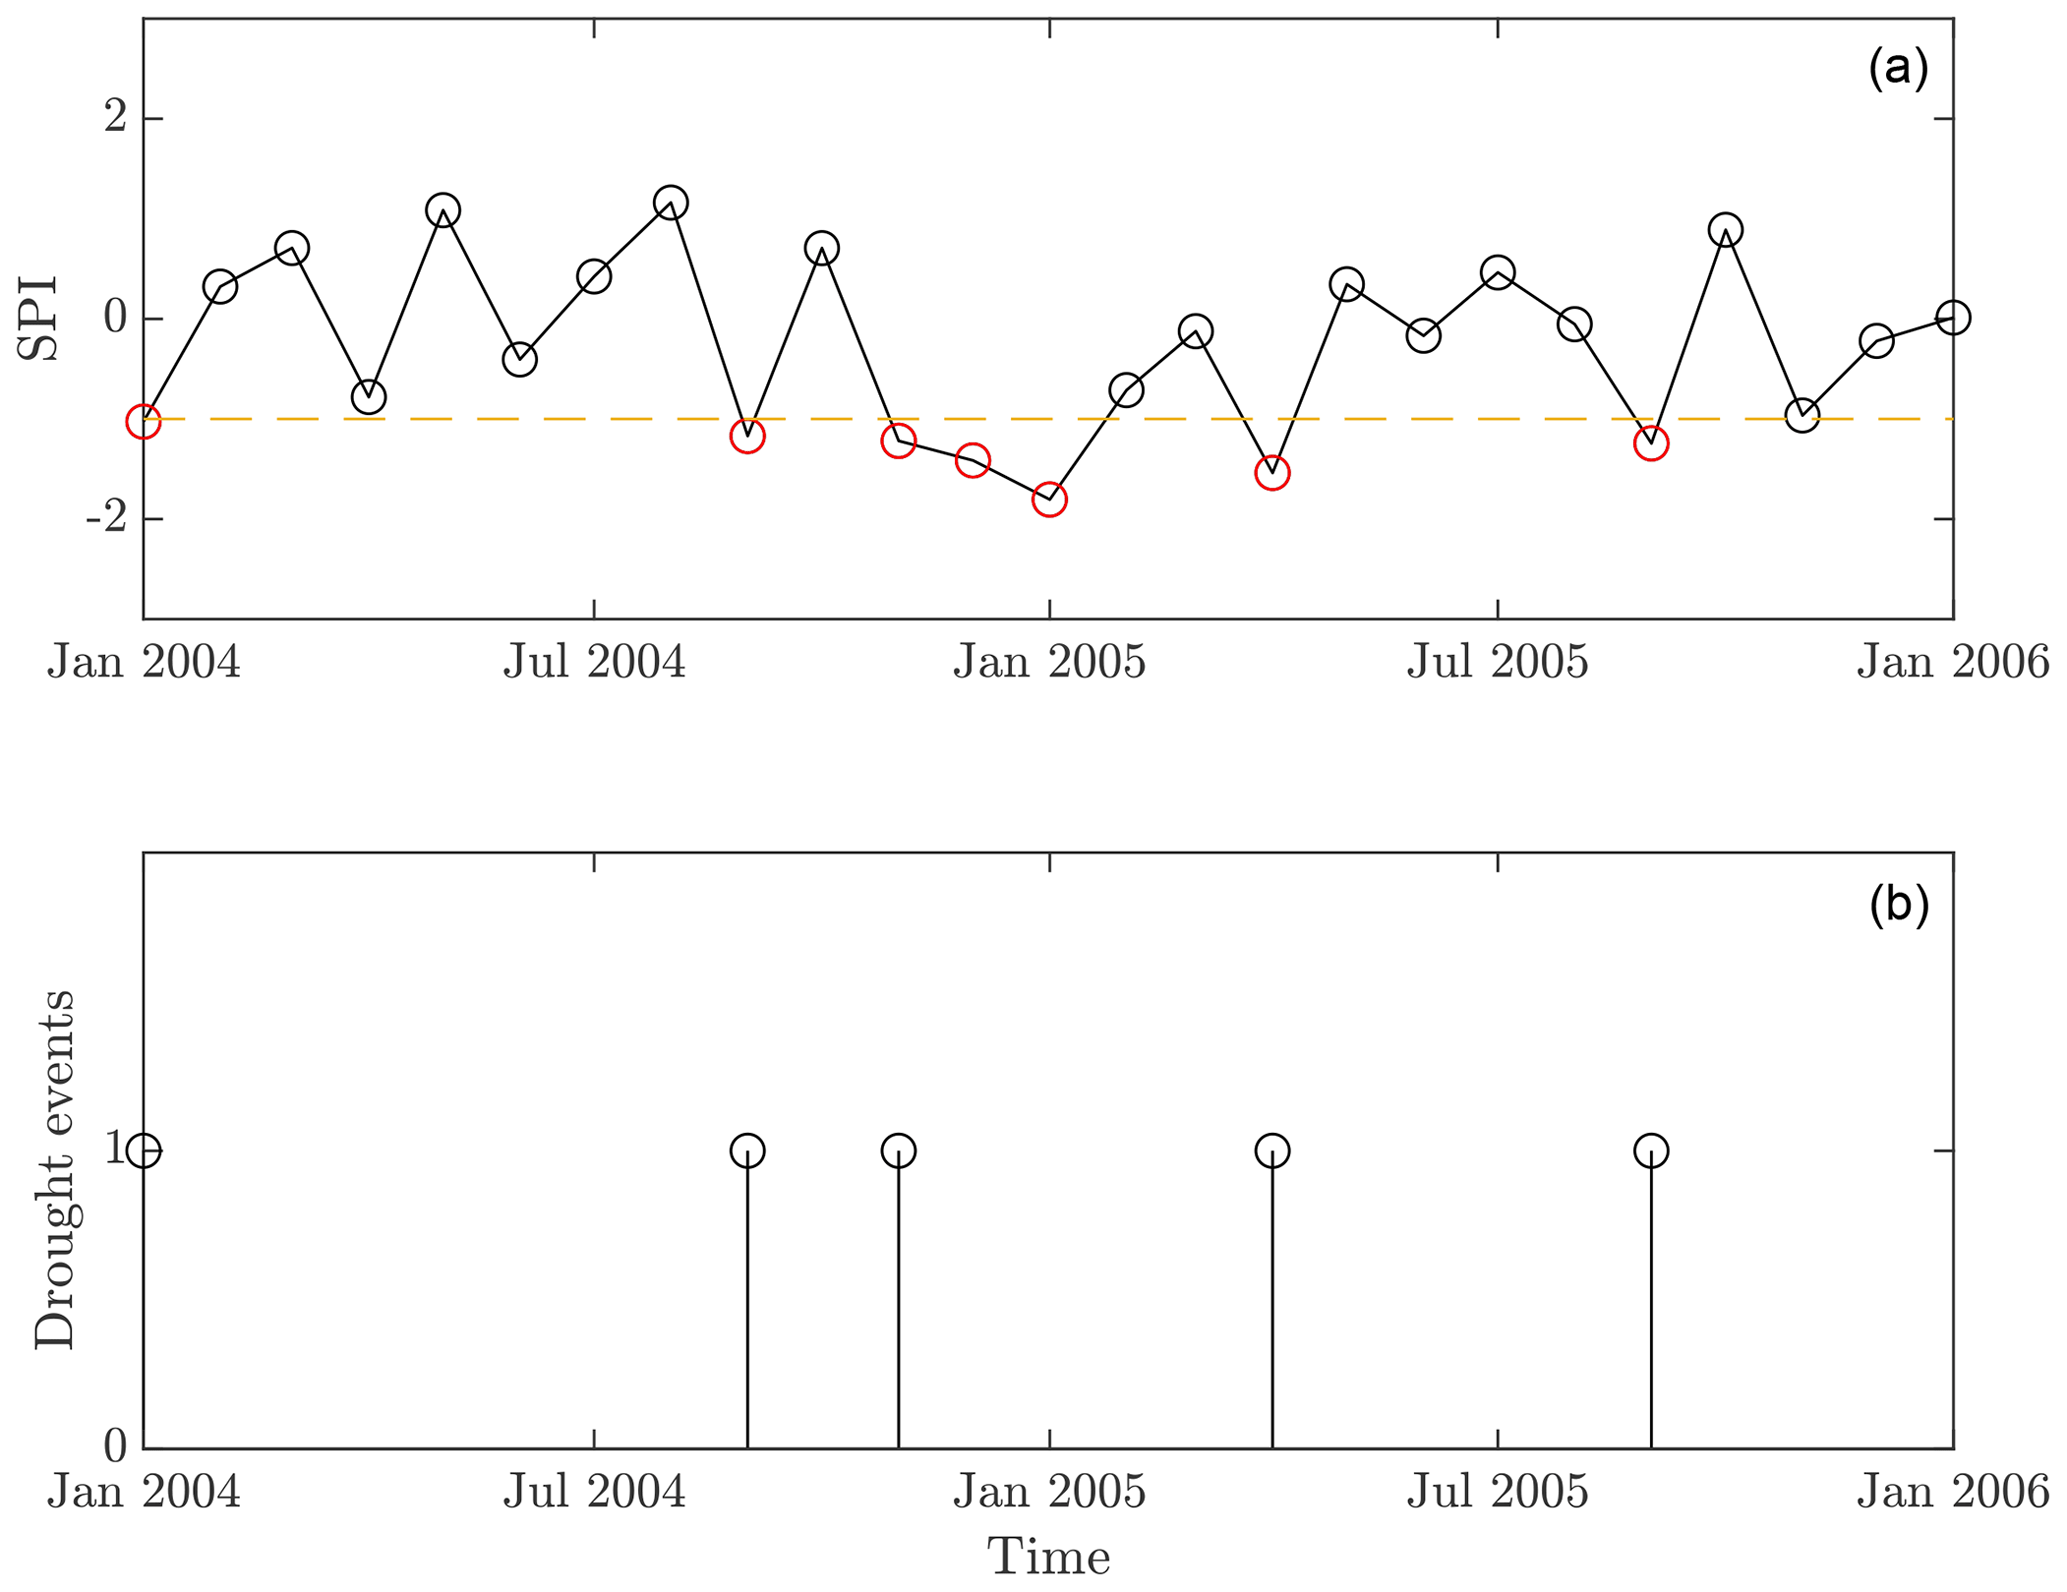
Figure 2Construction of the event series. From the complete SPI time series (a) we select those realizations with SPI ≤ −1 to form the drought event series (b). Notice that consecutive events are removed, keeping only the first occurrence. This procedure is carried for every node of the space domain and for the entire time period 1981–2020.
According to the event-like nature of this process, we use event synchronization (Quiroga et al., 2002; Malik et al., 2012) as a statistical similarity measure to construct each of the four continental drought networks. Event synchronization is a powerful nonlinear method to assess the similarity of event series with unequal spacing between successive occurrences, and thus it is especially appropriate for studying extreme events (Fan et al., 2021). The degree of synchronicity of two event series is measured based on the relative timings of events, and it is obtained from the number of quasi-simultaneous occurrences. We summarize the advantages of this method as follows: (i) ES is designed to treat event-like time series; (ii) by using ES there is no need to set a specific time lag; (iii) ES has both a symmetric and asymmetric formulation, eventually being able to show driver–response relationships; and (iv) ES has been extensively used as a tool to construct climate extreme events' networks, proving to be enough efficient and informative (Malik et al., 2010; Agarwal et al., 2017; Boers et al., 2019; Strnad et al., 2023). The detailed algorithm is described in Fan et al. (2021) and is shortly repeated in the Appendix for the convenience of the reader. The edges derived through event synchronization represent the synchronicity in drought's occurrences between the nodes of the graph. In this preliminary stage, we are not concerned with the direction of synchronicity: two locations are linked if they display a co-evolution of meteorological drought events; therefore, the resulting four continental networks are undirected.
The connections contained in the four continental networks have different strengths, i.e., differing values of synchronicity degree (see Eq. A4). Given the large extension and the high resolution of these graphs, it is not essential to carry the information of links' weights: instead, it is more convenient to select only the strongest edges and derive unweighted representations of each network (see Eq. A5), which will still preserve the main structures of the original graphs.
Extracting the connections with the highest statistical similarity from the complete weighted graph is a very common procedure in general functional network reconstruction from raw data (Zanin et al., 2012), and it is well known in climate network science too (Ludescher et al., 2021; Gupta et al., 2021; Ciemer et al., 2020). In this particular field, the strongest links are considered to be the backbone structure of the climatic process under examination: indeed, when a climate correlation or synchronization network is built, it often resembles an all-to-all connected graph, giving no useful information about the main underlying structure which remains hidden under the great number of links. Cutting off the weakest edges is thus a fundamental step to get a clearer and meaningful representation of any climatic process (Eq. A5). Still, so far we lack a systematic and well-accepted procedure to select this cutoff threshold θ in Eq. (A5) for climate networks, and, moreover, to assess the robustness of the selected connections. As a result, scientists tend to choose it discretionally on a case-by-case basis (Kurths et al., 2019), generally optimizing the ratio between high correlation and a sufficient number of events for comparison (Stolbova et al., 2014). Here we propose a rigorous way to choose the lower bound of synchronicity below which a connection is discarded based on the Hamming distance (Eqs. B1 and B2).
Instead of constructing one 1981–2020 drought network for each accumulation period, we divide the complete dataset into two sub-databases (one with data from the period 1981–2000 and one with data from 2001–2020) and build two independent sub-networks; we then choose the cutoff threshold which minimizes the Hamming distance between these two sub-networks (Fig. B1). With this procedure we not only identify the best cutoff threshold, but we have the additional advantage of selecting the connections which are significant and robust in time because they arise from independent sets of data: the network reconstructed in this way does indeed retain the long-lasting backbone structure of the process, discarding the majority of the spurious synchronizations caused by internal variability and noise. More details about this method are given in the Appendix.
After having built the four unweighted and undirected European networks, we proceed in partitioning them into regional clusters. This procedure is followed in Konapala et al. (2022) as well, where the authors use a distance-weighted synchronization to construct the graph. This filter strengthens the synchronicity among close locations, while penalizing any potential connection between distant areas. Moreover, the distance weight introduced by Konapala et al. (2022) is a relative metric, tuned on the extent of the studied domain. Even assuming that drought conditions' propagation is influenced by geographical distance and therefore bounded to a certain level, this sensitivity should at least be fixed, not changing with the size of the studied area. Whereas according to the majority of studies in climate networks long connections can not be ignored, on the contrary, teleconnections play a crucial role in transferring climate information across the globe (Donges et al., 2009; Tsonis et al., 2008, 2006; Boers et al., 2019, 2013; Stolbova et al., 2014). These considerations prompt us to identify regional clusters from the event synchronization network without introducing any distance weight.
To find the regional clusters for each of the four networks, we use the Louvain algorithm (Blondel et al., 2008), a heuristic method that is based on modularity optimization (Newman, 2006). The Louvain algorithm finds a local maximum of modularity, which depends on the order the nodes are picked. Therefore, we apply it 10 000 times for each continental network, taking the partition with the overall highest modularity. The communities found represent the regions in which a drought event is more likely to propagate once started: intra-connections are maximized over inter-connections, meaning that the nodes grouped together are characterized by a high cooperativity in terms of synchronization in meteorological droughts' occurrences.
To analyze the synchronization's patterns of meteorological droughts, we build regional spatial networks for each community. This time, unlike what was done before for the four continental networks, once the nodes of one specific community are extrapolated, we use event synchronization to build weighted and directed graphs.
The comparison between the four continental networks and the features of the regional networks is described in the next section.
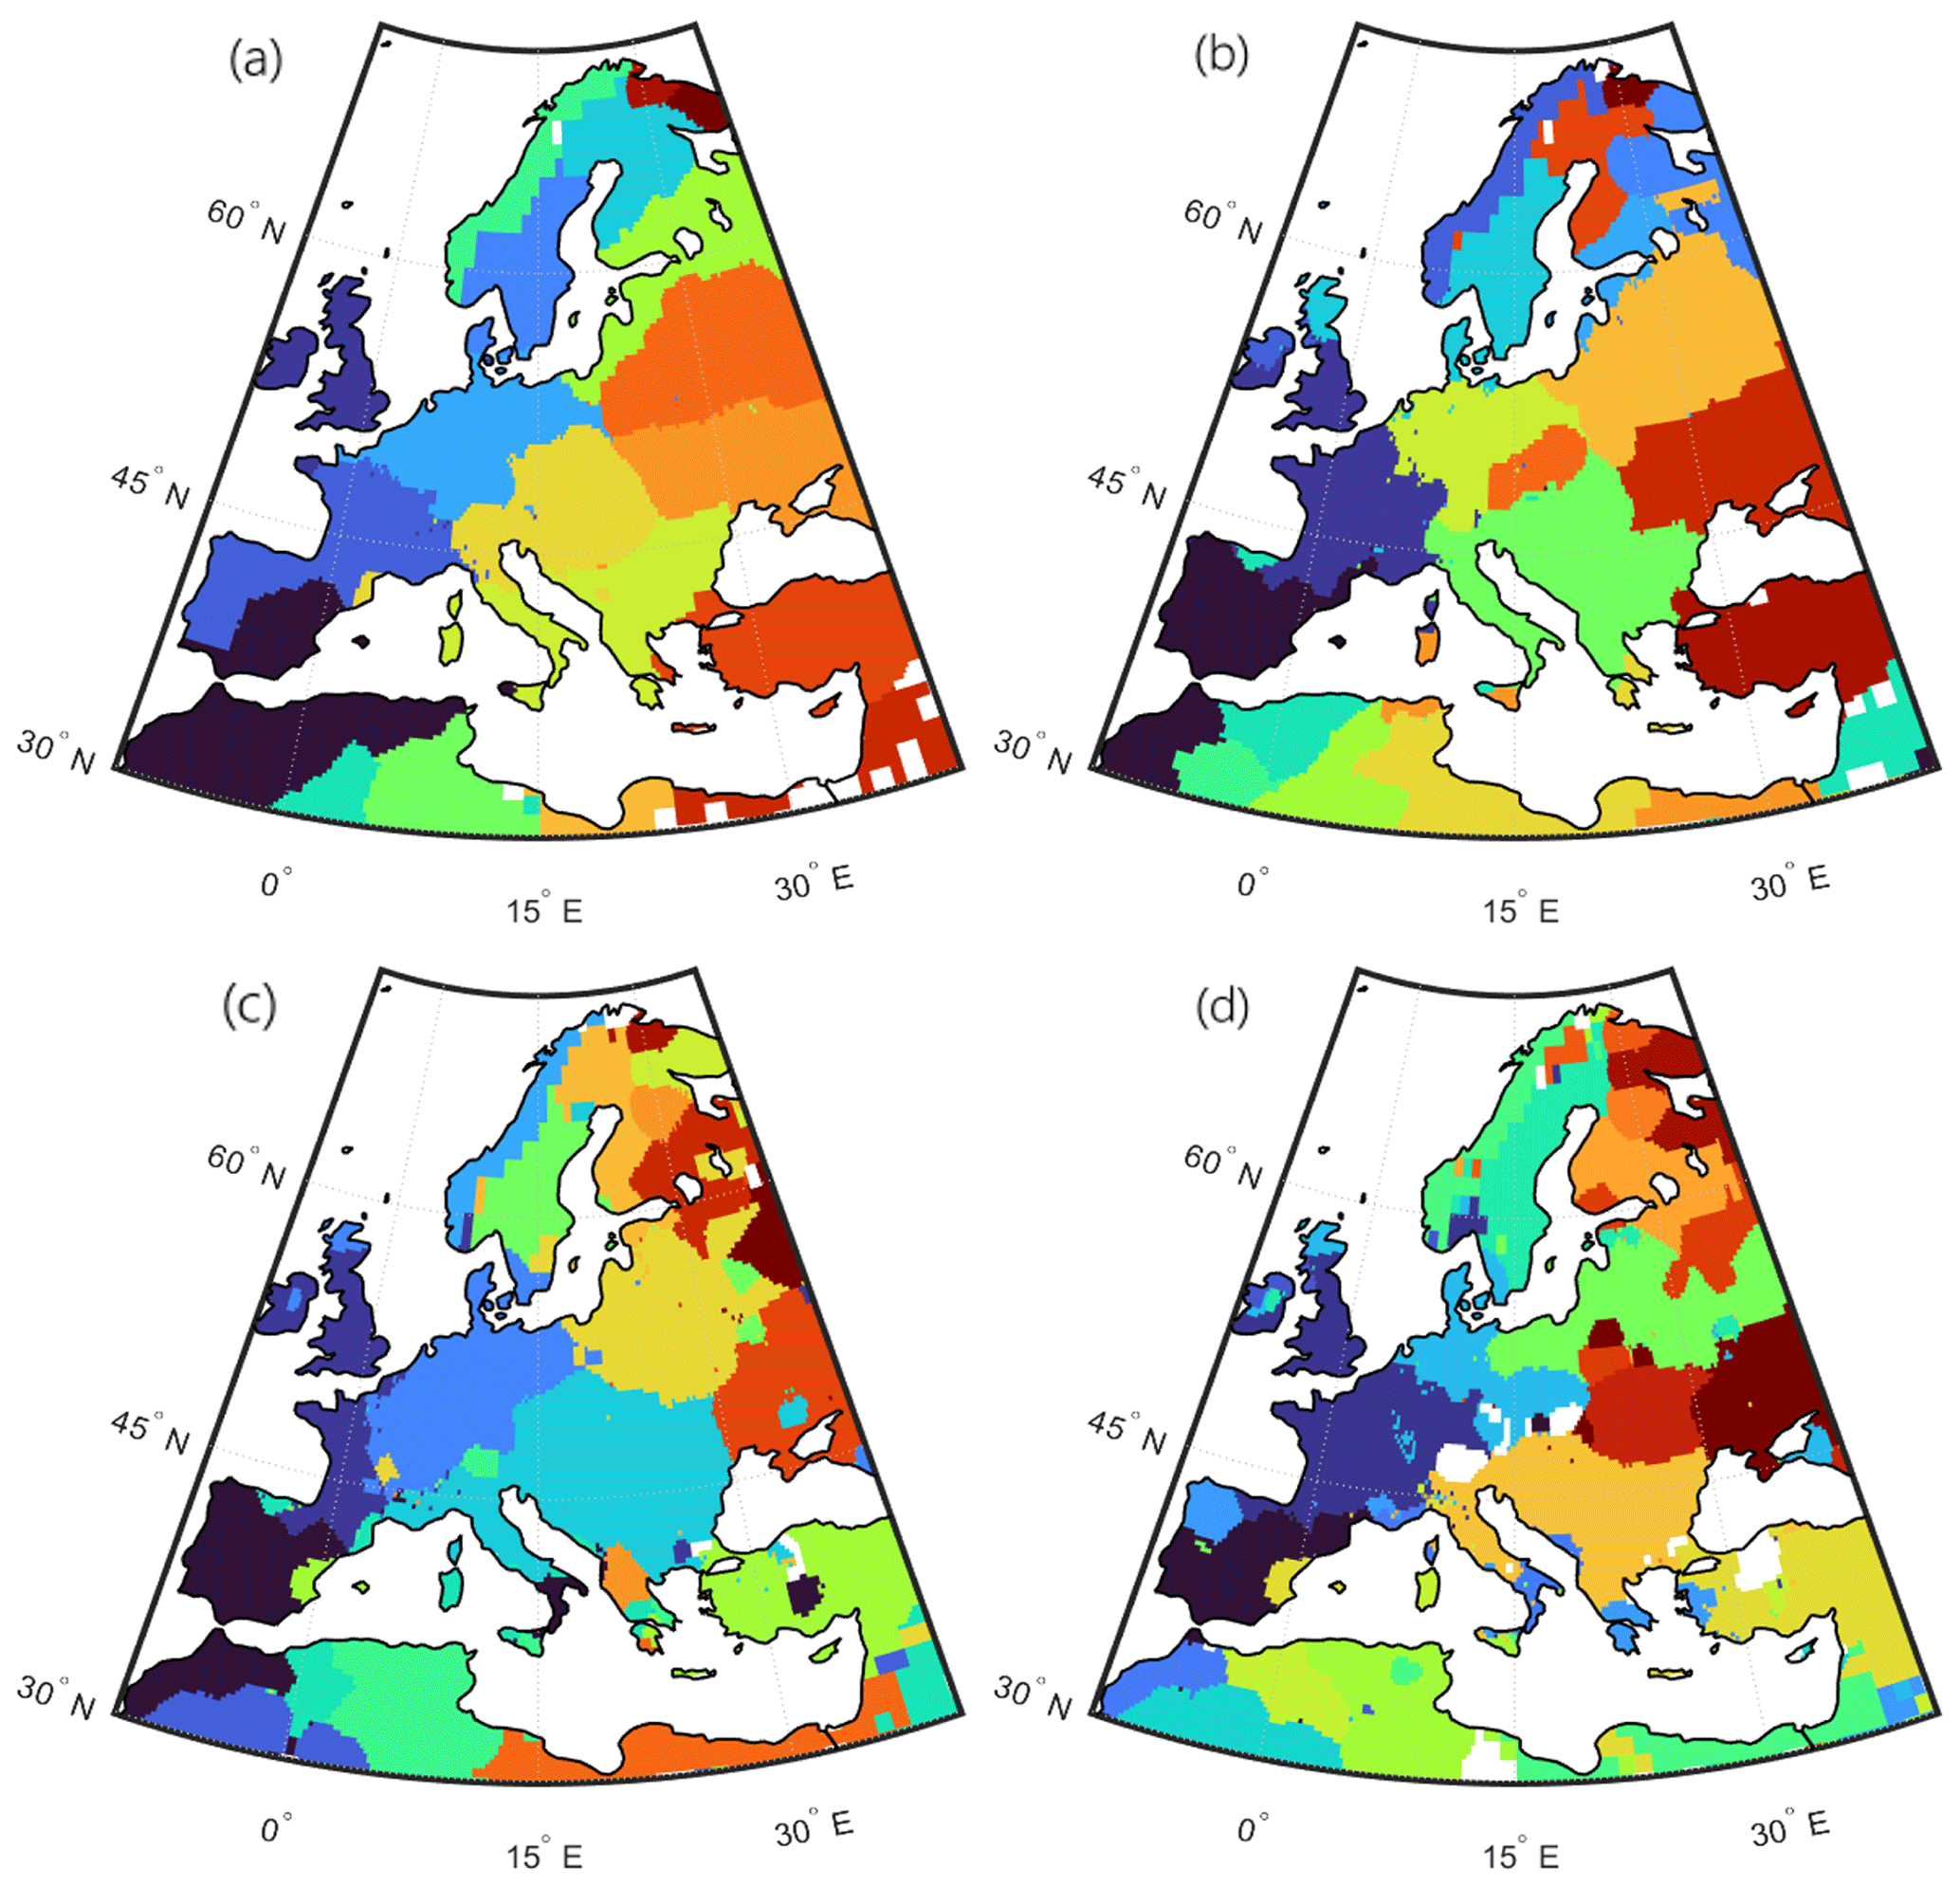
Figure 3Communities detected with the Louvain algorithm from the SPI-3 network (a), SPI-6 network (b), SPI-9 network (c), and SPI-12 network (d). Each color represents a different community, while white areas are either part of the sea or consist of nodes belonging to clusters with fewer than 100 nodes.
The partitions of the four European drought networks resulting from 10 000 different realizations of the Louvain algorithm are shown in Fig. 3.
We notice important similarities and differences between the four networks. The most relevant features that arise are the following: (i) the regional clusters of the Scandinavian Peninsula are quite comparable, with the western part of Norway always standing alone as one community, separated from Sweden, which forms another compact block, and Finland, often divided into several parts alongside the Kola Peninsula; (ii) the eastern part of the continent is split into latitudinal regions, well visible for the shortest accumulation periods while more and more fragmented in the 9- and 12-month cases; (iii) Turkey often forms one cluster; (iv) the Iberian Peninsula is connected to northwest Africa, except for the SPI-12 network; (v) the northern part of Italy is joined with the north of the Balkan Peninsula; and (vi) the increase of the fragmentation of the communities with the accumulation period does not translate into an increment of the communities' number (see Table 2) but to the disruption of the spatial continuity of the clusters from the shortest accumulation periods to the longest one.
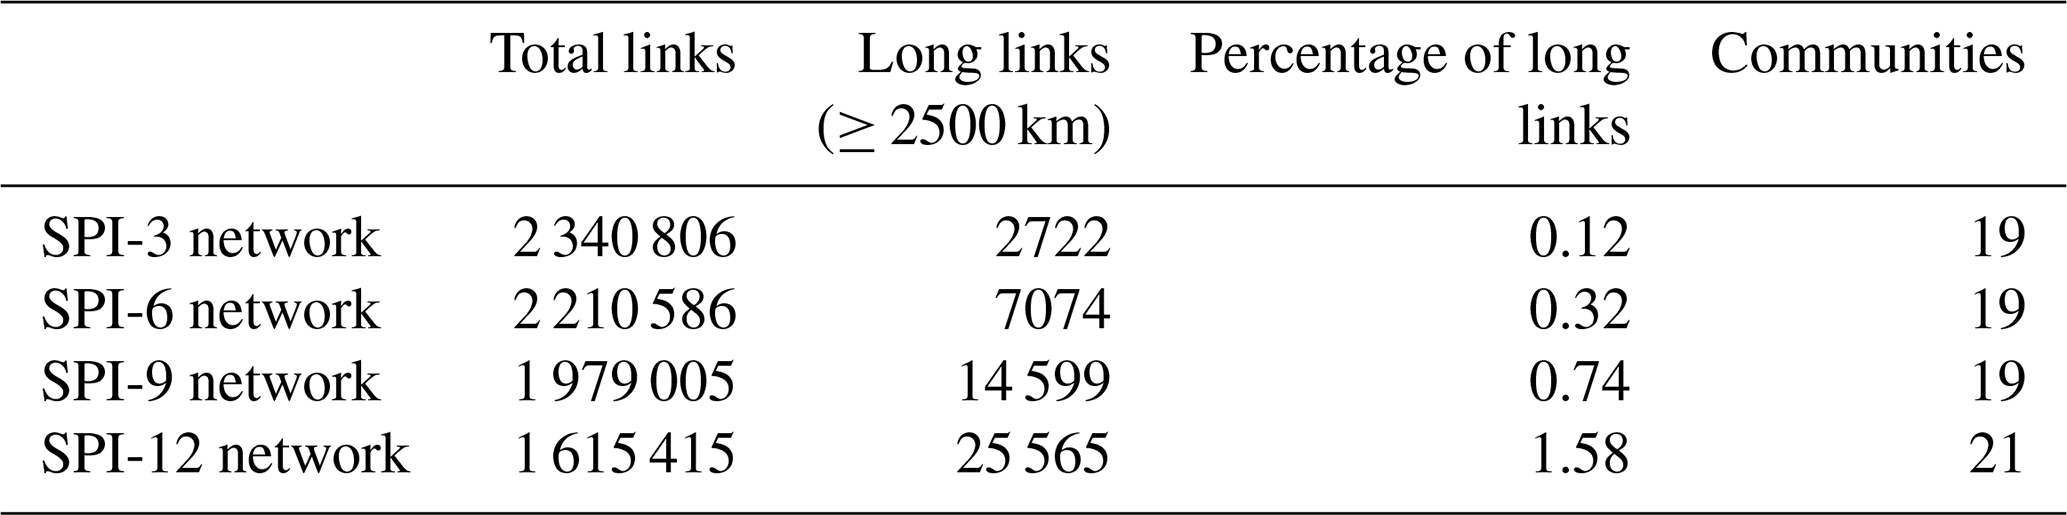
We find that the latter characteristic is due to the presence of long links, which are more numerous the higher the accumulation period: we register 25 565 long links in the SPI-12 network, 1 order of magnitude more than the 2722 long links in the SPI-3 network (see Fig. 4 and Table 2). In Boers et al. (2019) the extreme precipitation's global climate network was characterized by two different weather systems, a regional power-law-distributed one and a super-power-law-distributed global pattern. This latter system was detected from network links longer than 2500 km. In our analysis, these features seem to emerge again, even if we focus on negative precipitation's extremes, and Europe is not big enough to contain a statistically adequate number of possible long connections (≥ 2500 km). Nevertheless, if we look at Fig. 4, we see a shift in the distribution of the number of links when this critical 2500 km length is passed. Moreover, the number of long links increases with the accumulation period, even when the total number of connections does not change sensibly among the four cases (see Table 2).
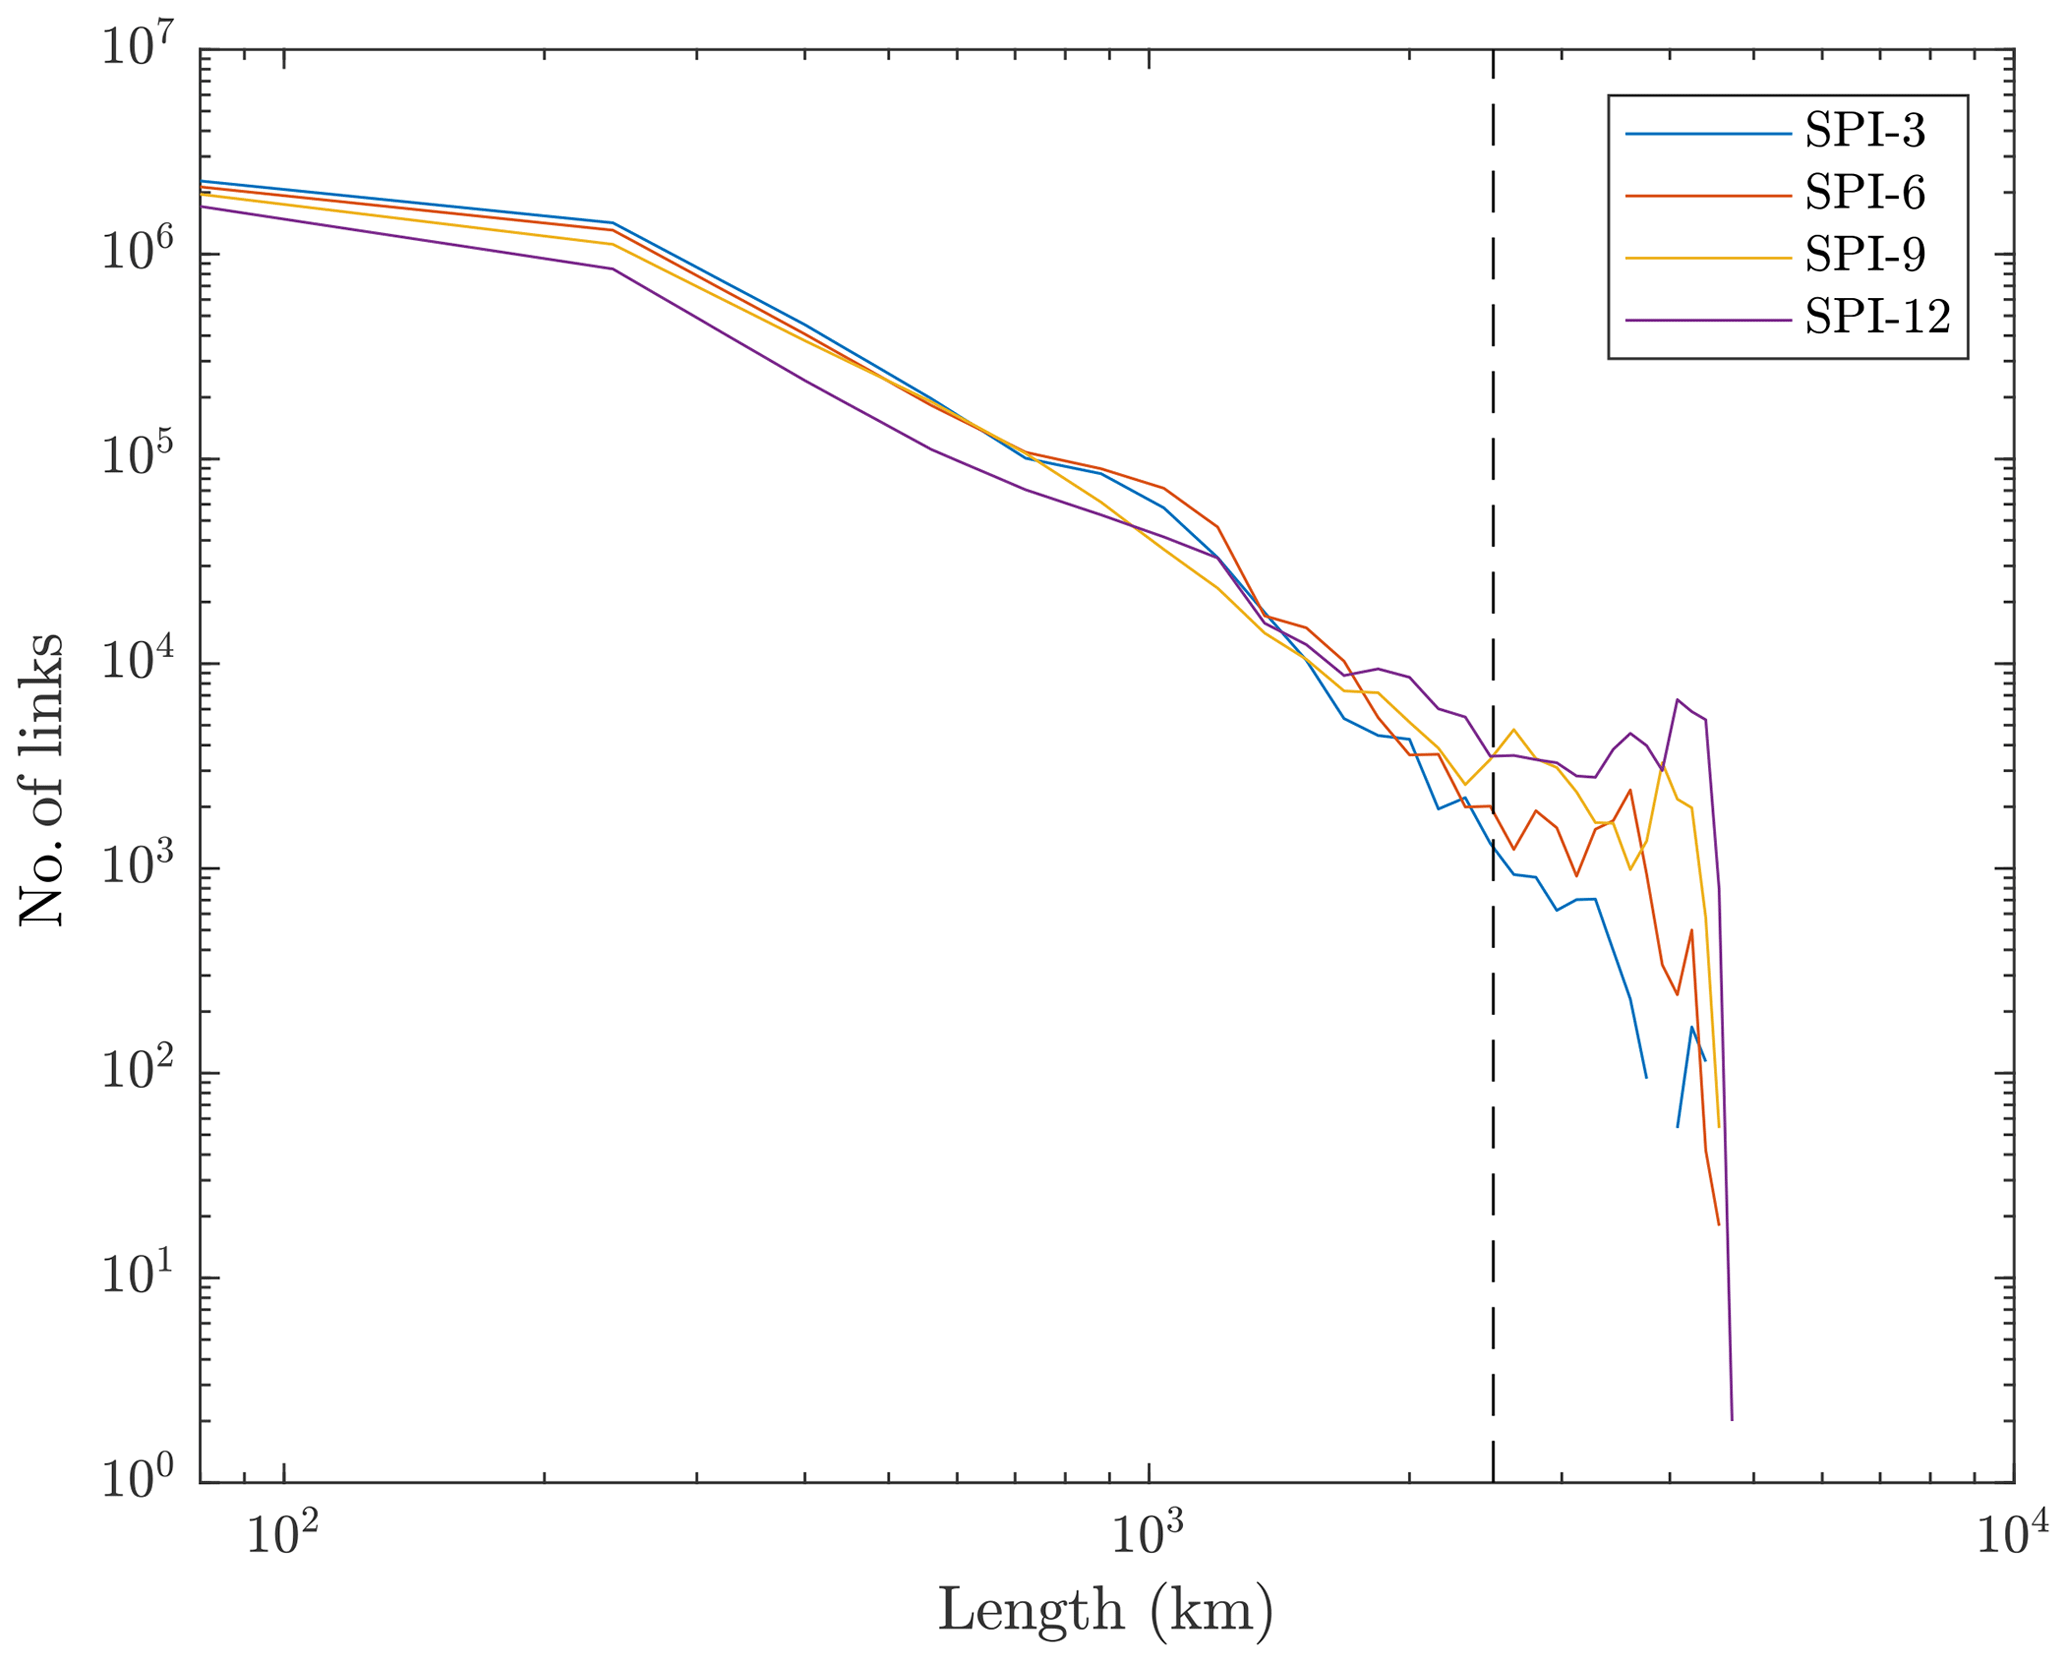
Figure 4Distribution of the number of links with their length (great circle distance of the two nodes connected by the link) for each of the four Europe's meteorological drought networks (colored lines). The dashed line represents the 2500 km distance.
Table 2Number of total and long links (≥ 2500 km) in four of Europe's meteorological drought networks and the number of communities found.
This exhibits the primary role of long connections in the context of climate networks. The presence of these long links is typically due to large-scale atmospheric patterns which could act as common drivers of climate extremes of distant regions. This feature would not emerge if we used a distance weighted network's construction: in fact, we would have lost long connections, being left with four partitions that are very similar to one another. We argue that short meteorological drought events (with accumulation period up to 6 months) are driven by regional climate systems, while long ones (with accumulation period from 9 months onward) are due to large-scale patterns that affect an ample portion of the continent. Rossby wave trains could be a potential reasonable candidate for connecting the distant area in the longitudinal direction. Follow-up studies could better clarify the climate precursors responsible for the appearance of these long connections for high-accumulation periods.
Once we identify the clusters of each of the four continental networks, we proceed in studying each regional community separately, constructing weighted and directed graphs. The antisymmetrical score qij (Eq. A4) which results from the application of event synchronization (see the Appendix) to the regional clusters can be used to derive the out-degree (defined as the average of the weights of the outgoing links) and the in-degree (defined as the average of the weights of the incoming links) of each node i in its community c and, consequently, its overall degree centrality ki:
where Nc is the total number of nodes belonging to community c, and 𝒩i denotes the neighbors of node i. The degree centrality ki lies between −1 and 1. Here, a node i with ki<0 is defined as a sink, otherwise as a source. Each community of each of the four continental networks can thus be studied under this framework, identifying a source–sink system.
Here we show some interesting source–sink systems found in each of the four continental networks.
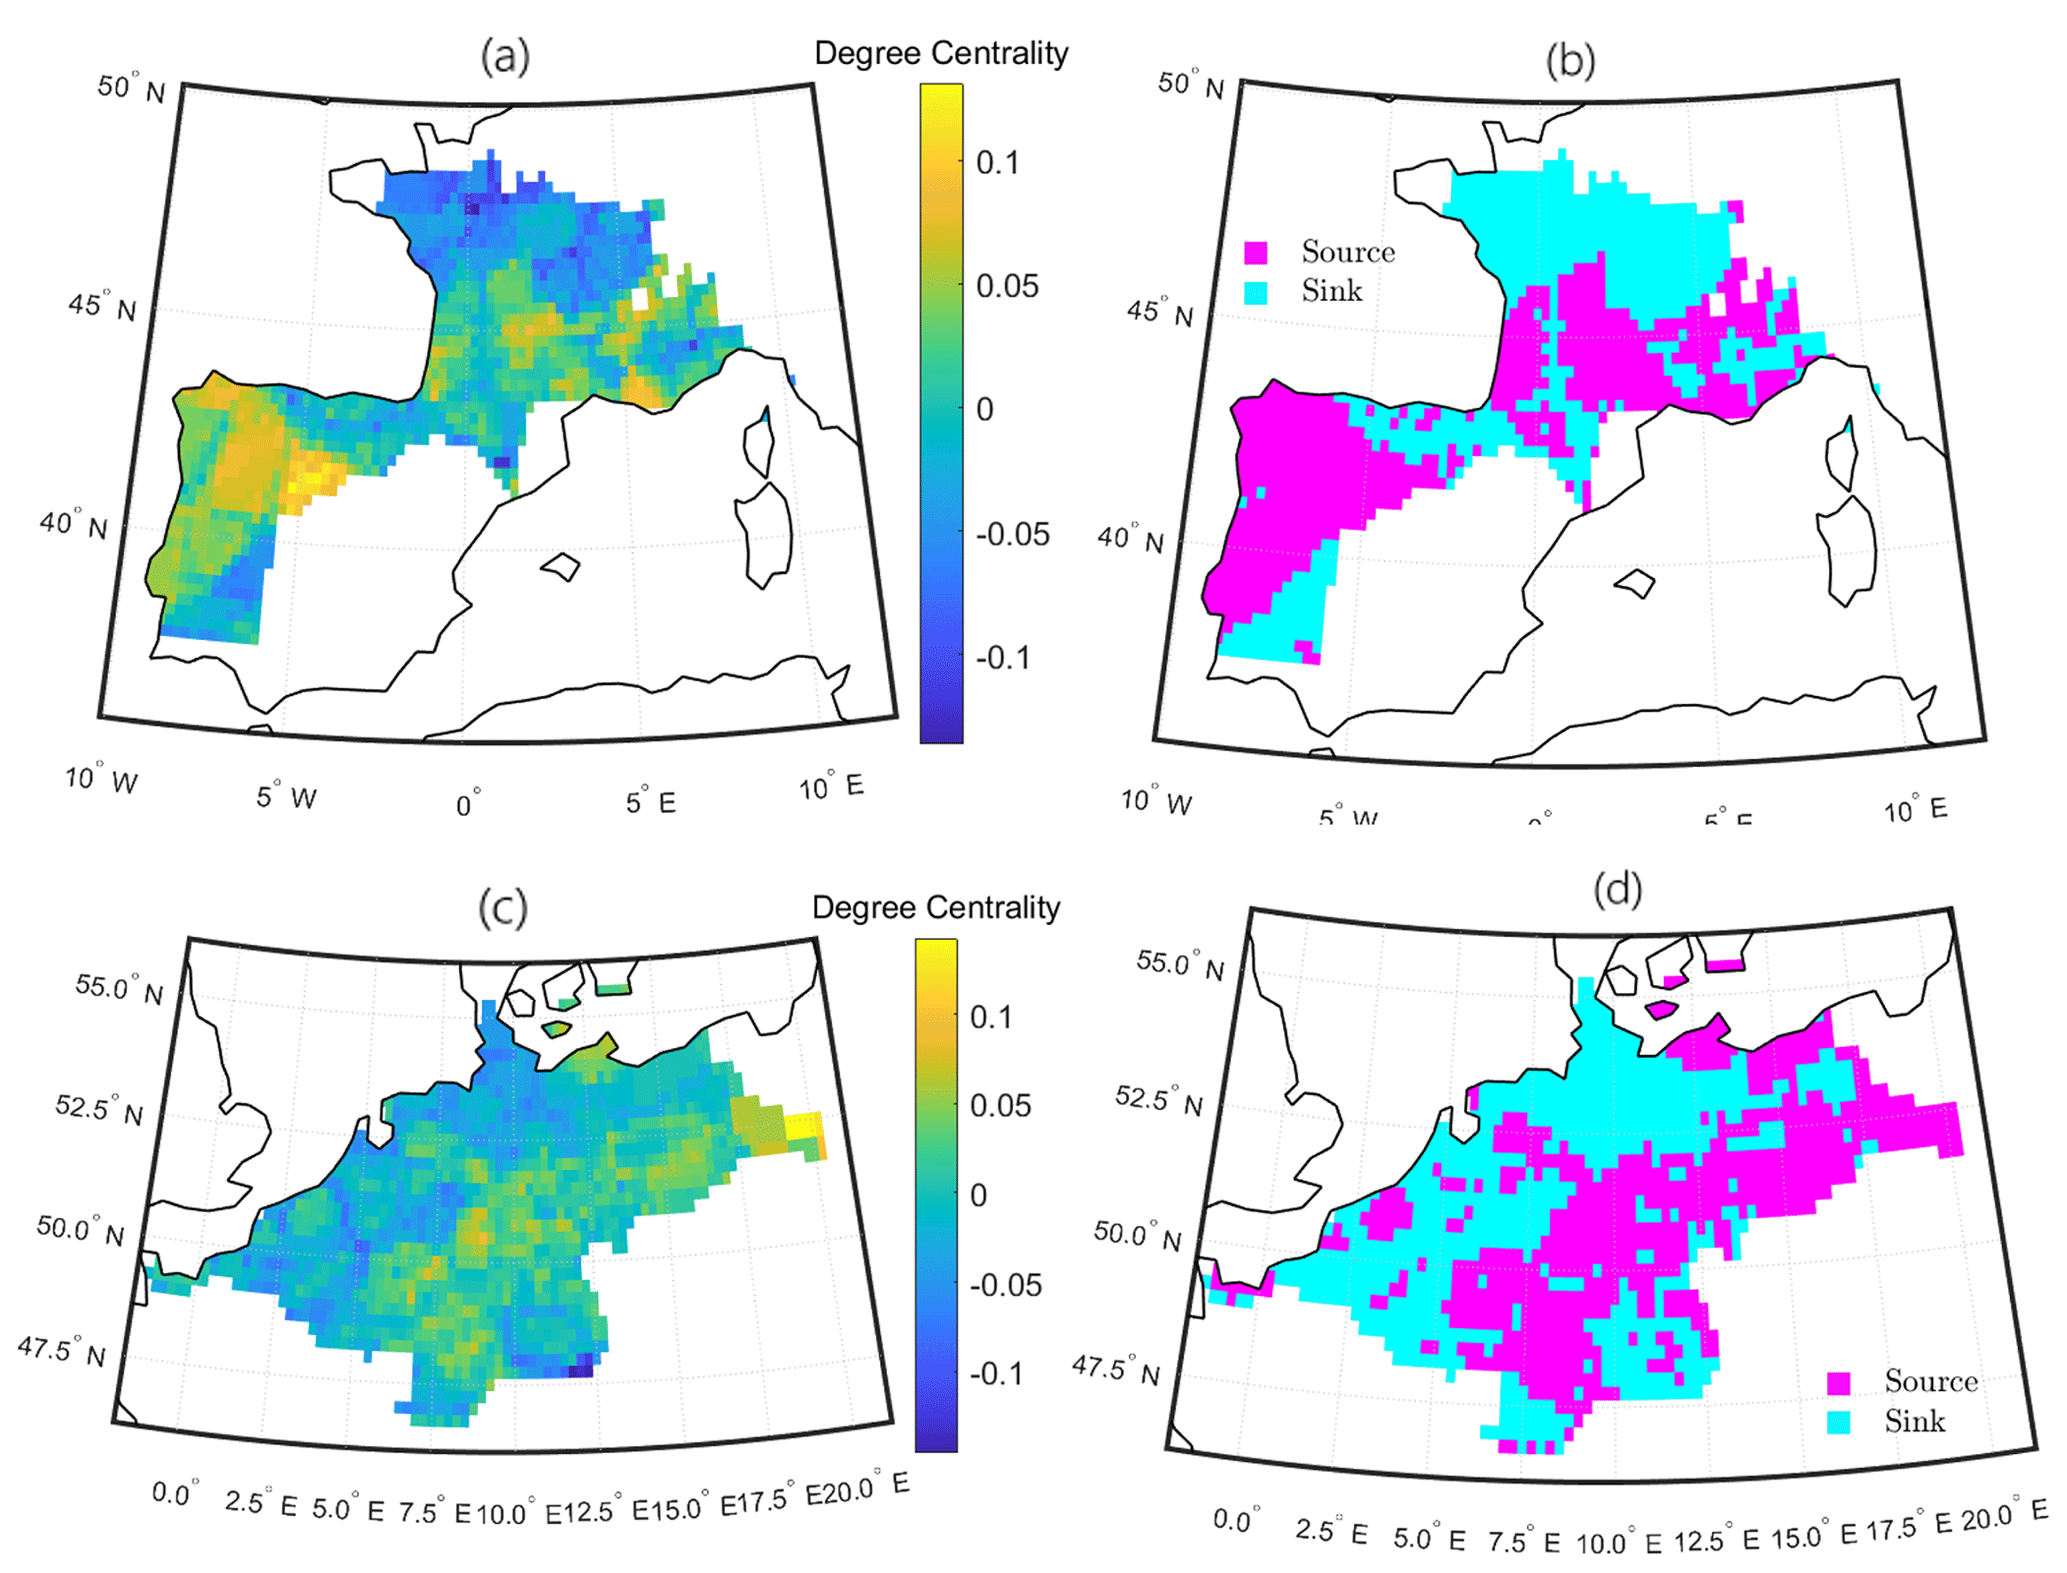
Figure 5Two regional spatial networks from the SPI-3 Europe meteorological drought network. Degree centrality (a, c) and source–sink system (b, d).
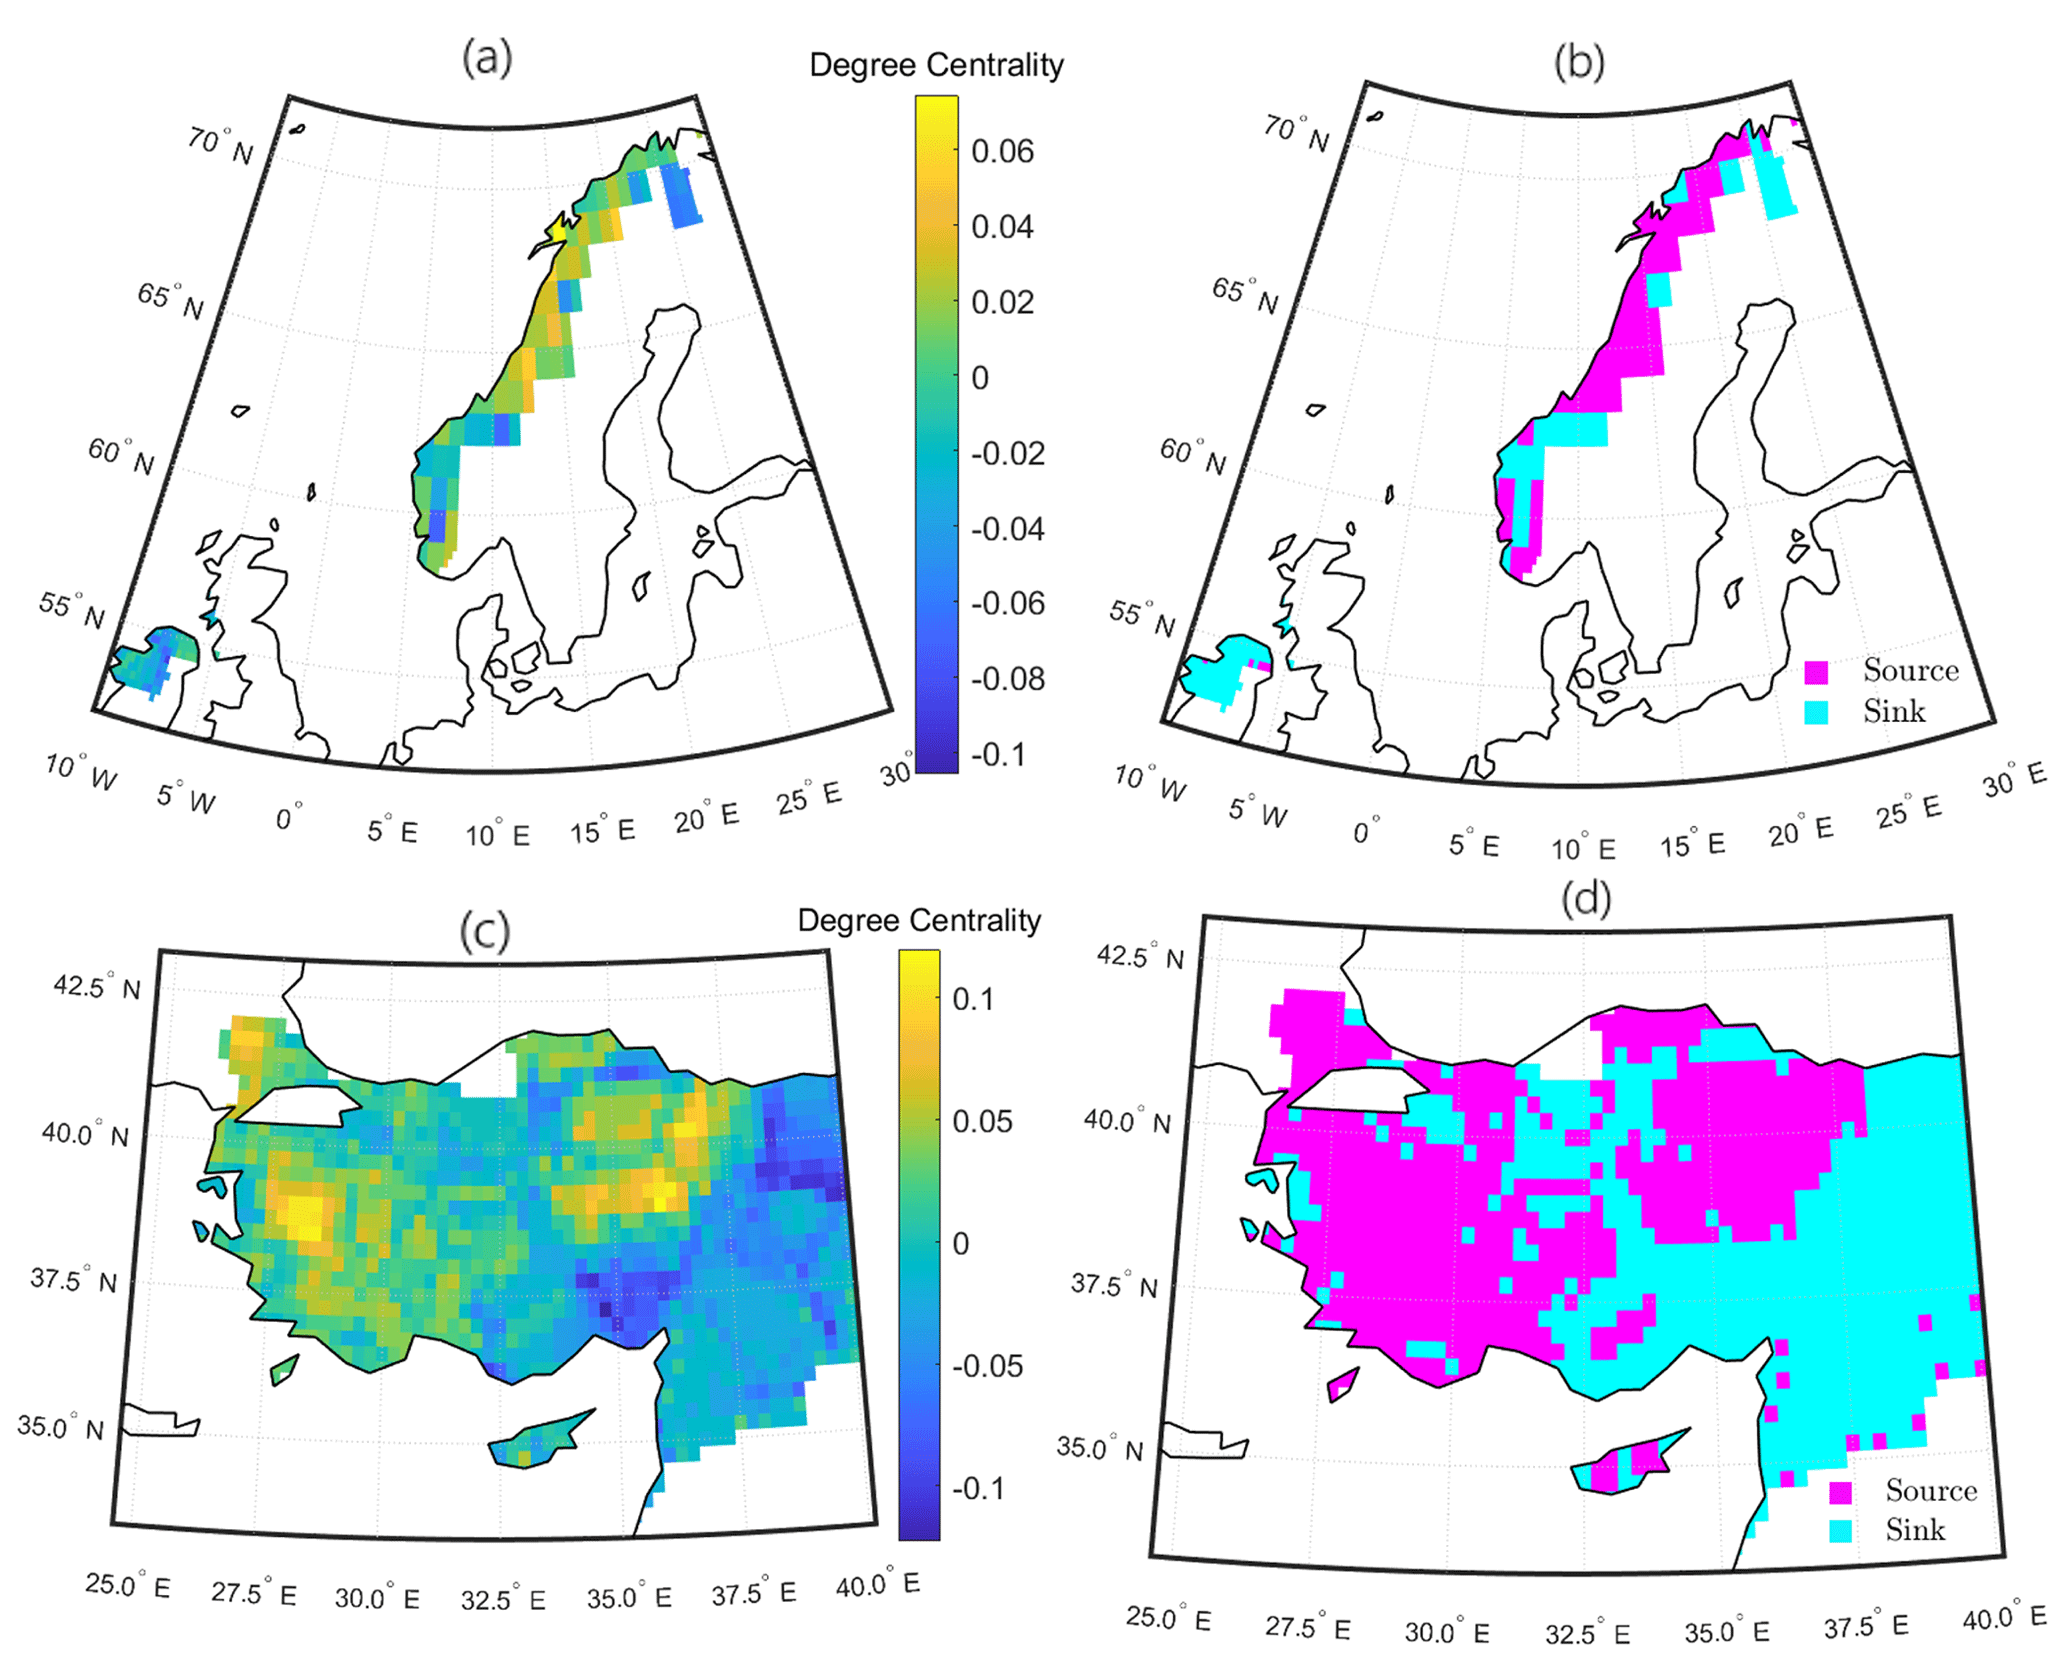
Figure 6Two regional spatial networks from the SPI-6 Europe meteorological drought network. Degree centrality (a, c) and source–sink system (b, d).
In the SPI-3 network, Portugal essentially acts as a source for its community (Fig. 5a and b), suggesting that the lack of humidity could move from the coast towards inland. The role of Portugal as a source could be explained by two main points: on the one hand, this area is on average the rainiest in the Iberian Peninsula, and thus it is more sensitive to dry conditions; on the other hand, it is more affected by the North Atlantic Oscillation and the East Atlantic pattern, two important atmospheric processes which influence the Iberian precipitation regime (Benito et al., 1996). A different situation is depicted in the central Europe community (Fig. 5c and d), where the internal part of the region drives droughts' occurrences to the coast. As shown by Hofstätter et al. (2018), precipitation patterns over central Europe are largely controlled by atmospheric cyclones: consequently, the evolution of meteorological droughts in this region may be directed along cyclones' tracks. A further investigation into the average patterns of the various cyclone types may help in clarifying this matter better.
In the SPI-6 networks, it is interesting to notice the connection between Northern Ireland and the Norwegian mountains (Fig. 6a and b). As we already pointed out looking at Fig. 3, the western part of Norway is always separated from the rest of the Scandinavian Peninsula in every of the four accumulation periods networks, but in the specific case of the SPI-6 network, Northern Ireland is synchronized with this mountainous chain, and in particular it uniformly acts as a sink. While it seems clear that the separation of Norway from the rest of the Scandinavian Peninsula arises from the blocking action of the Norwegian mountains, the linkage between Northern Ireland and Norway at this accumulation period is unforeseen; nevertheless we anticipate the prominent role of atmospheric rivers moving through the Norwegian Sea and the Scandinavian pattern, which leads to dry conditions over the northern part of the continent during its positive phase (Bueh and Nakamura, 2007). Another regional spatial network derived from the SPI-6 graph that we show here is the Turkey one. We mentioned that this region often consistently form one sole cluster, displaying a certain stability over the different accumulation periods cases. In the SPI-6 network the western and central regions of Turkey precede the east in the occurrence of meteorological droughts events (Fig. 6c and d). While the North Atlantic Oscillation represents a remote driver of precipitation over Turkey, the Mediterranean and the marine polar air masses are direct causes of rainfall in this region (Sariş et al., 2010), and their west–east direction suggests a key role in droughts' diffusion as well.
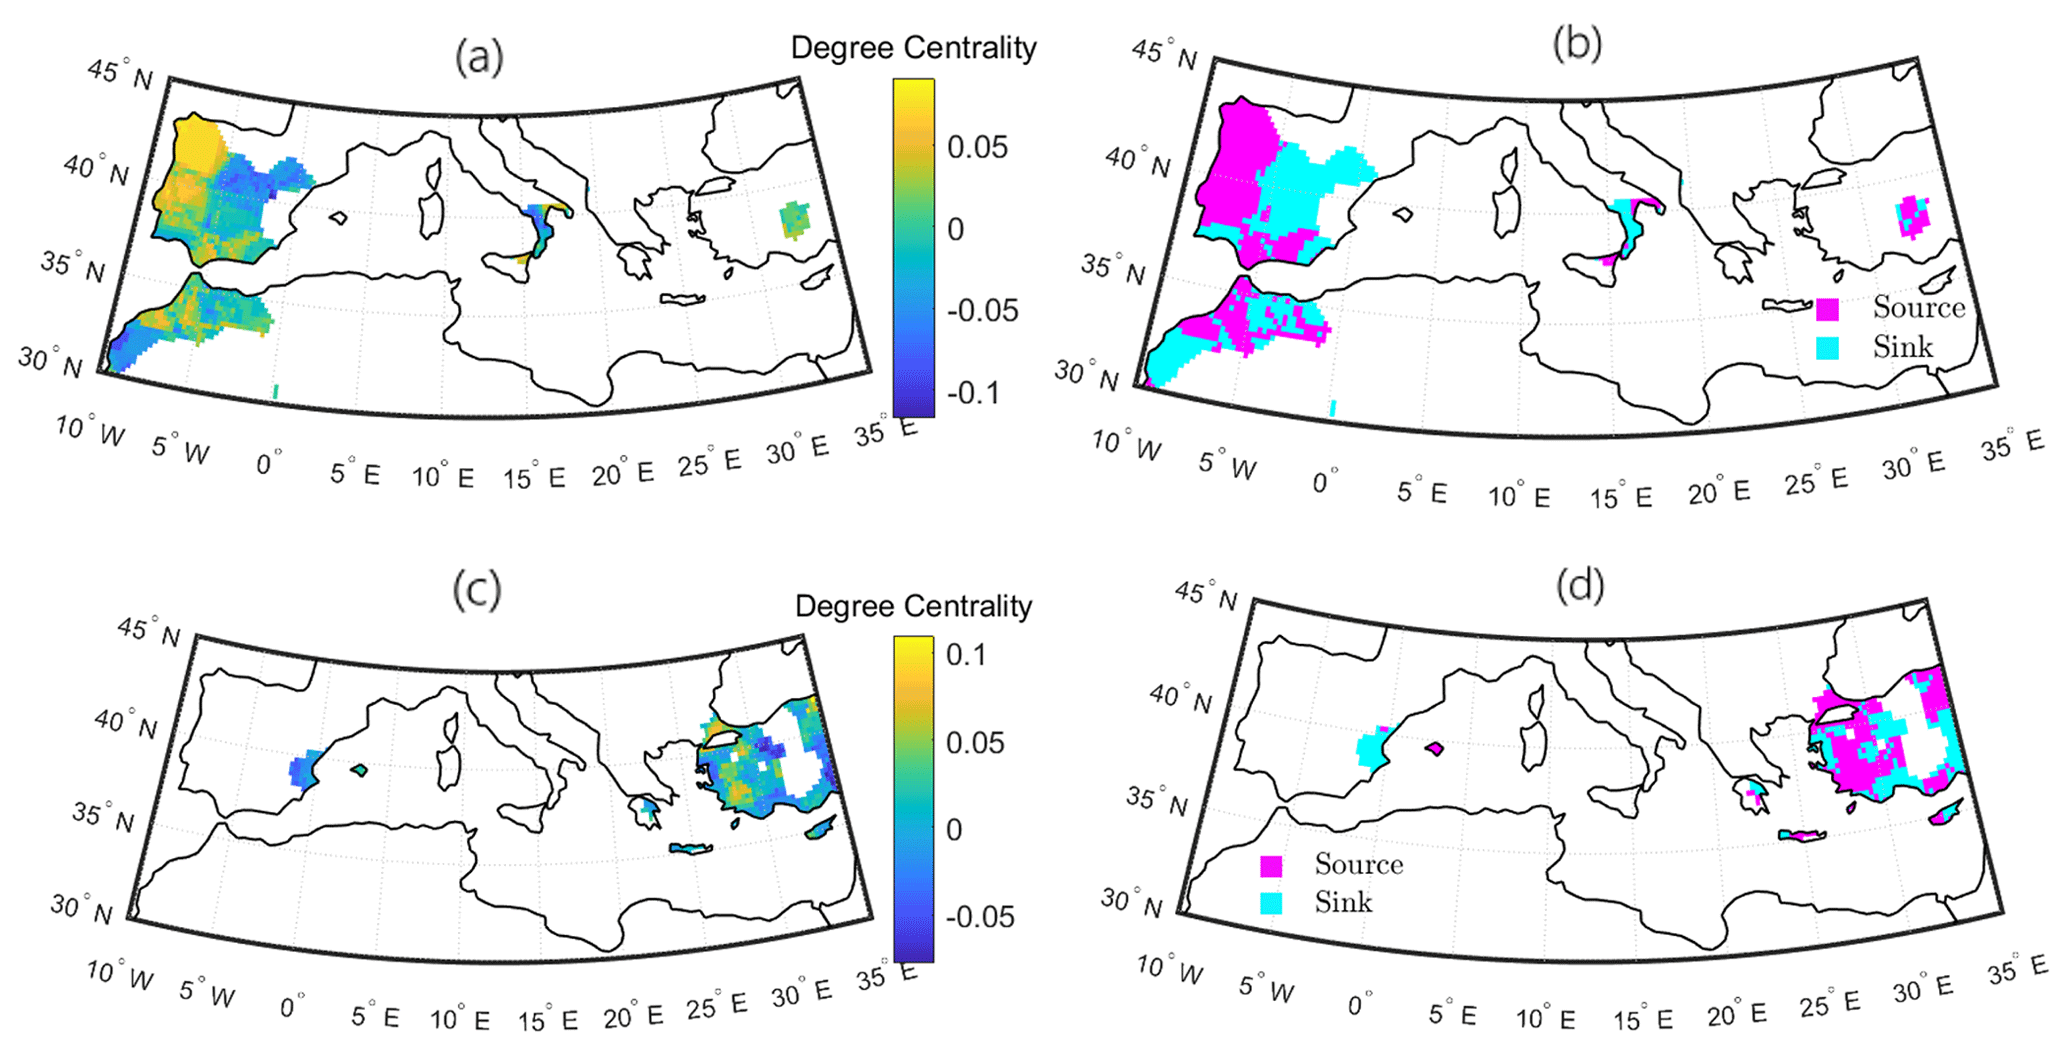
Figure 7Two regional spatial networks from the SPI-9 Europe meteorological drought network. Degree centrality (a, c) and source–sink system (b, d).
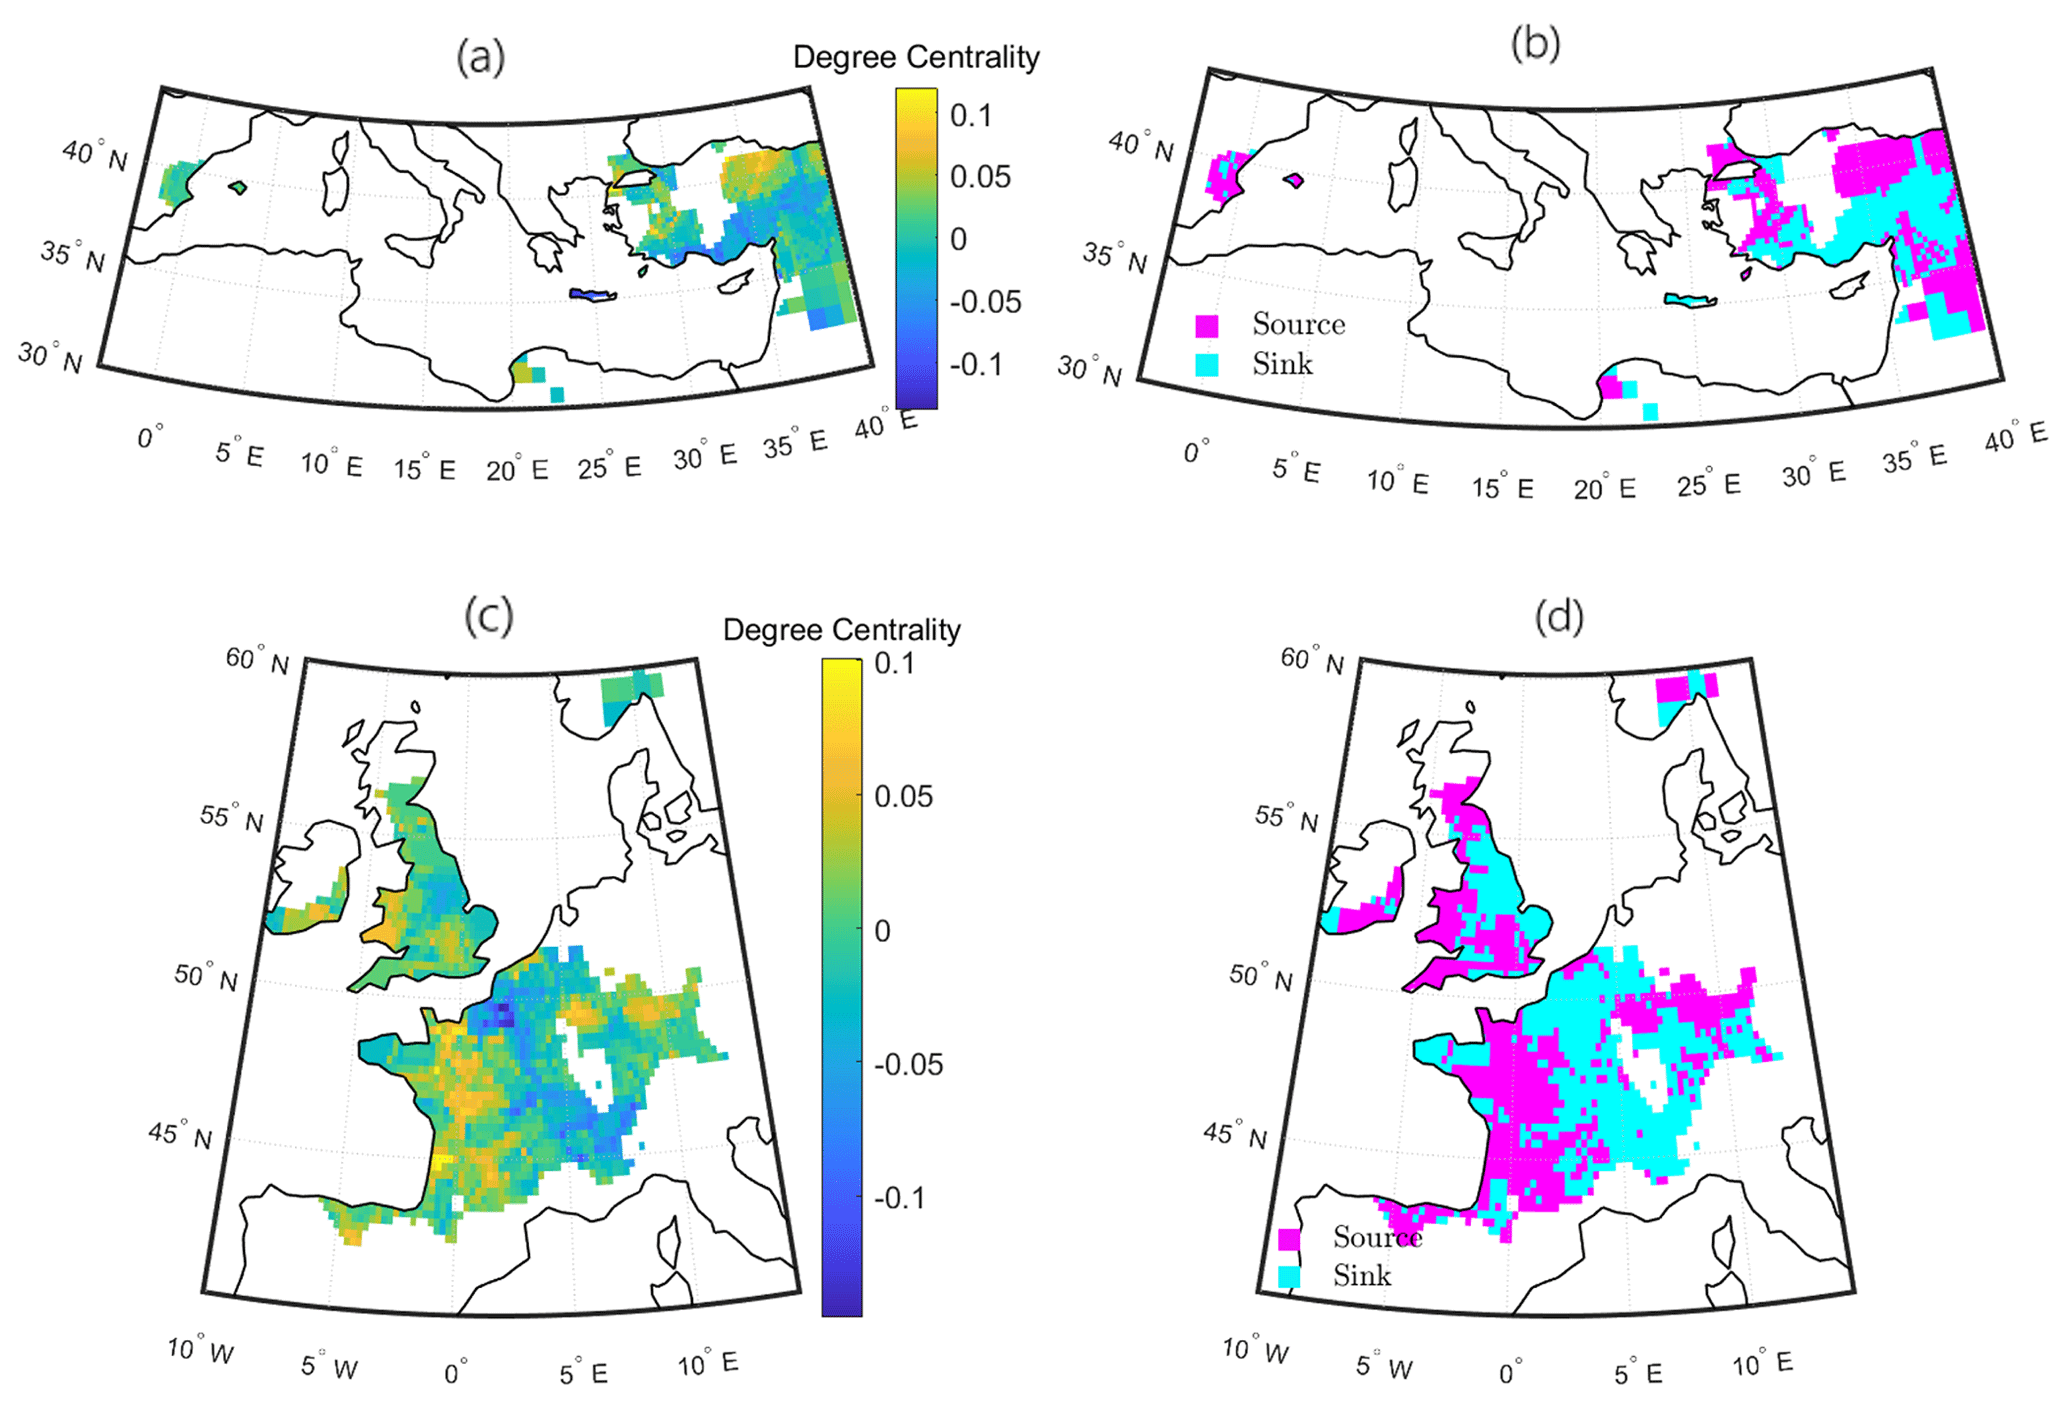
Figure 8Two regional spatial networks from the SPI-12 Europe meteorological drought network. Degree centrality (a, c) and source–sink system (b, d).
For the SPI-9 network we show two communities which are somehow complementary to each other (Fig. 7): the first one (Fig. 7a and b) includes the majority of the Iberian Peninsula with a small region of Turkey, while in the second one (Fig. 7c and d) we see the remaining part of Turkey with a small region of Spain. The only difference between the two communities, which may cause the distinction of this two regional clusters, is the fact that in the first case a portion of northern Africa and south Italy come into the picture as well. Looking at these two examples, we highlight two main features: (i) Portugal is still a big source (Fig. 7a and b), as happened in the SPI-3 case, and (ii) long connections strongly contribute to shaping the clusters' landscape, linking distant regions which are not generally related to the short accumulation periods' networks. This latter characteristic is even accentuated in the SPI-12 community structures. In Fig. 8 we show two examples taken from this last network. In the first one (Fig. 8a and b) we see a community very similar to the one seen in Fig. 7c: the majority of Turkey is still connected to the same nodes of eastern Spain, but, differently from before, this time the Spanish region is a source for the rest of the community. This shows that the same nodes may play different roles in different accumulation periods: in fact, they may belong to different communities, or, as this latter examples show, they can still be part of similar clusters but with a shift in the proportion of incoming links versus outgoing ones. As we already pointed out previously, the presence of long links in higher accumulation period networks contributes to connecting distant regions in longitudinal direction more than latitudinally, and the reason may lie in the propagation of Rossby waves. In Fig. 8c and d there is a clear vertical separation in the source–sink system: the west part of both Great Britain and France is a source for the eastern regions of these two territories. The cluster also includes a small region of the Scandinavian Peninsula. The role of western France as a source for the eastern part of the country seems to be confirmed by the increasing trend in meteorological drought events in this region, as reported in Spinoni et al. (2016) too. Vidal et al. (2010) also show that the majority of meteorological drought events at the 12-month timescale are located over the south and the eastern coast of France. As for Great Britain, the north and the central and southern part of the country consistently belong to different clusters in the SPI-6, 9, and 12 networks (see Fig. 3). This could be related to the NAO's impact in the UK, with positive correlation to precipitation in the north and negative in the south (Rahiz and New, 2012). Moreover, the source's role of Wales and south England displayed here (Fig. 8d) is consistent with previous studies (Phillips and McGregor, 1998; Fowler and Kilsby, 2002).
Finally, we point out that every region has its own precipitation regime, which is in turn affected by different atmospheric processes and patterns, whose influence also changes according to the specific timescale. For this reason, each of the showed regional source–sink system should be studied separately in the future in more detail.
In this study we propose a method to build robust climate networks from data and to identify meteorological drought regions and related source–sink systems in Europe.
Our networks are based on the synchronicity of droughts' occurrences within a season and are constructed based on the Standardized Precipitation Index for four accumulation periods, 3, 6, 9, and 12 months, highlighting similarities and differences between them. The features of meteorological droughts for different timescales have never been investigated before through the lens of network theory. Here, we find that long connections play a crucial role in shaping drought regions and become more and more important when long accumulations are considered. This suggests that, while short periods of precipitation's deficiency (1 to 6 months) tend to evolve in confined regions, long-lasting droughts (9 to 12 months) are likely to propagate across large portions of the continent. Short meteorological drought events could be driven by regional climate systems, while long ones could be driven by large-scale patterns, like Rossby waves, but further studies are needed to better clarify the atmospheric precursors of these long connections.
The Hamming procedure that we introduce here offers a new way to reduce the uncertainty of link attribution in unweighted and undirected networks reconstruction from raw data, when there is no previous knowledge about the system under study. This method could be potentially applied to different areas of study and also be extended to weighted and directed graphs. From these more reliable continental networks, we uncover regional communities by applying the Louvain algorithm, a well recognized method for cluster identification. We believe that this way of partitioning a certain geographical area via network theory concepts could be helpful in climate region identification, shaping them not via external classification or general climatic variables but based on the specific climate process under study.
Meteorological drought regions are separately studied identifying source–sink systems. These systems highlight the spatial patterns along which the drought events have developed on average during the period 1980–2020. Moreover, they could be a useful tool to use in forecasting these events in the sink nodes when the sources experience a drought condition.
Starting from two event series i and j, an event l that occurs at i at time is considered to be synchronized with an event m that occurs at j at time if , where
Notice that we set a maximum time lag of 4 months above which the possible synchronizations between two nodes are disregarded. This means that the synchronicity between two locations is considered as such if it happens at most in the timescale of a season.
A score is assigned for every couple of events l and m in i and j according to the following rule:
Finally, the number of times an event appears in i shortly after it occurs in j is counted
where L and M are the total number of events in i and j, respectively. The symmetrical Qij and the antisymmetrical qij synchronization scores are then defined as follows
The symmetrical score is suited for undirected networks, while the antisymmetrical one contains the additional information of the overall direction of the synchronicity between i and j: if there is a majority of events happening at i after they appear at j compared to how many develop at j after taking place at i, then qij will be positive, with the link's direction from j to i. Vice versa, the sign will be negative, with the direction of the link from i to j. The value of the antisymmetrical score represents the percentage of times that the j's events precede i's (or vice versa, depending on the sign) and serves as a weight of the link. It can be interpreted as the most frequentist probability of observing an event happening at i (during the next 4 months) given that an event has happened at node j. It is possible to organize the synchronicity measures between each pair of nodes in an N×N matrix, where N is the number of nodes our spatial domain is discretized into. Each entry of the matrix lies between 0 and 1 and represents the strength of synchronization of node i and j. In principle, the synchronization between a node with itself is equal to 1, but we set it to 0 since self-loops are not meaningful in this context. We use qij for the weighted and directed community-specific networks, while Qij is used for the four continental graphs. In this latter case, we even pass to an unweighted representation, recovering the adjacency matrix A by preserving only the links with a synchronization score Qij greater than a certain threshold θ:
The choice of the threshold is conducted via the Hamming distance procedure.
We divide the complete 1981–2020 dataset into two sub-databases, one from 1981 to 2000 and another from 2001 to 2020. Then, we build one sub-network for each of the two time interval and for every possible cutoff threshold in terms of percentage of strongest preserved links (from 1 to 100). Notice that the two sub-databases are independent from each other, deriving from observations sampled in different periods of time.
Hence, we obtain 200 different undirected and unweighted drought networks from Europe. Since our aim is to build a single network as representative as possible of Europe's base meteorological drought conditions for the whole period of 1981–2020, we assume the differences between the two sub-networks 1981–2000 and 2001–2020 to be minimum, since they are reproducing the same processes using independent data. In other words, if two locations i and j are drought-synchronized, this should result in both sub-networks. The underlying assumption we make here is that even if the frequency and duration of meteorological drought events may be changing due to climate change, the physical mechanism that shapes the locations' synchronization in drought event occurrences does not change in time, and the resulting spatial structure modeled with the climate network remains reasonably stable.
For every cutoff threshold we count the differences between the two sub-networks via the Hamming distance, which measures the global probability of non-equal entries in the two adjacency matrices:
where
The procedure is depicted in Fig. B1. The Hamming distance is not the only possible choice to compare the topology of two networks (Zager and Verghese, 2008; Ullmann, 1976; Fernández and Valiente, 2001). The reason why we have chosen this metric over the others is threefold: the networks we are comparing are undirected and unweighted and have the same link density. For this specific case, this method gives a sufficiently informative result, and it is also computationally very easy. For more complicated scenarios, one should look into other more refined graph edit distances (Gao et al., 2010) or into spectral methods (Jurman et al., 2011) to capture the changes of a graph as a whole.
Even if we expect the two sub-networks to be similar for each cutoff threshold, they can never be identical due to noise and climate's internal variability. Therefore, we select the one for which the Hamming distance is below 5 % as the definitive cutoff threshold θdef:
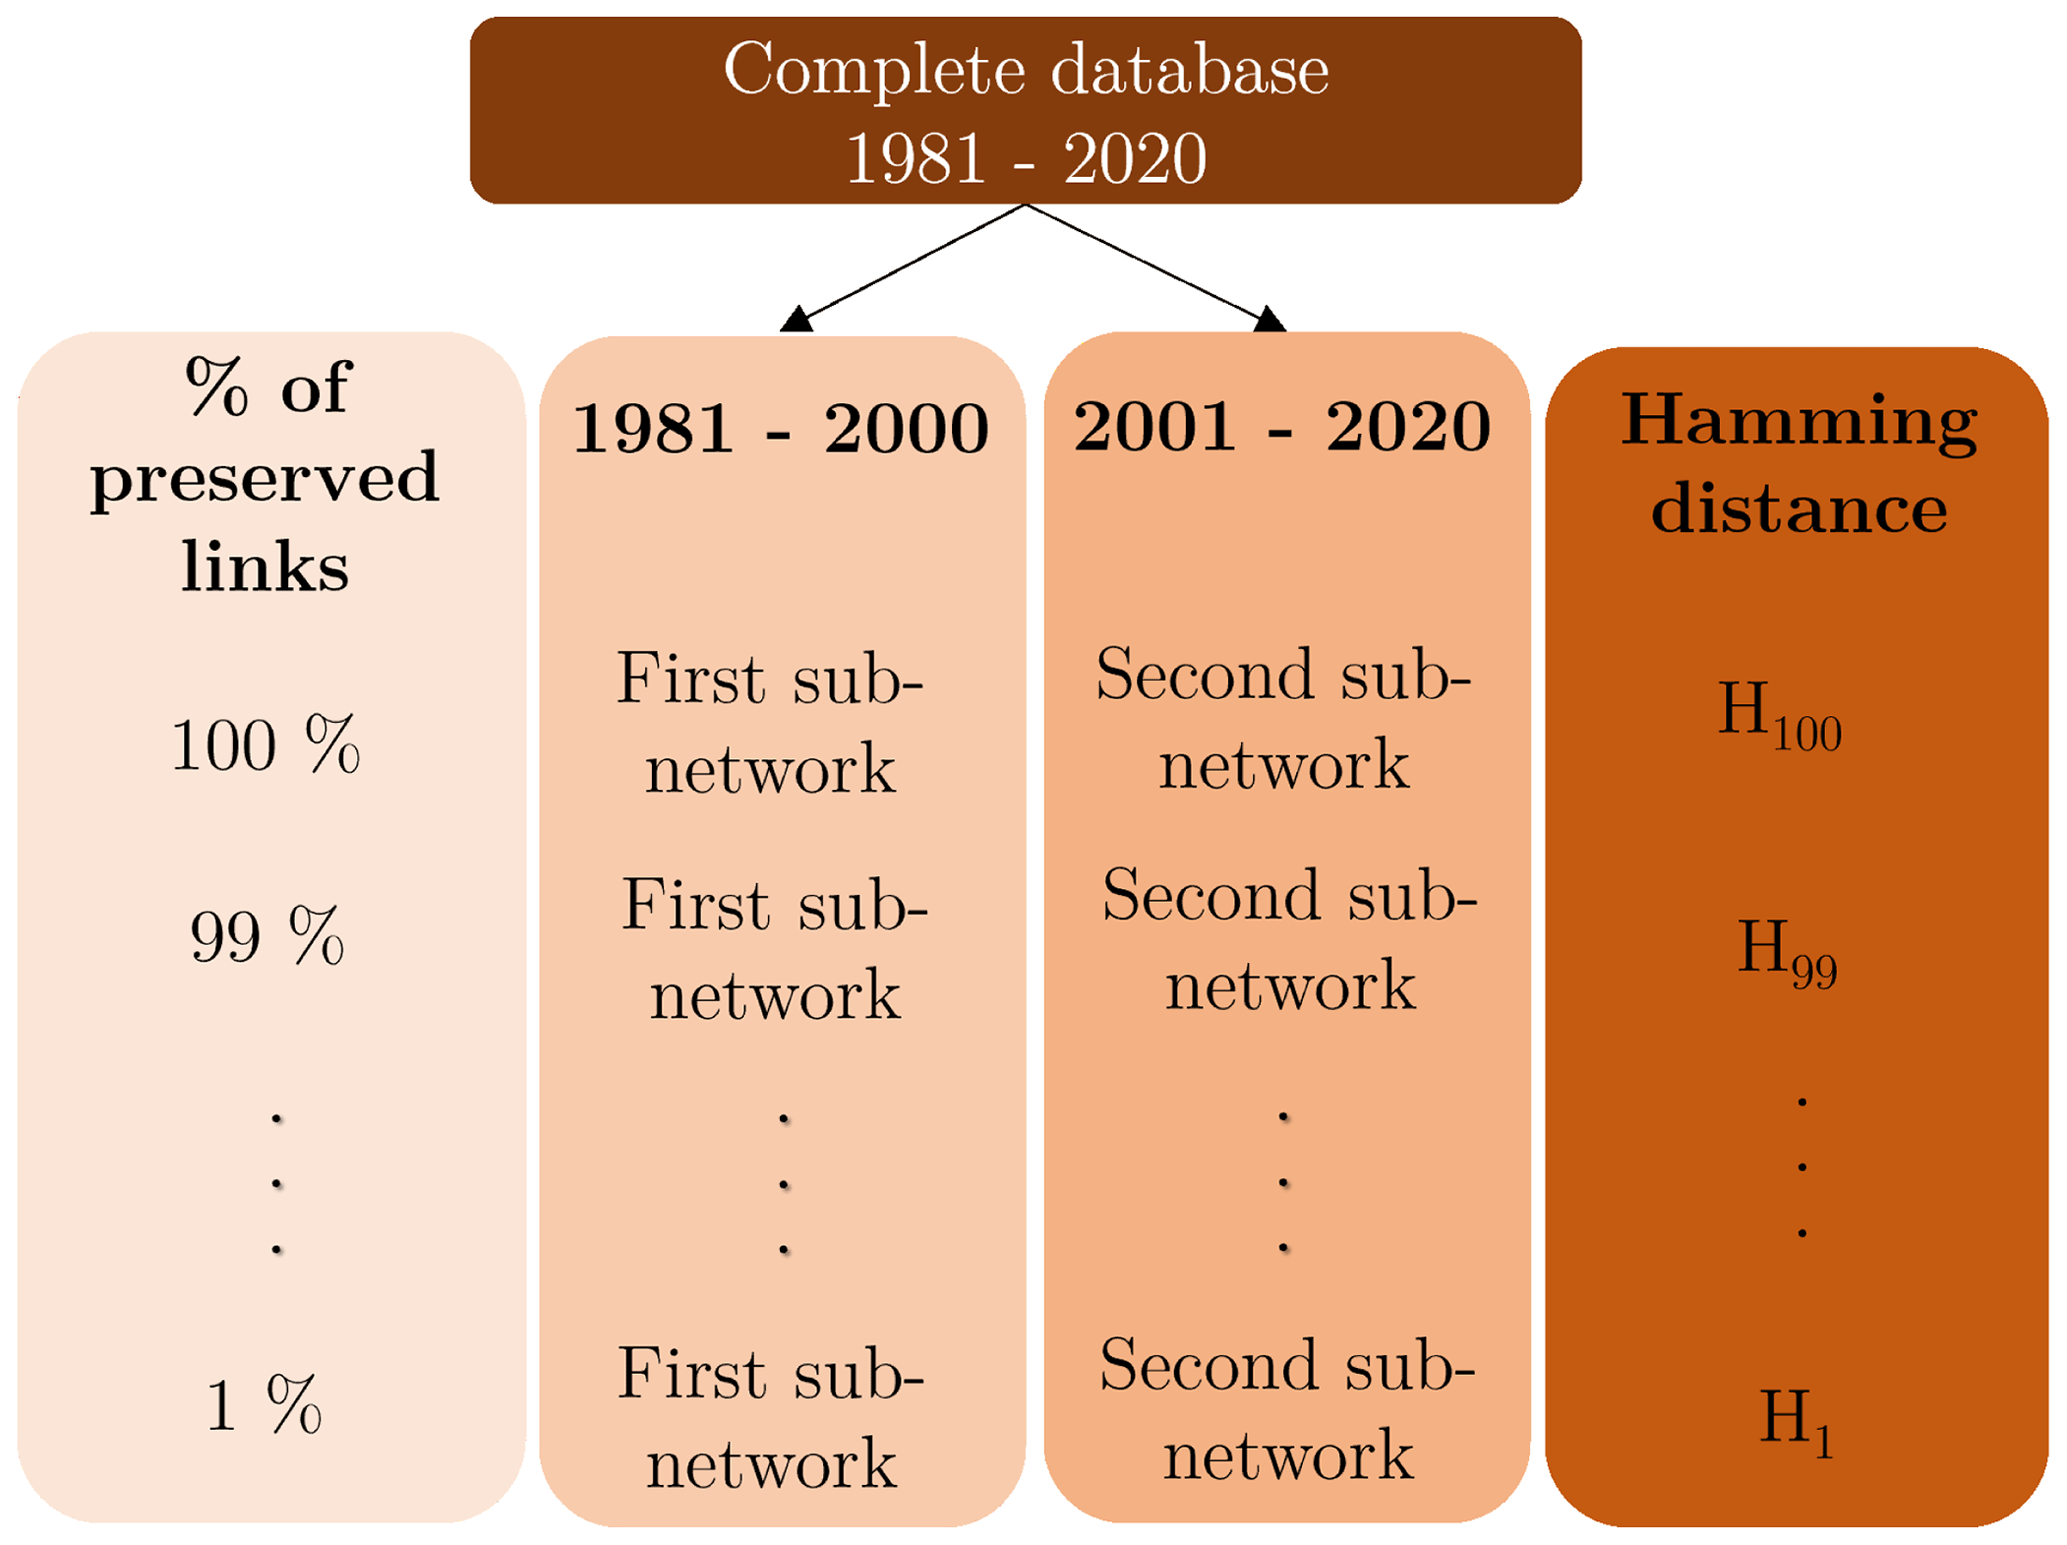
Figure B1Procedure to select the percentage of strongest links to preserve. The original database is split symmetrically into two sub-databases. For each of them and for every cutoff threshold, an undirected and unweighted event synchronization network is constructed. Every pair of sub-networks is used to compute the Hamming distance.
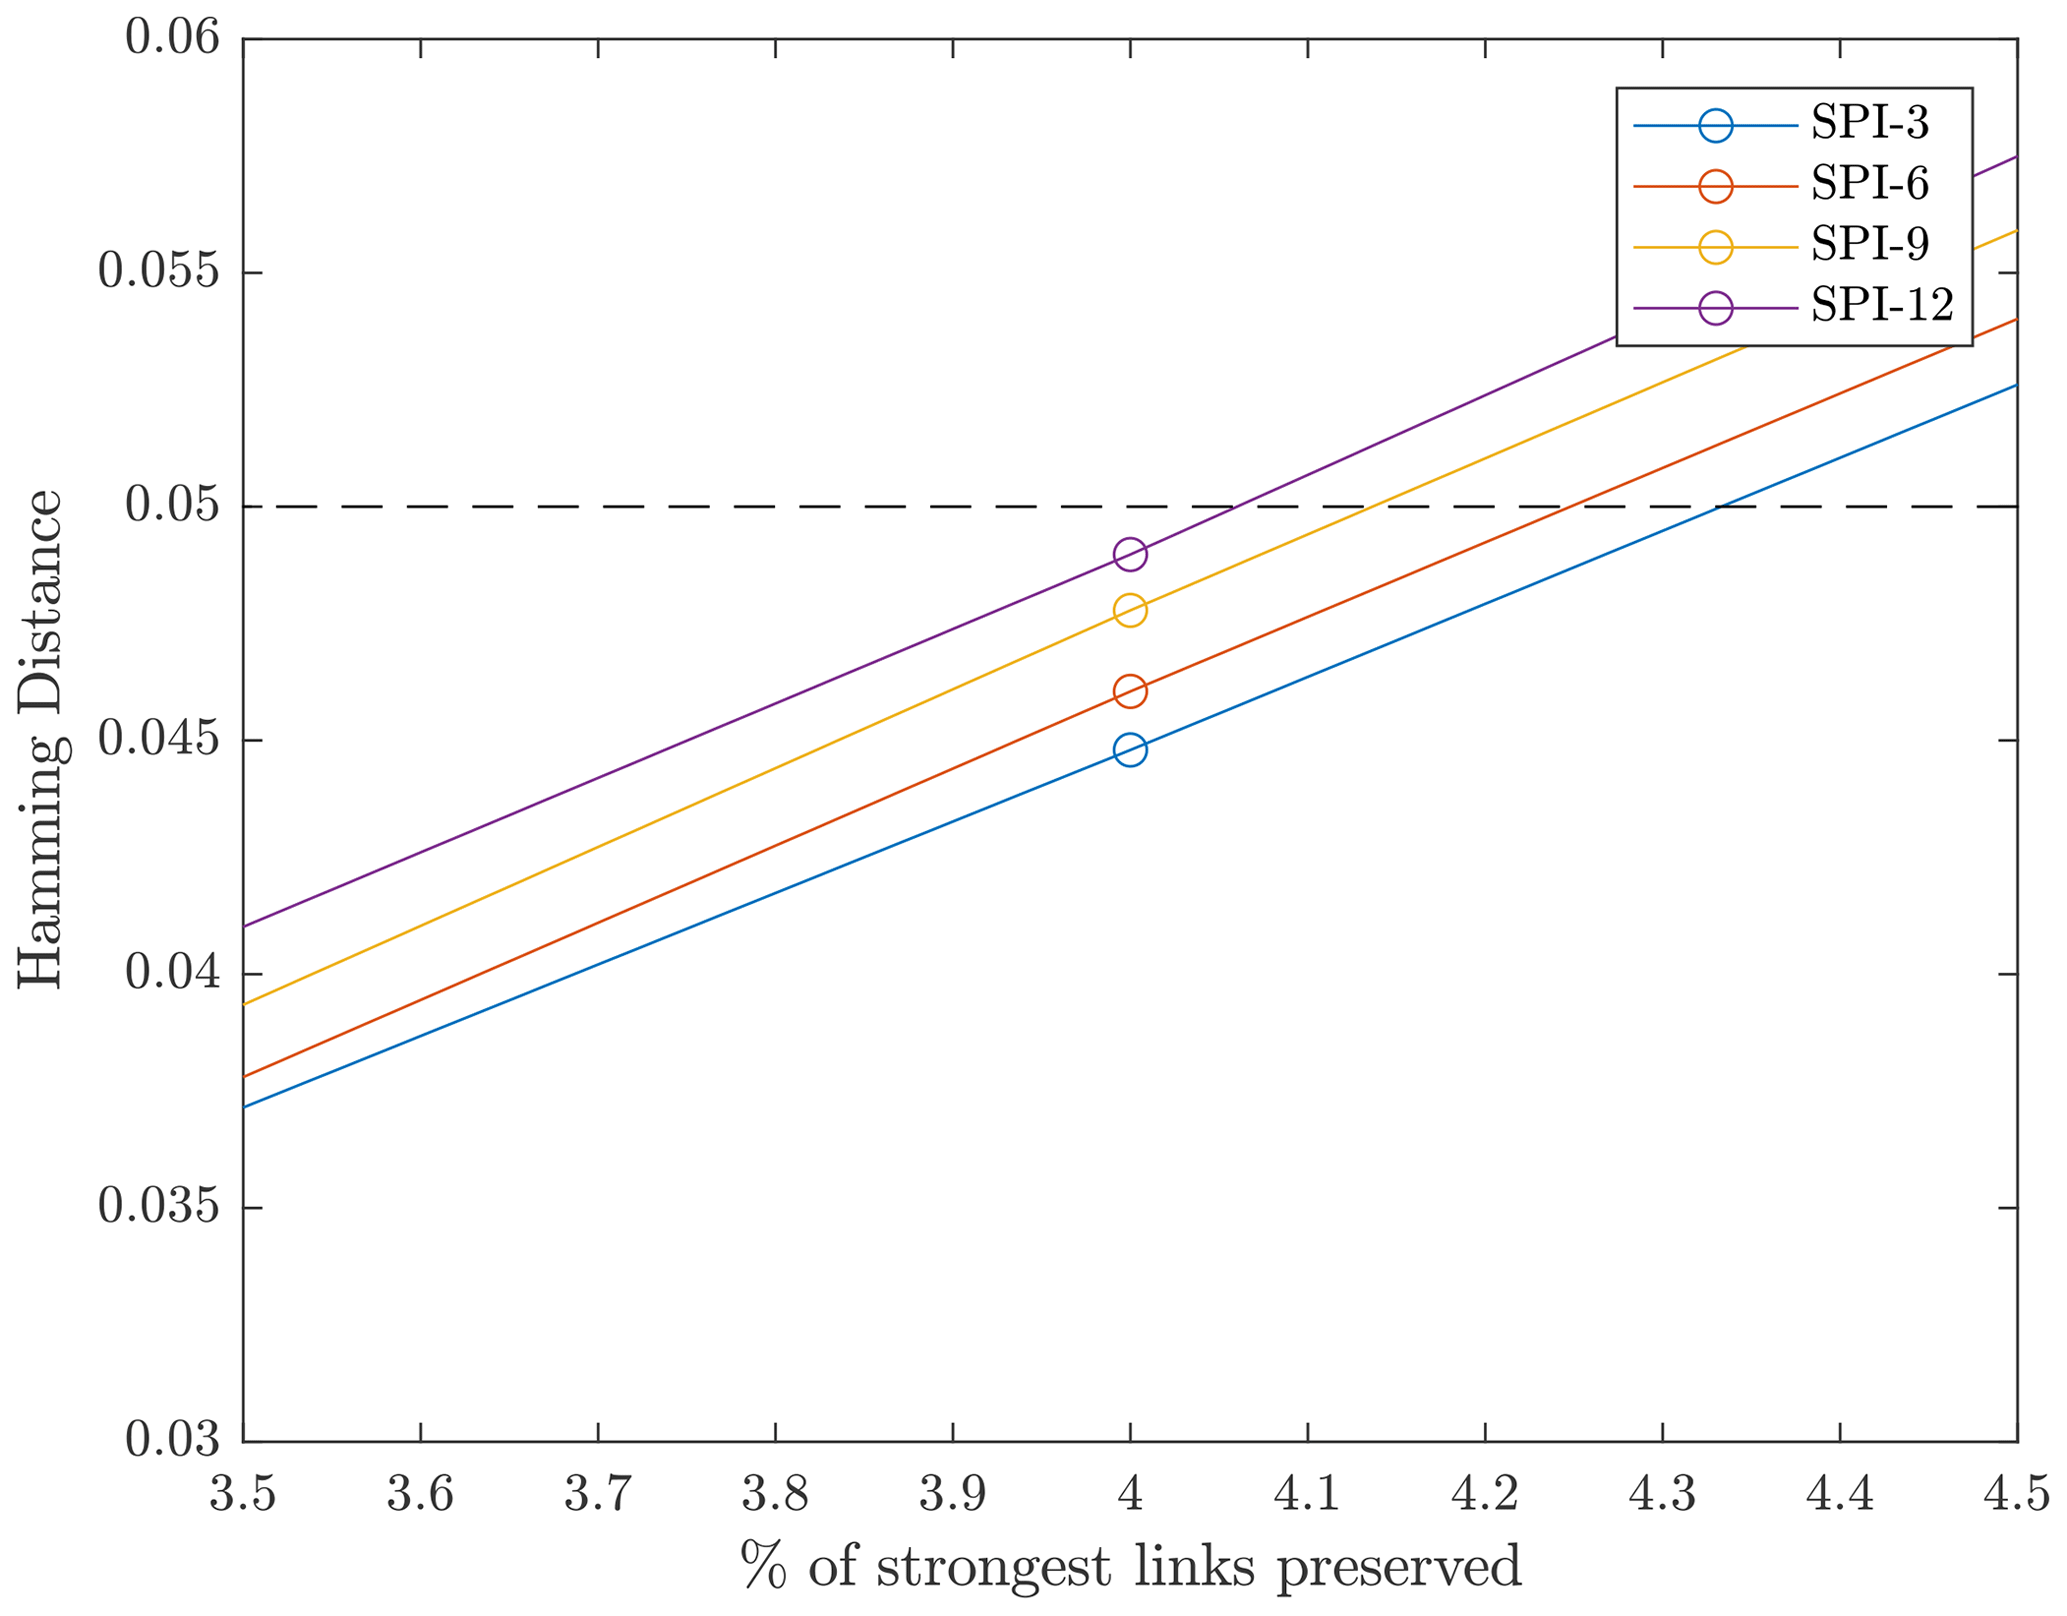
Figure B2The Hamming distance as a function of the percentage of strongest link preserved. By choosing the 96th percentile as cutoff threshold (preserving the top 4 % of links), the differences between the two sub-networks are below 5 % in each of the four cases.
This requirement is satisfied for each of the four continental networks if we preserve the top 4 % of links (Fig. B2). Consequently, an unweighted and undirected link is placed every time the value of synchronization between two nodes is above the 96th percentile. We want this threshold to be the same for the four cases in order to compare the resulting networks, which are characterized this way by approximately the same link density.
The definitive continental networks are therefore constructed in this way for each of the four accumulation periods: (a) two undirected and unweighted sub-networks are retrieved from the data 1981–2000 and 2001–2020, respectively, taking the 96th percentile as cutoff threshold, and (b) the two sub-networks are intersected, taking only the common links between the two to form the final 1981–2020 Europe meteorological drought network.
This work does not include any externally supplied code. All material in the text and figures was produced using mathematical and numerical analysis by the authors as described in the text in the Sect. 2, “Data and methodology”, and in Appendix A and Appendix B. Analysis code is available from the authors on request.
The SPI-3, SPI-6, SPI-9, and SPI-12 datasets used in this study are publicly accessible and provided by the European Drought Observatory at https://edo.jrc.ec.europa.eu (last access: 1 June 2023) © European Commission – JRC, 2012–2023. For the SPI-3 dataset, please refer to http://data.europa.eu/89h/0ae4cbf0-55f1-4aee-b1ae-a5317b264072 (European Commission, Joint Research Centre, 2021a). For the SPI-6 dataset, please refer to http://data.europa.eu/89h/566c45e3-6372-4ee1-939a-145709b54102 (European Commission, Joint Research Centre, 2021b). For the SPI-9 dataset, please refer to http://data.europa.eu/89h/fe44b1d1-ea3a-4519-92f1-af264b34a7b8 (European Commission, Joint Research Centre, 2021c). For the SPI-12 dataset, please refer to http://data.europa.eu/89h/4d64a2d4-d245-4a2e-bc97-197c8146f1d1 (European Commission, Joint Research Centre, 2021d).
All authors contributed to planning the work and writing and editing the manuscript.
The contact author has declared that none of the authors has any competing interests.
Publisher's note: Copernicus Publications remains neutral with regard to jurisdictional claims in published maps and institutional affiliations.
This paper was edited by Stéphane Vannitsem and reviewed by two anonymous referees.
Agarwal, A., Marwan, N., Rathinasamy, M., Merz, B., and Kurths, J.: Multi-scale event synchronization analysis for unravelling climate processes: a wavelet-based approach, Nonlin. Processes Geophys., 24, 599–611, https://doi.org/10.5194/npg-24-599-2017, 2017. a
Bastos, A., Fu, Z., Ciais, P., Friedlingstein, P., Sitch, S., Pongratz, J.,Weber, U., Reichstein, M., Anthoni, P., Arneth, A., Haverd, V., Jain, A., Joetzjer, E., Knauer, J., Lienert, S., Loughran, T., McGuire, P. C., Obermeier, W., Padrón, R. S., Shi, H., Tian, H., Viovy N., and Zaehle, S.: Impacts of extreme summers on European ecosystems: a comparative analysis of 2003, 2010 and 2018, Philos. T. R. Soc.. B, 375, 20190507, https://doi.org/10.1098/rstb.2019.0507, 2020. a
Beillouin, D., Schauberger, B., Bastos, A., Ciais, P., and Makowski, D.: Impact of extreme weather conditions on European crop production in 2018, Philos. T. R. Soc.. B, 375, 20190510, https://doi.org/10.1098/rstb.2019.0510, 2020. a
Benito, G., Machado, M. J., and Pérez-González, A.: Climate change and flood sensitivity in Spain, Geological Society, London, Special Publications, 115, 85–98, 1996. a
Bevacqua, A. G., Chaffe, P. L., Chagas, V. B., and AghaKouchak, A.: Spatial and temporal patterns of propagation from meteorological to hydrological droughts in Brazil, J. Hydrol., 603, 126902, https://doi.org/10.1016/j.jhydrol.2021.126902, 2021. a
Blondel, V. D., Guillaume, J.-L., Lambiotte, R., and Lefebvre, E.: Fast unfolding of communities in large networks, J. Stat. Mech. Theory E., 2008, P10008, https://doi.org/10.1088/1742-5468/2008/10/P10008, 2008. a
Boccaletti, S., Latora, V., Moreno, Y., Chavez, M., and Hwang, D.-U.: Complex networks: Structure and dynamics, Phys. Rep., 424, 175–308, 2006. a
Boers, N., Bookhagen, B., Marwan, N., Kurths, J., and Marengo, J.: Complex networks identify spatial patterns of extreme rainfall events of the South American Monsoon System, Geophys. Res. Lett., 40, 4386–4392, 2013. a
Boers, N., Goswami, B., Rheinwalt, A., Bookhagen, B., Hoskins, B., and Kurths, J.: Complex networks reveal global pattern of extreme-rainfall teleconnections, Nature, 566, 373–377, 2019. a, b, c, d
Böhnisch, A., Mittermeier, M., Leduc, M., and Ludwig, R.: Hot Spots and Climate Trends of Meteorological Droughts in Europe–Assessing the Percent of Normal Index in a Single-Model Initial-Condition Large Ensemble, Frontiers in Water, 3, 716621, https://doi.org/10.3389/frwa.2021.716621, 2021. a, b
Bueh, C. and Nakamura, H.: Scandinavian pattern and its climatic impact, Q. J. Roy. Meteor. Soc., 133, 2117–2131, 2007. a
Ciemer, C., Rehm, L., Kurths, J., Donner, R. V., Winkelmann, R., and Boers, N.: An early-warning indicator for Amazon droughts exclusively based on tropical Atlantic sea surface temperatures, Environ. Res. Lett., 15, 094087, https://doi.org/10.1088/1748-9326/ab9cff, 2020. a, b
Cook, B. I., Mankin, J. S., Marvel, K., Williams, A. P., Smerdon, J. E., and Anchukaitis, K. J.: Twenty-first century drought projections in the CMIP6 forcing scenarios, Earths Future, 8, e2019EF001461, https://doi.org/10.1029/2019EF001461, 2020. a
Donges, J. F., Zou, Y., Marwan, N., and Kurths, J.: The backbone of the climate network, Europhys. Lett., 87, 48007, https://doi.org/10.1209/0295-5075/87/48007, 2009. a
Doughty, C. E., Metcalfe, D., Girardin, C., Amézquita, F. F., Cabrera, D. G., Huasco, W. H., Silva-Espejo, J., Araujo-Murakami, A., Da Costa, M., Rocha, W., Feldpausch, T. R., Mendoza, A. L. M., da Costa, A. C. L., Meir, P., Phillips, O. L., and Malhi, Y.: Drought impact on forest carbon dynamics and fluxes in Amazonia, Nature, 519, 78–82, 2015. a
EDO: Standardized Precipitation Index (SPI), Tech. Rep., European Drought Observatory, Copernicus European Drought Observatory (EDO), https://edo.jrc.ec.europa.eu/ (last access: 1 June 2023), 2020. a, b, c
Edwards, D. C.: Characteristics of 20th Century drought in the United States at multiple time scales, Tech. rep., Air Force Inst of Tech, Wright-Patterson AFB, OH, 1997. a
European Commission, Joint Research Centre (JRC): EDO Standardized Precipitation Index, 3-month accumulation period (SPI-3), blended and interpolated (version 1.2.0), European Commission, Joint Research Centre (JRC) [data set], http://data.europa.eu/89h/0ae4cbf0-55f1-4aee-b1ae-a5317b264072 (last access: 1 June 2023), 2021. a
European Commission, Joint Research Centre (JRC): EDO Standardized Precipitation Index, 6-month accumulation period (SPI-6), blended and interpolated (version 1.2.0), European Commission, Joint Research Centre (JRC) [data set], http://data.europa.eu/89h/566c45e3-6372-4ee1-939a-145709b54102 (last access: 1 June 2023), 2021b. a
European Commission, Joint Research Centre (JRC): EDO Standardized Precipitation Index, 9-month accumulation period (SPI-9), blended and interpolated (version 1.2.0), European Commission, Joint Research Centre (JRC) [data set], http://data.europa.eu/89h/fe44b1d1-ea3a-4519-92f1-af264b34a7b8 (last access: 1 June 2023), 2021c. a
European Commission, Joint Research Centre (JRC): EDO Standardized Precipitation Index, 12-month accumulation period (SPI-12), blended and interpolated (version 1.2.0), European Commission, Joint Research Centre (JRC) [data set], http://data.europa.eu/89h/4d64a2d4-d245-4a2e-bc97-197c8146f1d1 (last access: 1 June 2023), 2021d. a
Fan, J., Meng, J., Ludescher, J., Chen, X., Ashkenazy, Y., Kurths, J., Havlin, S., and Schellnhuber, H. J.: Statistical physics approaches to the complex Earth system, Phys. Rep., 896, 1–84, 2021. a, b, c
Feng, X., Merow, C., Liu, Z., Park, D. S., Roehrdanz, P. R., Maitner, B., Newman, E. A., Boyle, B. L., Lien, A., Burger, J. R., Pires, M. M., Brando, P. M., Bush, M. B., McMichael, C. N. H., Neves, D. M., Nikolopoulos, E. I., Saleska, S. R., Hannah, L., Breshears, D. D., Evans, T. P., Soto, J. R., Ernst, K. C., and Enquist, B. J.:: How deregulation, drought and increasing fire impact Amazonian biodiversity, Nature, 597, 516–521, 2021. a
Fernández, M.-L. and Valiente, G.: A graph distance metric combining maximum common subgraph and minimum common supergraph, Pattern Recogn. Lett., 22, 753–758, 2001. a
Fowler, H. and Kilsby, C.: A weather-type approach to analysing water resource drought in the Yorkshire region from 1881 to 1998, J. Hydrol., 262, 177–192, 2002. a
Gao, X., Xiao, B., Tao, D., and Li, X.: A survey of graph edit distance, Pattern Anal. Appl., 13, 113–129, 2010. a
Gupta, S., Boers, N., Pappenberger, F., and Kurths, J.: Complex network approach for detecting tropical cyclones, Clim. Dynam., 57, 3355–3364, 2021. a
Guttman, N. B.: Accepting the standardized precipitation index: a calculation algorithm, J. Am. Water Resour. As., 35, 311–322, 1999. a
Hofstätter, M., Lexer, A., Homann, M., and Blöschl, G.: Large-scale heavy precipitation over central Europe and the role of atmospheric cyclone track types, Int. J. Climatol., 38, e497–e517, 2018. a
Iturbide, M., Gutiérrez, J. M., Alves, L. M., Bedia, J., Cerezo-Mota, R., Cimadevilla, E., Cofiño, A. S., Di Luca, A., Faria, S. H., Gorodetskaya, I. V., Hauser, M., Herrera, S., Hennessy, K., Hewitt, H. T., Jones, R. G., Krakovska, S., Manzanas, R., Martínez-Castro, D., Narisma, G. T., Nurhati, I. S., Pinto, I., Seneviratne, S. I., van den Hurk, B., and Vera, C. S.: An update of IPCC climate reference regions for subcontinental analysis of climate model data: definition and aggregated datasets, Earth Syst. Sci. Data, 12, 2959–2970, https://doi.org/10.5194/essd-12-2959-2020, 2020. a
Jian, L. and Hao-Ming, C.: Atlas in the IPCC AR6, Advances in Climate Change Research, 17, 726–729, 2021. a
Jurman, G., Visintainer, R., and Furlanello, C.: An introduction to spectral distances in networks, in: Proceedings of the 2011 conference on Neural Nets WIRN10: Proceedings of the 20th Italian Workshop on Neural Nets, Vietri sul Mare, Salerno, Italy, 27–29 May 2010, 227–234, 2011. a
Konapala, G., Mondal, S., and Mishra, A.: Quantifying spatial drought propagation potential in North America using complex network theory, Water Resour. Res., 58, e2021WR030914, https://doi.org/10.1029/2021WR030914, 2022. a, b, c
Kurths, J., Agarwal, A., Shukla, R., Marwan, N., Rathinasamy, M., Caesar, L., Krishnan, R., and Merz, B.: Unravelling the spatial diversity of Indian precipitation teleconnections via a non-linear multi-scale approach, Nonlin. Processes Geophys., 26, 251–266, https://doi.org/10.5194/npg-26-251-2019, 2019. a
Lloyd-Hughes, B.: The impracticality of a universal drought definition, Theor. Appl. Climatol., 117, 607–611, 2014. a
Ludescher, J., Martin, M., Boers, N., Bunde, A., Ciemer, C., Fan, J., Havlin, S., Kretschmer, M., Kurths, J., Runge, J., Stolbova, V., Surovyatkina, E., and Schellnhuber, H. J.: Network-based forecasting of climate phenomena, P. Natl. Acad. Sci. USA, 118, e1922872118, https://doi.org/10.1073/pnas.1922872118, 2021. a, b, c
Malik, N., Marwan, N., and Kurths, J.: Spatial structures and directionalities in Monsoonal precipitation over South Asia, Nonlin. Processes Geophys., 17, 371–381, https://doi.org/10.5194/npg-17-371-2010, 2010. a
Malik, N., Bookhagen, B., Marwan, N., and Kurths, J.: Analysis of spatial and temporal extreme monsoonal rainfall over South Asia using complex networks, Clim. Dynam., 39, 971–987, 2012. a
Marinho Ferreira Barbosa, P., Masante, D., Arias-Muñoz, C., Cammalleri, C., De Jager, A., Magni, D., Mazzeschi, M., Mccormick, N., Naumann, G., Spinoni, J., and Vogt, J.: Droughts in Europe and Worldwide 2019–2020, Publications Office of the European Union, Luxembourg, ISBN 978-92-76-38040-5, https://doi.org/10.2760/415204, 2021. a, b
McKee, T. B., Doesken, N. J., and Kleist, J.: The relationship of drought frequency and duration to time scales, in: Proceedings of the 8th Conference on Applied Climatology, Anaheim, USA, 17–22 January, 179–184, 1993. a, b, c, d
Mishra, A. K. and Singh, V. P.: A review of drought concepts, J. Hydrol., 391, 202–216, 2010. a
Mukherjee, S., Mishra, A., and Trenberth, K. E.: Climate change and drought: a perspective on drought indices, Current Climate Change Reports, 4, 145–163, 2018. a
Naumann, G., Cammalleri, C., Mentaschi, L., and Feyen, L.: Increased economic drought impacts in Europe with anthropogenic warming, Nat. Clim. Change, 11, 485–491, 2021. a, b
Newman, M. E.: Modularity and community structure in networks, P. Natl. Acad. Sci. USA, 103, 8577–8582, 2006. a
Phillips, I. D. and McGregor, G. R.: The utility of a drought index for assessing the drought hazard in Devon and Cornwall, South West England, Meteorol. Appl., 5, 359–372, 1998. a
Quiroga, R. Q., Kreuz, T., and Grassberger, P.: Event synchronization: a simple and fast method to measure synchronicity and time delay patterns, Phys. Rev. E, 66, 041904, https://doi.org/10.1103/PhysRevE.66.041904, 2002. a
Rahiz, M. and New, M.: Spatial coherence of meteorological droughts in the UK since 1914, Area, 44, 400–410, 2012. a
Sariş, F., Hannah, D. M., and Eastwood, W. J.: Spatial variability of precipitation regimes over Turkey, Hydrolog. Sci. J., 55, 234–249, 2010. a
Seneviratne, S. I., Nicholls, N., Easterling, D., Goodess, C. M., Kanae S., Kossin, J., Luo, Y., Marengo, J., McInnes, K., Rahimi, M., Reichstein, M., Sorteberg, A., Vera, C., and Zhang, X.: Changes in Climate Extremes and Their Impacts on the Natural Physical Environment. Managing the Risks of Extreme Events and Distasters to Advance Climate Change Adaptation, A Special Report of Working Groups I and II of the Intergovernmental Panel on Climate Change (IPCC), Cambridge University Press, Cambridge, https://doi.org/10.7916/d8-6nbt-s431, 2012. a
Spinoni, J., Naumann, G., Vogt, J. V., and Barbosa, P.: The biggest drought events in Europe from 1950 to 2012, Journal of Hydrology: Regional Studies, 3, 509–524, 2015. a
Spinoni, J., Naumann, G., Vogt, J., and Barbosa, P.: Meteorological Droughts in Europe: Events and Impacts: Past Trends and Future Projections, JRC100394, Publications Office of the European Union, Luxembourg, 2016. a, b, c, d, e
Spinoni, J., Naumann, G., and Vogt, J. V.: Pan-European seasonal trends and recent changes of drought frequency and severity, Global Planet. Change, 148, 113–130, 2017. a
Spinoni, J., Vogt, J. V., Naumann, G., Barbosa, P., and Dosio, A.: Will drought events become more frequent and severe in Europe?, Int. J. Climatol., 38, 1718–1736, 2018. a, b, c, d
Spinoni, J., Marinho Ferreira Barbosa, P., Bucchignani, E., Cassano, J., Cavazos, T., Cescatti, A., Christensen, J., Christensen, O., Coppola, E., Evans, J., Forzieri, G., Geyer, B., Giorgi, F., Jacob, D., Katzfey, J., Koenigk, T., Laprise, R., Lennard, C., Levent Kurnaz, M., Li, D., Llopart, M., Mccormick, N., Naumann, G., Nikulin, G., Ozturk, T., Panitz, H., Porfirio Da Rocha, R., Solman, S., Syktus, J., Tangang, F., Teichmann, C., Vautard, R., Vogt, J., Winger, K., Zittis, G., and Dosio, A.: Global exposure of population and land-use to meteorological droughts under different warming levels and SSPs: a CORDEX-based study, Int. J. Climatol., 41, 6825–6853, 2021. a
Stolbova, V., Martin, P., Bookhagen, B., Marwan, N., and Kurths, J.: Topology and seasonal evolution of the network of extreme precipitation over the Indian subcontinent and Sri Lanka, Nonlin. Processes Geophys., 21, 901–917, https://doi.org/10.5194/npg-21-901-2014, 2014. a, b
Strnad, F. M., Schloer, J., Geen, R., Boers, N., and Goswami, B.: Extreme rainfall propagation within Boreal Summer Intraseasonal Oscillation modulated by Pacific sea surface temperature, arXiv [physics.ao-ph], arXiv:2302.00425, 2023. a
Taufik, M., Torfs, P. J., Uijlenhoet, R., Jones, P. D., Murdiyarso, D., and Van Lanen, H. A.: Amplification of wildfire area burnt by hydrological drought in the humid tropics, Nat. Clim. Change, 7, 428–431, 2017. a
Tsonis, A. A., Swanson, K. L., and Roebber, P. J.: What do networks have to do with climate?, B. Am. Meteorol. Soc., 87, 585–596, 2006. a, b
Tsonis, A. A., Swanson, K. L., and Wang, G.: On the role of atmospheric teleconnections in climate, J. Climate, 21, 2990–3001, 2008. a
Ullmann, J. R.: An algorithm for subgraph isomorphism, J. ACM, 23, 31–42, 1976. a
Vicente-Serrano, S. M., Domínguez-Castro, F., Murphy, C., Hannaford, J., Reig, F., Peña-Angulo, D., Tramblay, Y., Trigo, R. M., Mac Donald, N., Luna, M. Y., McCarthy, M., Van der Schrier, G., Turco, M., Camuffo, D., Noguera, I., García-Herrera, R., Becherini, F., Della Valle, A., Tomas-Burguera, M., and Kenawy, A.: Long-term variability and trends in meteorological droughts in Western Europe (1851–2018), Int. J. Climatol., 41, E690–E717, 2021. a, b, c, d, e, f
Vidal, J.-P., Martin, E., Franchistéguy, L., Habets, F., Soubeyroux, J.-M., Blanchard, M., and Baillon, M.: Multilevel and multiscale drought reanalysis over France with the Safran-Isba-Modcou hydrometeorological suite, Hydrol. Earth Syst. Sci., 14, 459–478, https://doi.org/10.5194/hess-14-459-2010, 2010. a
Walthall, C. L., Hatfield, J., Backlund, P., Lengnick, L., Marshall, E., Walsh, M., Adkins, S., Aillery, M., Ainsworth, E., Ammann, C., Anderson, C. J., Bartomeus, I., Baumgard, L. H., Booker, F., Bradley, B., Blumenthal, D. M., Bunce, J., Burkey, K., Dabney, S. M., Delgado, J. A., Dukes, J., Funk, A., Garrett, K., Glenn, M., Grantz, D. A., Goodrich, D., Hu, S., Izaurralde, R. C., Jones, R. A. C., Kim, S.-H., Leaky, A. D. B., Lewers, K., Mader, T. L., McClung, A., Morgan, J., Muth, D. J., Nearing, M., Oosterhuis, D. M., Ort, D., Parmesan, C., Pettigrew, W. T., Polley, W., Rader, R., Rice, C., Rivington, M., Rosskopf, E., Salas, W. A., Sollenberger, L. E., Srygley, R., Stöckle, C., Takle, E. S., Timlin, D., White, J. W., Winfree, R., Wright-Morton, L., and Ziska, L. H.: Climate Change and Agriculture in the United States: Effects and Adaptation, USDA Technical Bulletin 1935, Washington, DC, 186 pp., 2013. a
Wehner, M., Seneviratne, S., Zhang, X., Adnan, M., Badi, W., Dereczynski, C., Di Luca, A., Ghosh, S., Iskandar, I., Kossin, J., Lewis, S., Otto, F., Pinto, I., Masaki, S., Vicente-Serrano, S., Zhou, B., Hauser, M., Kirchmeier-Young, M., and Wan, H.: Weather and climate extreme events in a changing climate, in: AGU Fall Meeting 2021, New Orleans, LA, USA, 13–17 December 2021, ID U13B-11, 2021. a
Wei, W., Zhang, J., Zhou, L., Xie, B., Zhou, J., and Li, C.: Comparative evaluation of drought indices for monitoring drought based on remote sensing data, Environ. Sci. Pollut. R., 28, 20408–20425, 2021. a, b
Wilhite, D. A. and Glantz, M. H.: Understanding: the drought phenomenon: the role of definitions, Water Int., 10, 111–120, 1985. a
WMO: Atlas of Mortality and Economic Losses from Weather, Climate and Water Extremes (1970–2019), WMO, WMO-No. 1267, 2021. a, b
Zager, L. A. and Verghese, G. C.: Graph similarity scoring and matching, Appl. Math. Lett., 21, 86–94, 2008. a
Zanin, M., Sousa, P., Papo, D., Bajo, R., García-Prieto, J., del Pozo, F., Menasalvas, E., and Boccaletti, S.: Optimizing functional network representation of multivariate time series, Sci. Rep.-UK, 2, 1–6, 2012. a
Zargar, A., Sadiq, R., Naser, B., and Khan, F. I.: A review of drought indices, Environ. Rev., 19, 333–349, 2011. a
Zhao, T. and Dai, A.: Uncertainties in historical changes and future projections of drought. Part II: model-simulated historical and future drought changes, Climatic Change, 144, 535–548, 2017. a