the Creative Commons Attribution 4.0 License.
the Creative Commons Attribution 4.0 License.
 | 16 Apr 2021
Size distribution law of earthquake-triggered landslides in different seismic intensity zones
Yidan Huang
Lingkan Yao
The Ms 8.0 Wenchuan earthquake in 2008 and Ms 7.0 Lushan earthquake in 2013 produced thousands of landslides in the southern region of the Longmen Mountains in China. We conducted field investigations and analyzed remote sensing data to determine the distribution law of earthquake-triggered landslides. The results show a strong negative power law relationship between the size and frequency of landslides in VII, VIII, and IX seismic intensity zones, a weak power law in the X seismic intensity zone, and a lognormal distribution in the XI seismic intensity zone. Landslide density increases with increasing seismic intensity. A sandpile cellular automata model was built under the conceptual framework of self-organized criticality theory to simulate earthquake-induced landslides. Data from the simulations demonstrate that, with increasing disturbance intensity, the dynamical mechanism of the sandpile model changes from a strong power law to a weak power law and then to a lognormal distribution. Results from shaking table experiments of a one-sided slope sandpile show that, for peak ground acceleration (PGA) in the range of 0.075–0.125 g, the relation between the amount and frequency of sand follows a negative power law. For PGA between 0.15 and 0.25 g, the relation obeys a lognormal distribution. This verifies that the abovementioned distribution of earthquake-induced landslides should be a universal law from a physical viewpoint and may apply to other areas. This new perspective may be used to guide the development of an inventory of earthquake-triggered landslides and provide a scientific basis for their prediction.
- Article
(7410 KB) - Full-text XML
- BibTeX
- EndNote


Earthquakes have triggered numerous landslides. The 1994 Mw 6.7 Northridge earthquake in the USA triggered more than 11 000 landslides (Harp and Jibson, 1995, 1996). The 2008 Mw 7.9 Wenchuan earthquake in China triggered 197 481 landslides (Xu et al., 2014). The 2014 Mw 7.0 Port-au-Prince earthquake in Haiti triggered 30 828 landslides (Xu et al., 2014). Landslides are one of the most common and dangerous coseismic disasters. In particular, landslides triggered by the 2008 Wenchuan earthquake induced about one-third of the total deaths and disappearances (Huang and Li, 2009).
An inventory map of earthquake-induced landslides shows many correlations between landslides and seismic factors (e.g., distance from the epicenter and major surface rupture, seismic intensity, peak ground acceleration, and slope gradient) and slope characteristic factors (e.g., gradient, aspect, elevation, and lithology) and has been analyzed using statistical methods (Keefer, 2000; Rodrıguez et al., 1999; Papadopoulos and Plessa, 2000; Parise and Jibson, 2000; Meunier et al., 2007; Harp et al., 2011; Xu et al., 2016). Many significant laws, such as the effects of slope aspect, faults, hanging wall, and topography, have been reported (Huang, 2009; Yin et al., 2009; Dai et al., 2011; Meunier et al., 2008). Most studies address the relationship between landslide frequency and magnitude associated with a trigger (e.g., earthquake) or historical landslide inventory (Malamud et al., 2004). These studies used statistical models, including the Pareto probability model (Frattini and Crosta, 2013), double Pareto probability model (Stark and Hovius, 2001), and gamma function probability model (Van Den Eeckhaut et al., 2007). The frequency–magnitude distribution of landslides is typically expressed in a noncumulative (Carrara et al., 2003; Guzzetti et al., 2002) and cumulative form (Hovius et al., 1997; Guthrie and Evans, 2004b). Landslide magnitude is often expressed in terms of area (Catani et al., 2005; Havenith et al., 2006; Chen et al., 2007) or volume (Brunetti et al., 2009; Jaiswal and van Westen, 2012), both of which are representative of landslide magnitude and have a certain correlation. Area is widely used because it is easier to obtain than volume.
Several studies have shown that the frequency–magnitude distribution of landslides follows a power law distribution (Frattini and Crosta, 2013; Pelletier et al., 1997; Malamud and Turcotte, 1999; Iwahashi et al., 2003; Guthrie and Evans, 2004a; Dahl et al., 2013; Harp and Jibson, 1996). Most studies, however, focused on phenomena rather than causes. The size distribution law of landslides and its physical mechanism remain poorly understood. Hergarten and Neugebauer (1998) compared observed landslide size distributions with models of self-organized criticality (SOC) and suggested that landsliding in combination with its driving processes may be considered a SOC phenomenon. Unfortunately, no further work was undertaken owing to the lack of available field data.
SOC theory belongs to the field of nonlinear physics field and is a new concept to explain the behavior of composite systems developed by Bak et al. (1987, 1988). This kind of system or composite system contains an exceedingly large number of elements that interact over a short range, naturally evolve toward a critical state, and are locked in this state over a given period of time or permanently. In the critical state, a minor event can initiate a chain reaction that affects a large number of elements in the system and even lead to a catastrophe. Although systems produce more minor events than catastrophes, chain reactions of all sizes are an integral part of the dynamics. According to theory, the mechanism that leads to minor events is the same as the one that leads to major events.
A sandpile is a deceptively simple system that serves as a paradigm for SOC. Held et al. (1990) devised a precision apparatus that slowly and uniformly pours sand, grain by grain, onto a flat, circular surface. The sandpile stops growing when the amount of sand added is balanced, on average, by the amount of sand that falls off the edge, at which point the system has reached a critical state. When a grain of sand is added to a pile in the critical state, it can initiate an avalanche of any size, including a catastrophic event, and the size and the frequency are related by a power law. SOC has explained the dynamics of many catastrophes, such as earthquakes (Olami et al., 1992), forest fires (Drossel and Schwabl, 1992; Malamud et al., 1998), mountain and rock slides, snow avalanches (Hergarten, 2002, 2003), solar and stellar flares (Aschwanden, 2011; Aschwanden et al., 2016), and stock market crashes (Sornette, 2003). This paper investigates SOC's application to landslides triggered by earthquakes.
A total of two great earthquakes struck the Longmen Mountains in 2008 and 2013 and triggered numerous landslides. The Longmen Mountains, on the eastern edge of the Qinghai–Tibetan Plateau in Sichuan Province, China, have the greatest gradient change in the surrounding mountain system. At least 5–10 km of material in the Longmen Mountains has been eroded away since the Miocene, rising at a rate of about 0.6 mm per year (Li et al., 2009; Liu, 1993). The continuous effects of uplifting and denudation formed a deep and steep valley landscape with an average slope in the southern and Minjiang River areas above 27∘. According to Davis's (1899) theory of erosion cycles, the Longmen Mountains are in the early maturity of geomorphologic evolution, and their slopes have evolved to a critical stage. A common characteristic of slope disasters includes dilapidation of natural terrain or cut slope, rock avalanches, debris flows, landslides, rock piles, and snowslides, all of which are mainly composed of granular mixtures and associated with energy dissipation owing to material instability and slipping during slope accumulation. The sandpile model is ideal for reflecting the energy dissipation process within slope accumulation, and its dynamic characteristics should therefore be explainable under the conceptual framework of SOC (Yao and Huang, 2016).
In this study, we aim to better understand the universal behavior of slope disasters from the point of view of SOC. We studied the distribution of landslides induced by two earthquakes in the Longmen Mountains by field investigations and remote sensing interpretation. A sandpile cellular automata model was also built under the conceptual framework of SOC to simulate earthquake-induced landslides. Shaking table experiments of a one-sided slope sandpile under seismic excitations were conducted. The results of this study provide a physical explanation of the general distribution of earthquake-induced landslides.
2.1 Study area
The 2008 Wenchuan earthquake triggered the largest number of landslides observed in human history. On 20 April 2013, the Lushan earthquake also triggered a large number of landslides (Fig. 1). Both events were caused by thrust faulting in the Longmen Mountains of China in areas under similar geographical, geological, and geomorphological conditions.
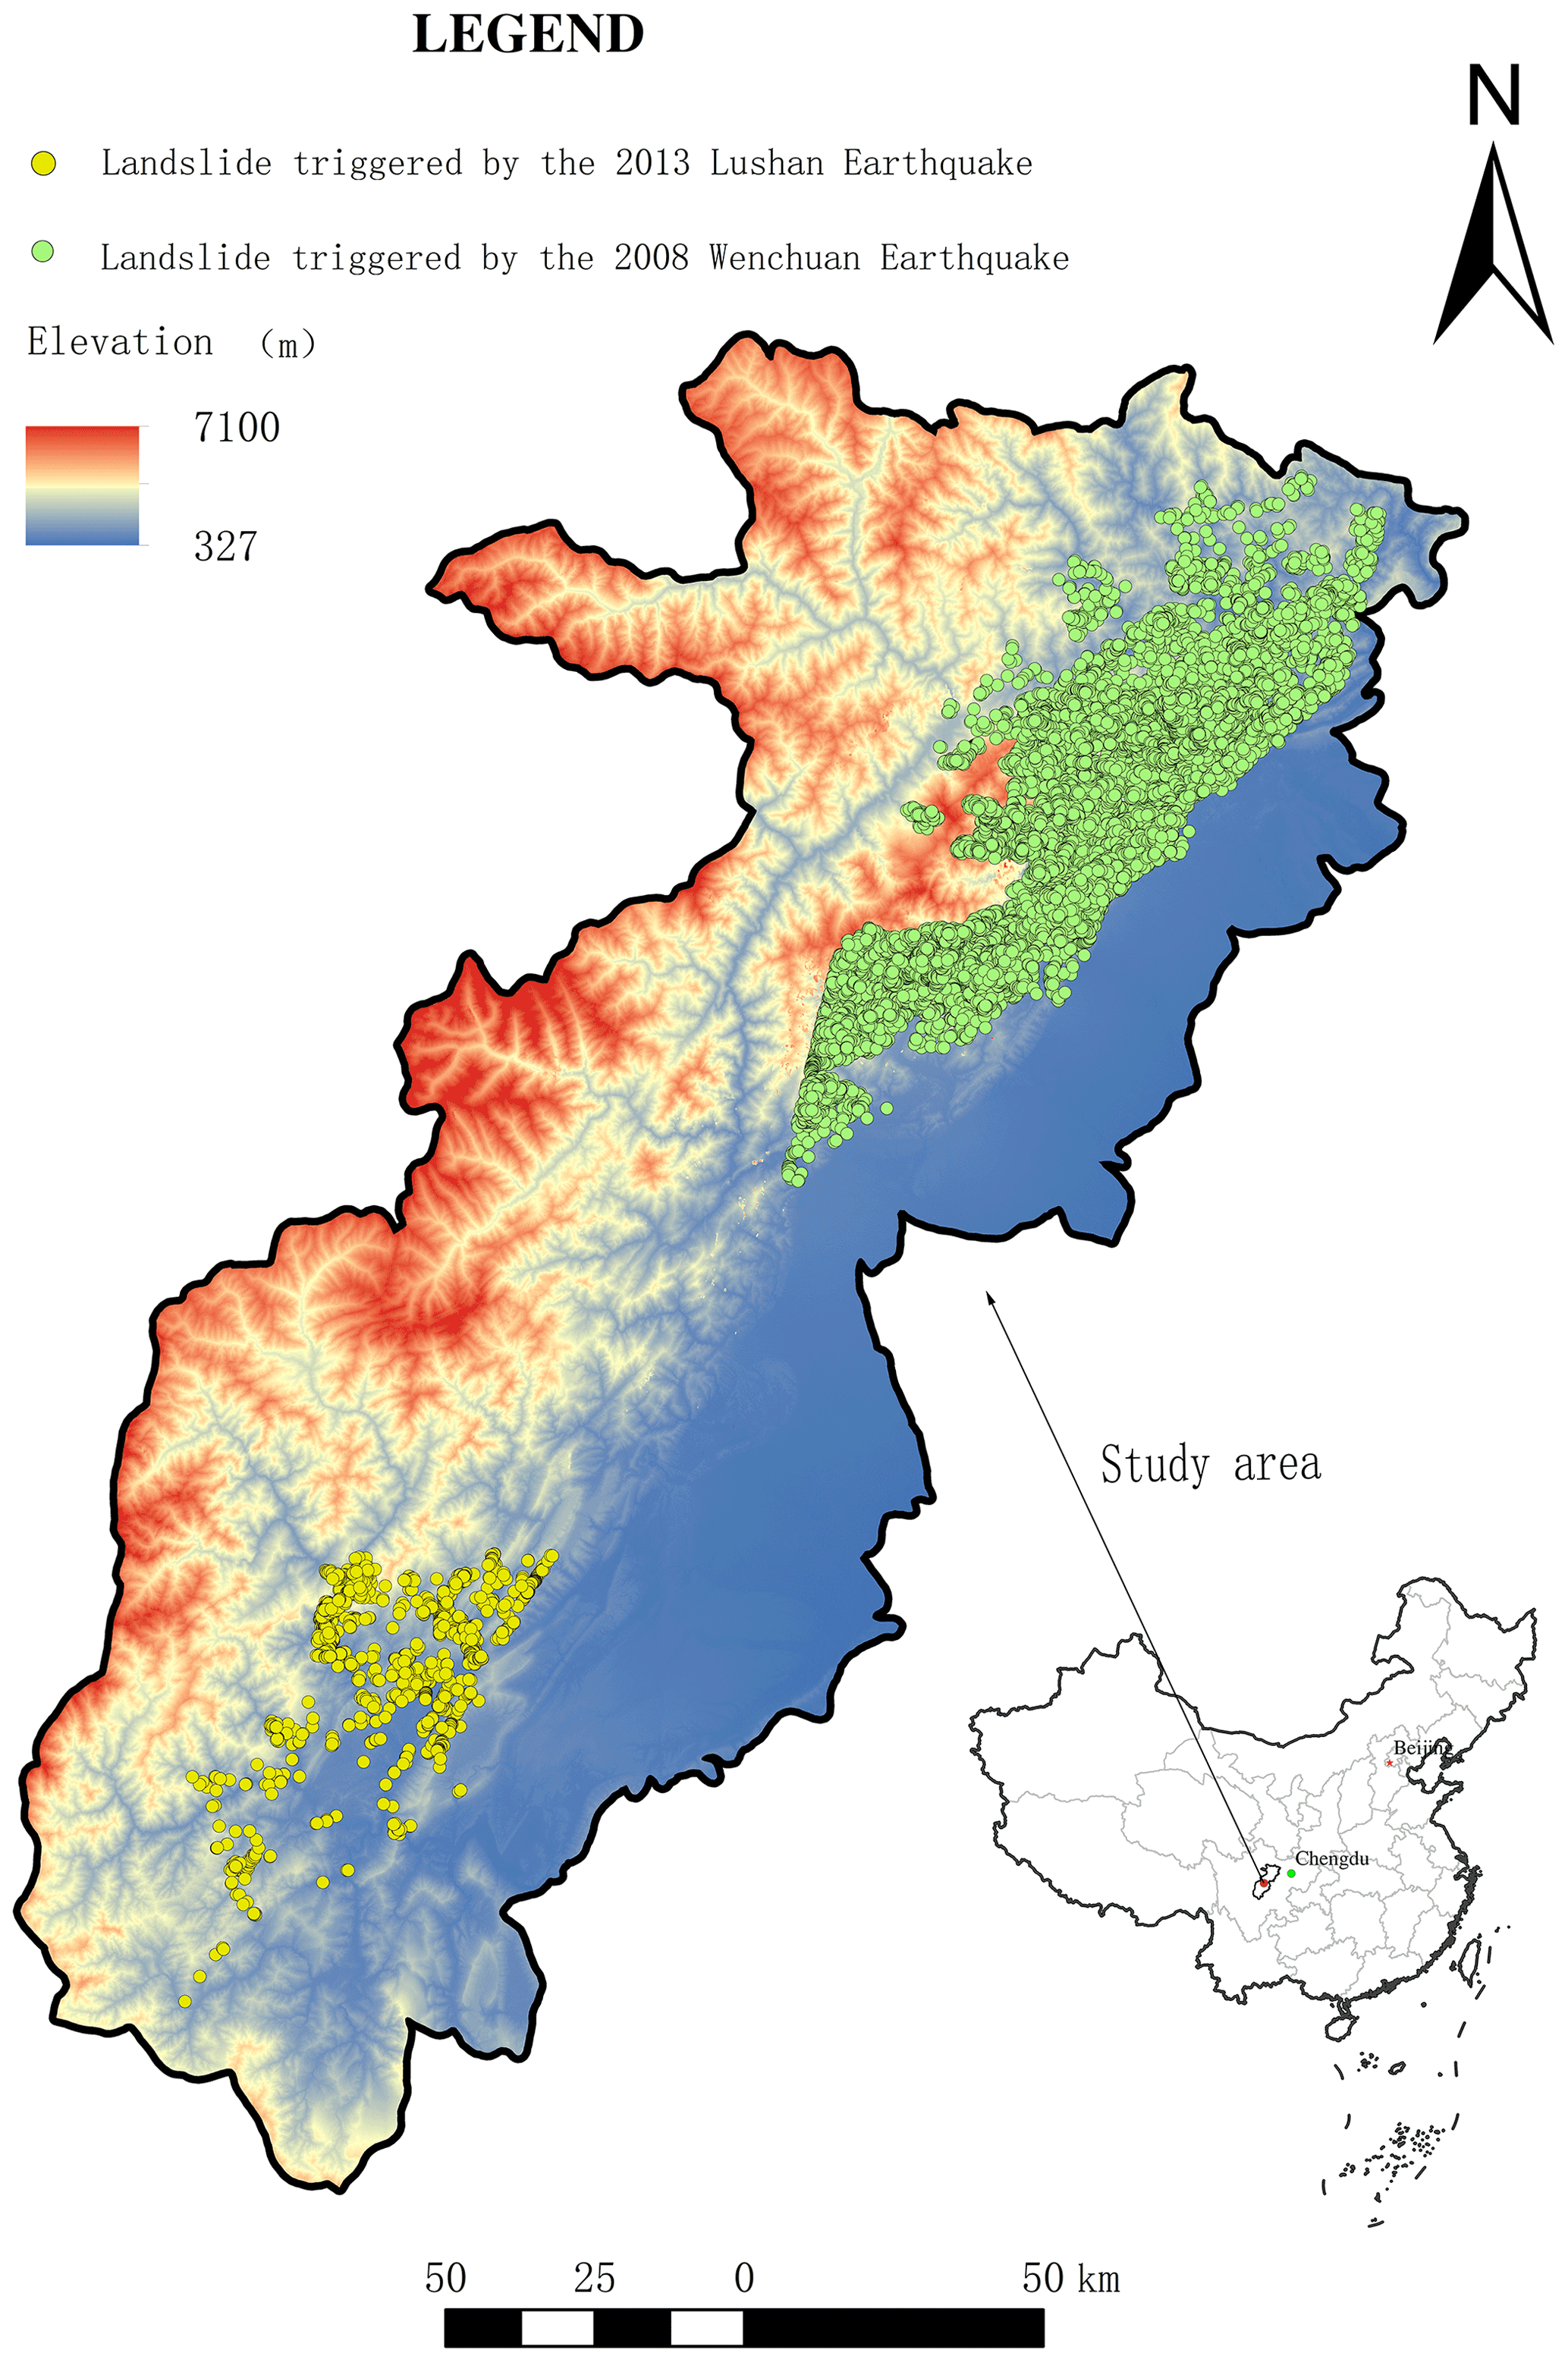
Figure 1Landslides triggered by the 2008 Wenchuan and 2013 Lushan earthquakes.
2.2 Data and methodology
2.2.1 Landslide field investigation
The majority of our fieldwork was accessed by car; landslides were recorded that were visible along the road and then followed on foot for detailed investigation. The landslide investigation of the Wenchuan earthquake began in the rescue time from 31 May 2008, soon after the main shock, until 5 June 2008. We collected preliminary survey data by recording the location of the landslide deposits that covered the road, estimating the landslide volume, and asking the highway department staff for the amount of cleaned landslide deposits. We chose to limit the survey to >10 m3 landslides that blocked roads.
A relatively detailed reconnaissance field study was conducted from 2 to 27 August 2009. After two rainy seasons, the loose material on the slope was nearly washed away, revealing a complete sliding bed or collapsed back wall. We measured the spatial position coordinates of the sliding bed and compared this with a 1:2000 topographic map along the highway from Dujiangyan to Yingxiu, which is a section of Chinese national highway 213. A three-dimensional digital figure of the landslide was generated to obtain the landslide volume and depth. According to the slope engineering design scheme of the highway, the landslide depth can be estimated more accurately by measuring the length of exposed anchors after the earthquake.
After the Lushan earthquake, we conducted landslide field surveys along the road from 26 April to 26 August 2013. We accumulated survey routes exceeding 500 km in length, including the China national highway 318, provincial highways 210 and 211, and country town roads from Leyin to Rongjin, Longmen to Taiping, Renjia to Shuangshi, Shuangshi to Linguan, and Taiping to Dachuan. We focus on landslide volume, which is mainly obtained from field measurements and the amount of cleaned landslide deposits by the highway department during the rescue time.
2.2.2 Landslide inventory mapping
Landslides triggered by earthquake are usually large in number and widespread in distribution, and detailed coseismic landslide data cannot be based on field investigations alone. At present, the visual interpretation of high-resolution remote sensing images is the primary method for obtaining large-area earthquake-induced landslide data.
We collected pre- and post-earthquake high-resolution remote sensing data to facilitate the landslide analysis. The Wenchuan earthquake data included Thematic Mapper (TM) satellite images (pre-earthquake), Advanced Land Observing Satellite (ALOS) satellite images (10 m spatial resolution; taken on 4 June 2008), and QuickBird satellite images (0.61 m spatial resolution; taken on 30 May 2008). The Lushan earthquake data included LANDSAT-5, SPOT4, and SPOT4 satellite images (pre-earthquake), aerial photographs (0.4 and 2 m spatial resolution; taken on 20 and 21 April 2013) provided by the Institute of Remote Sensing and Digital Earth of the Chinese Academy of Sciences, aerial photographs (Baoshen, Longmen, and Taipin towns; 0.16 m spatial resolution; taken on 20 April 2013) provided by the State Bureau of Surveying and Mapping, and ZiYuan-3 (ZY-3) satellite images (2.1 m spatial resolution; taken on 13 May 2013).
The color and shape characteristics of landslides (e.g., morphology, hue, shadow, and texture) of the optical remote sensing images is clearly distinguishable from the surrounding area, especially shortly after the earthquake. Following the criteria proposed by Harp et al. (2011) and Xu et al. (2016), we manually mapped the earthquake-triggered landslides using the geographic information system (GIS) platform.
Coseismic landslides are easily detected on high-resolutions images (∼1–10 m or higher). Many coseismic landslides may overlap in areas of high landslide density, which makes them difficult to uniquely distinguish, and they are subject to the interpreter's discretion. The higher the resolution of the images used, the easier individual landslides are separated and the more objective landslide inventory maps are prepared. Densely vegetated areas also pose a problem because vegetation is often destroyed during landsliding, and “tadpole” traces appear on the image. Special care must be taken to distinguish the landslide from the vegetation damage range, and the identified landslide inventory map must be validated to improve the interpretation accuracy. To address these problems, first of all, the landslides of the study area were mapped using visual interpretation of high-resolution satellite images and aerial photographs. Second, we removed landslides in areas with slopes less than 20∘ because landslide events require certain terrain conditions. Because some farmland, bare land, quarries, sand and gravel yards, old landslides, and other traces of human activities are difficult to distinguish from coseismic landslides on the images, we performed detailed field investigations and combined pre-earthquake satellite images to exclude inaccurate assessments. Finally, we converted the projected landslide area identified in the remote sensing image with the slope gradient to obtain the final landslide area.
2.3 Results and discussion
Although the distribution of earthquake-induced landslides is controlled by a variety of factors (e.g., slope aspect, faulting, topography, zinc lithology) that have been discussed in several studies, we believe that the most important control factor is seismic intensity. Therefore, in this study, we analyze landslide distribution according to seismic intensity zone. The range of seismic intensity zones is based on official seismic intensity distribution maps published by the China Earthquake Administration.
Frequency area (or volume) distribution of a landslide event often exhibits power law scaling over a limited scale range (Guzzetti et al., 2002; Stark and Hovius, 2001). The relationship can be represented by Eq. (1) as follows:
where a,b are constants, and b is the exponent power that describes the statistical features of the landslide distribution. A is landslide size, characterized by area and volume, even depth. N(A) is the number of landslides beyond a given A.
2.3.1 Landslide volume (depth)–frequency distributions in different seismic intensity zones
We performed detailed field investigations of 105 landslides triggered by the Wenchuan earthquake and 261 landslides triggered by the Lushan earthquake. The data were fitted by Eq. (1), where q is landslide volume, and N(q) is the number of landslides beyond a given volume q. h is landslide depth, and N(h) is the number of landslides beyond a given depth h. The power law formula is fitted by a least-squares regression, where R2 represents the goodness of fit (i.e., larger R2 reflects a better fit). The results of field survey are listed in Table 1.
Table 1Landslide volume (depth)–frequency distributions in different seismic intensity zones.
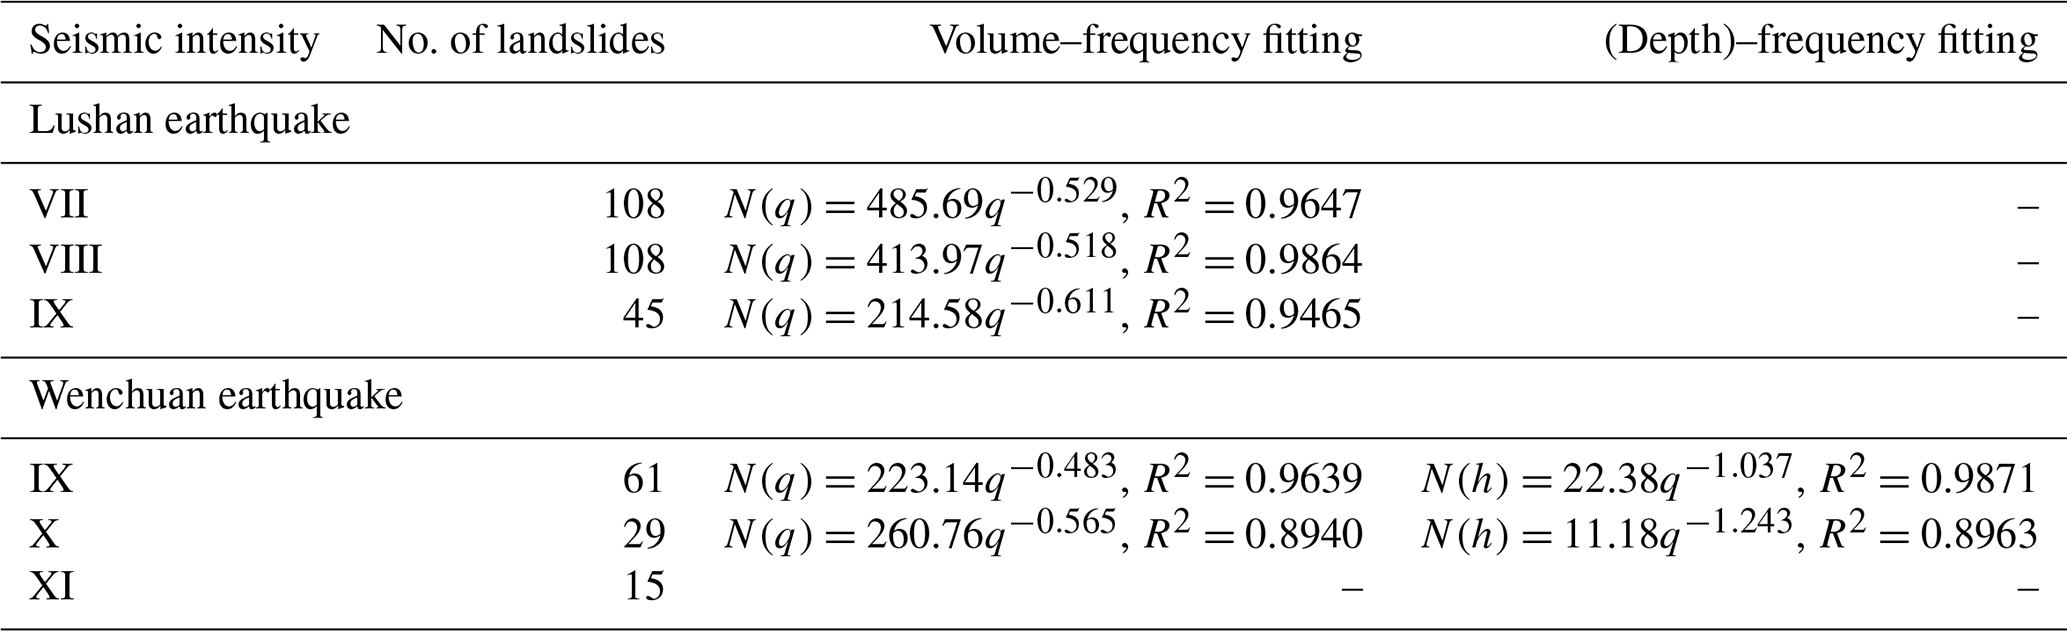
In the VII, VIII, and IX seismic intensity zones of the Lushan earthquake, the landslides volume–frequency distribution follows a strong power law relationship. In the IX seismic intensity zone of the Wenchuan earthquake, the volume–frequency distribution and depth–frequency distribution all follow a power law relationship. The X seismic intensity zone of the Wenchuan earthquake shows similar yet weak power law characteristics, even though the number of landslides is small (29 sites). A substantial number of large landslides are observed in the XI seismic intensity zone of the Wenchuan earthquake and are connected in a single mass, which is not easy to distinguish into individual sites. Almost two-thirds of the mountains show evidence of mountain peeling. Of the 15 landslides surveyed, the minimum volume is 20 m3, and the maximum is 16 800 m3. The minimum depth is 0.3 m, and the maximum is 5 m. Although the number of samples is insufficient to draw statistical conclusions, large landslide events appear to dominate. A power law relationship is not observed between the volume (or depth) and frequency in the XI seismic intensity zone.
2.3.2 Landslide frequency–area distributions in different seismic intensity zones
We identified 20 236 coseismic landslides of the Wenchuan earthquake and 1608 coseismic landslides of Lushan earthquake by manual image interpretation, as shown in Figs. 2 and 3, respectively. The statistics of the landslide area were fitted by Eq. (1), where A is landslide area and N(A) is the number of landslides beyond a given area A. To eliminate the influence of map resolution and undersampling of smaller landslides, we statistically analyze landslides over 1000 m2. The power law formula is fitted by a least-squares regression. We also test the lognormal relationship of the data by the chi-square test method. The results of remote sensing interpretation are listed in Table 2.
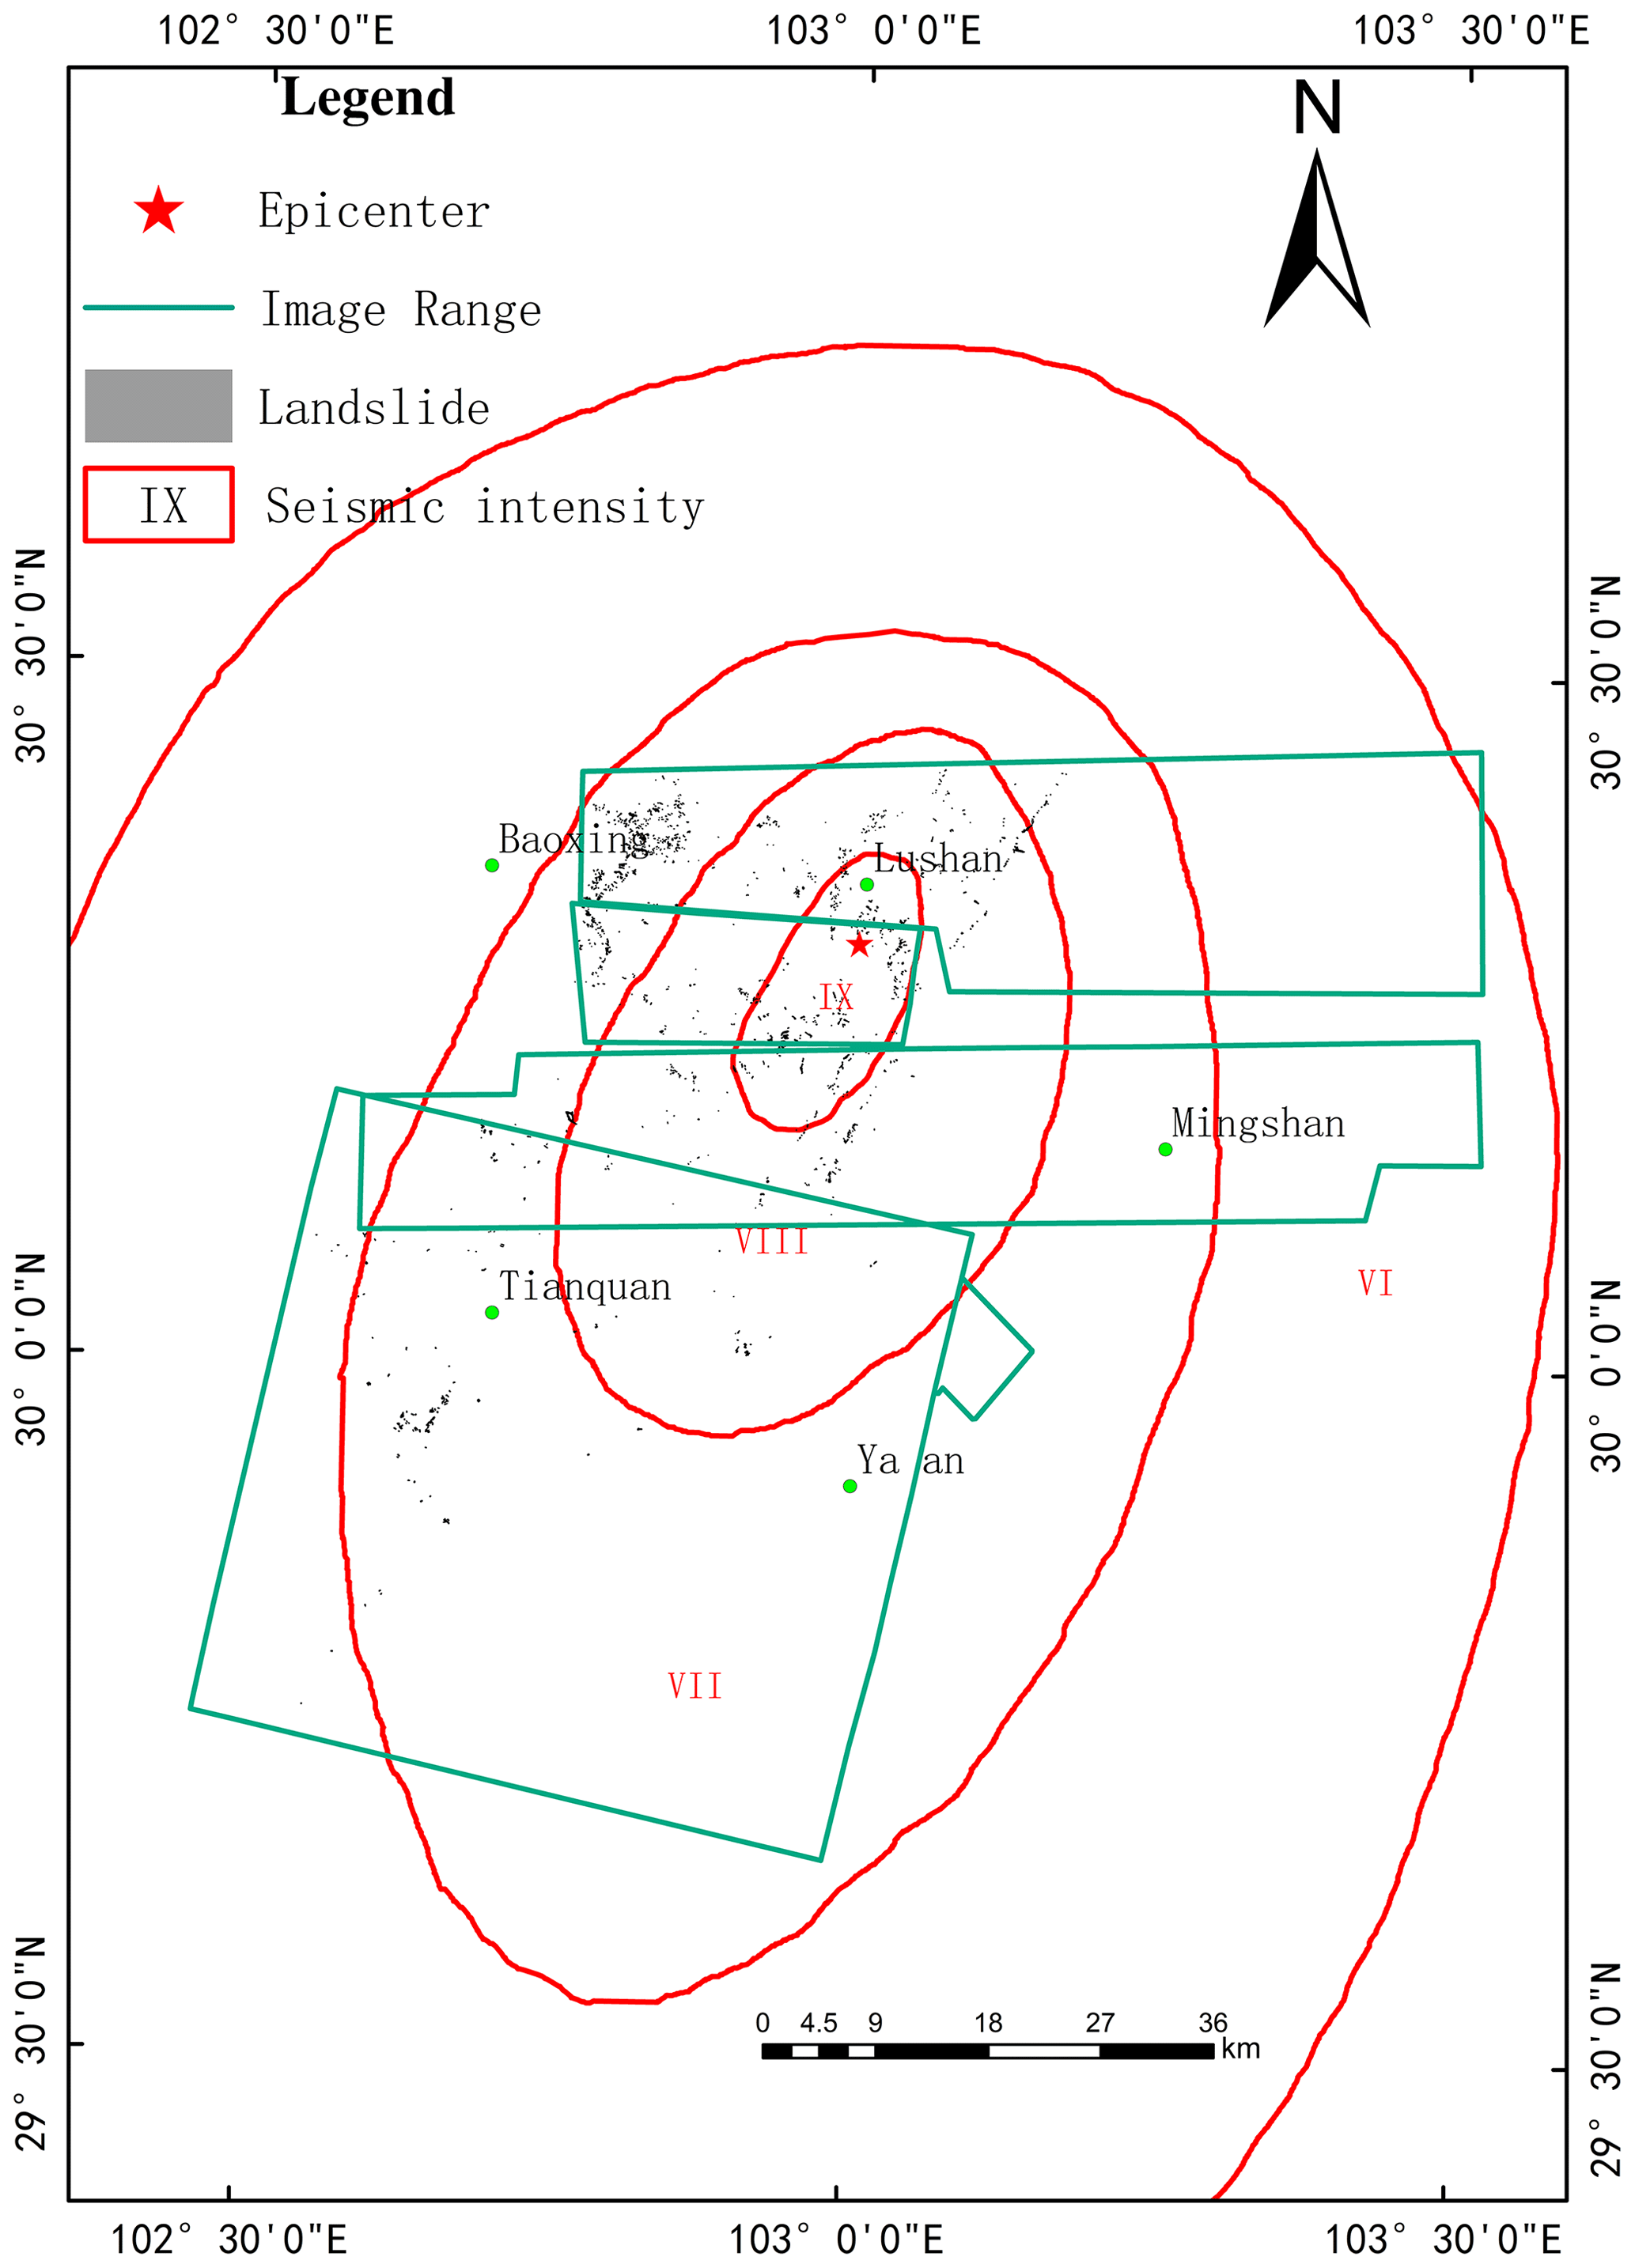
Figure 2Distribution map of landslides triggered by the Wenchuan earthquake.
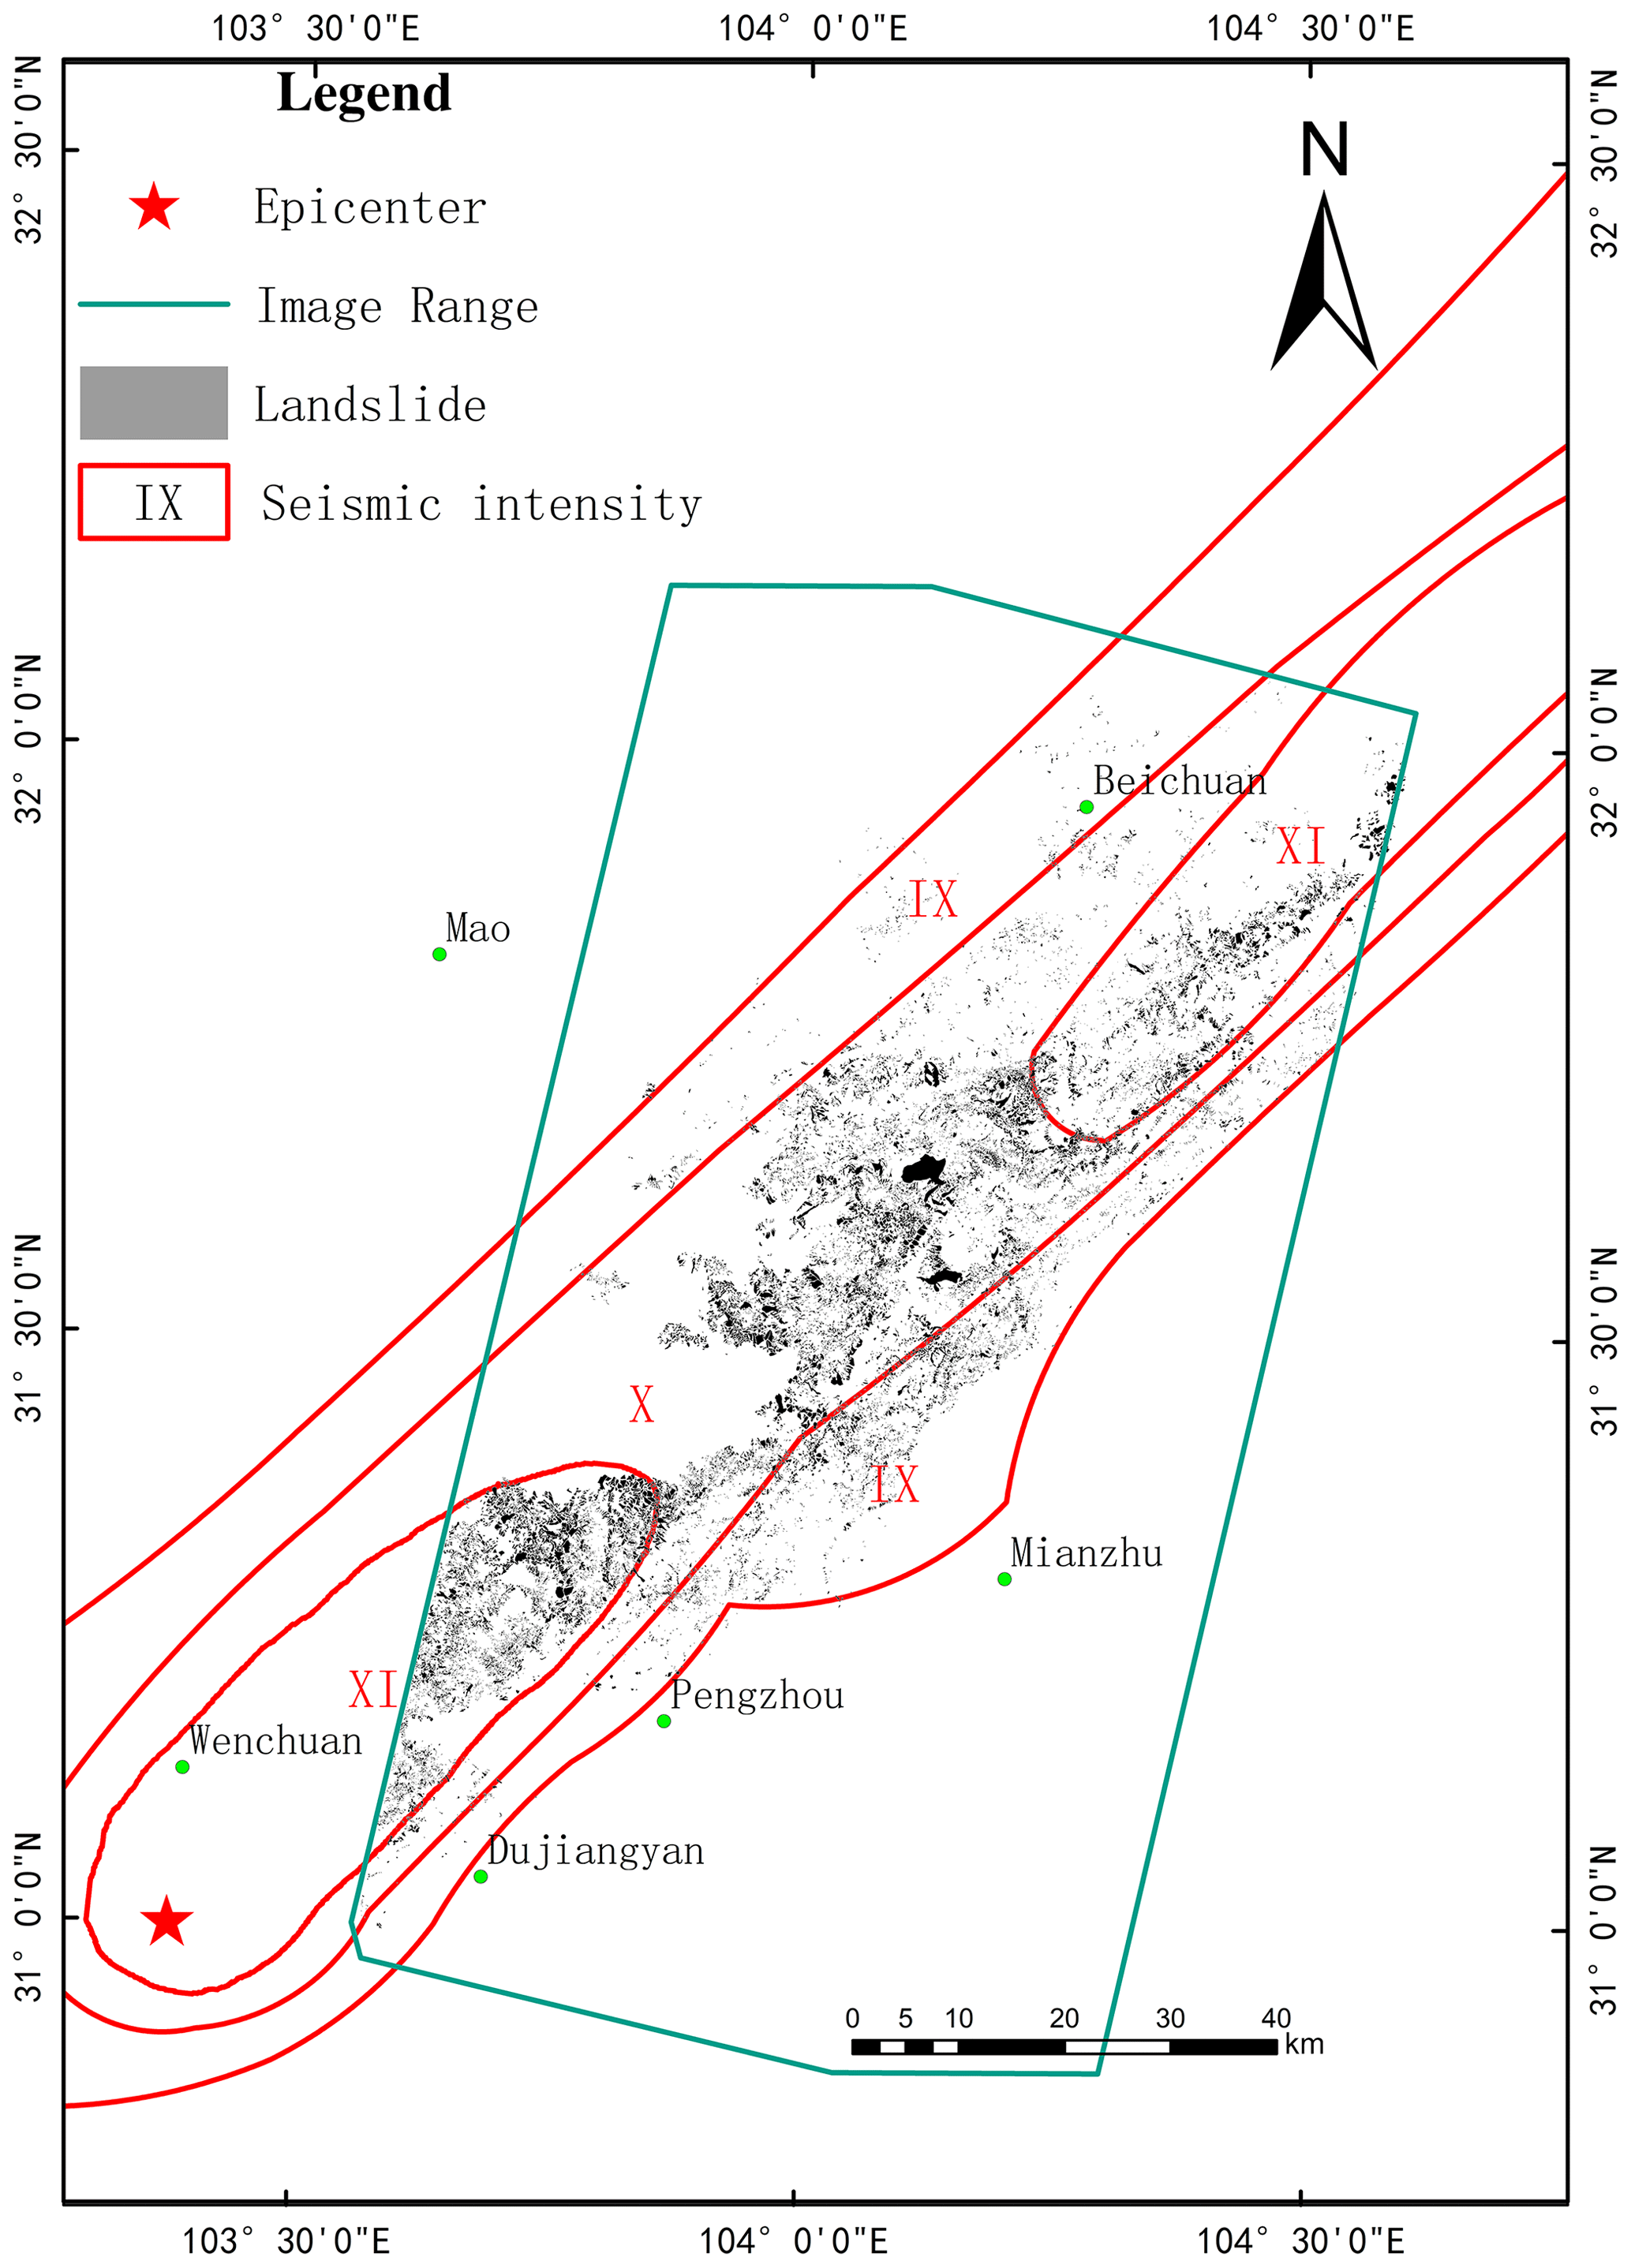
Figure 3Distribution map of landslides triggered by the Lushan earthquake.
Table 2Landslide frequency–area distributions in different seismic intensity zones.
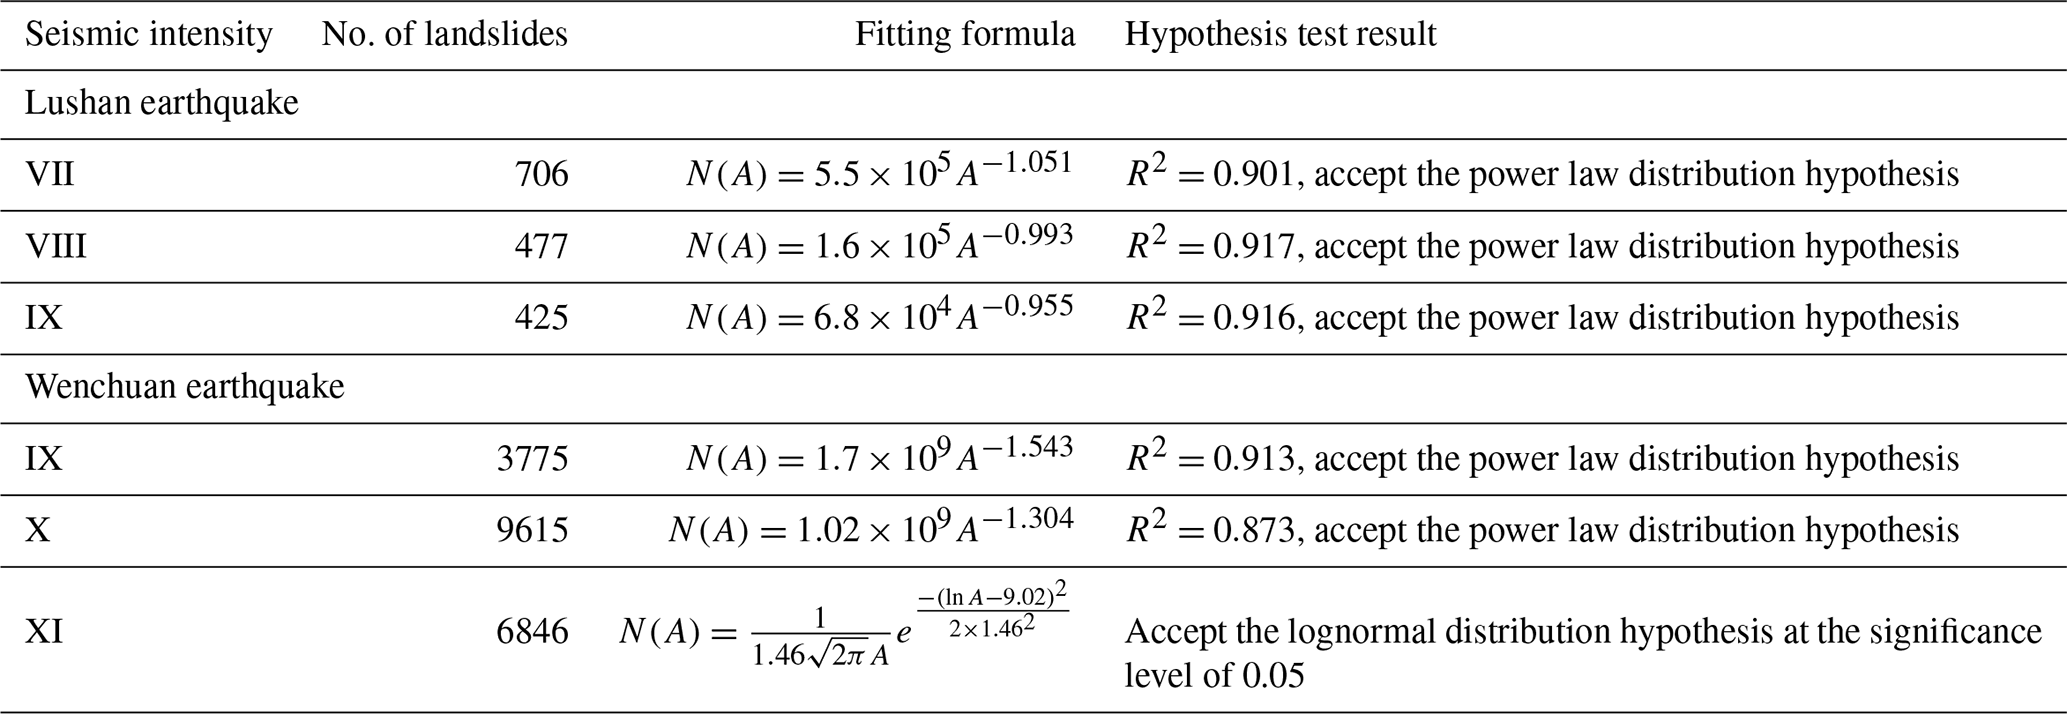
In the VII, VIII, and IX seismic intensity zones of the Lushan earthquake, the landslides area–frequency distribution follows a power law relationship (R2>0.9), although none pass the lognormal distribution test. The landslide area–frequency distribution follows a power law relationship (R2>0.9) in the IX seismic intensity zone of the Wenchuan earthquake, a weak power law in the X seismic intensity zone (R2=0.873), while a lognormal distribution in the XI seismic intensity zone.
2.3.3 Landslide density in different seismic intensity zones
We define landslide density as the number of landslides per square kilometer. The landslide numbers and calculated densities in the different seismic intensity zones of the two earthquakes are listed in Table 3.
Table 3Landslide concentrations in different seismic intensity zones.
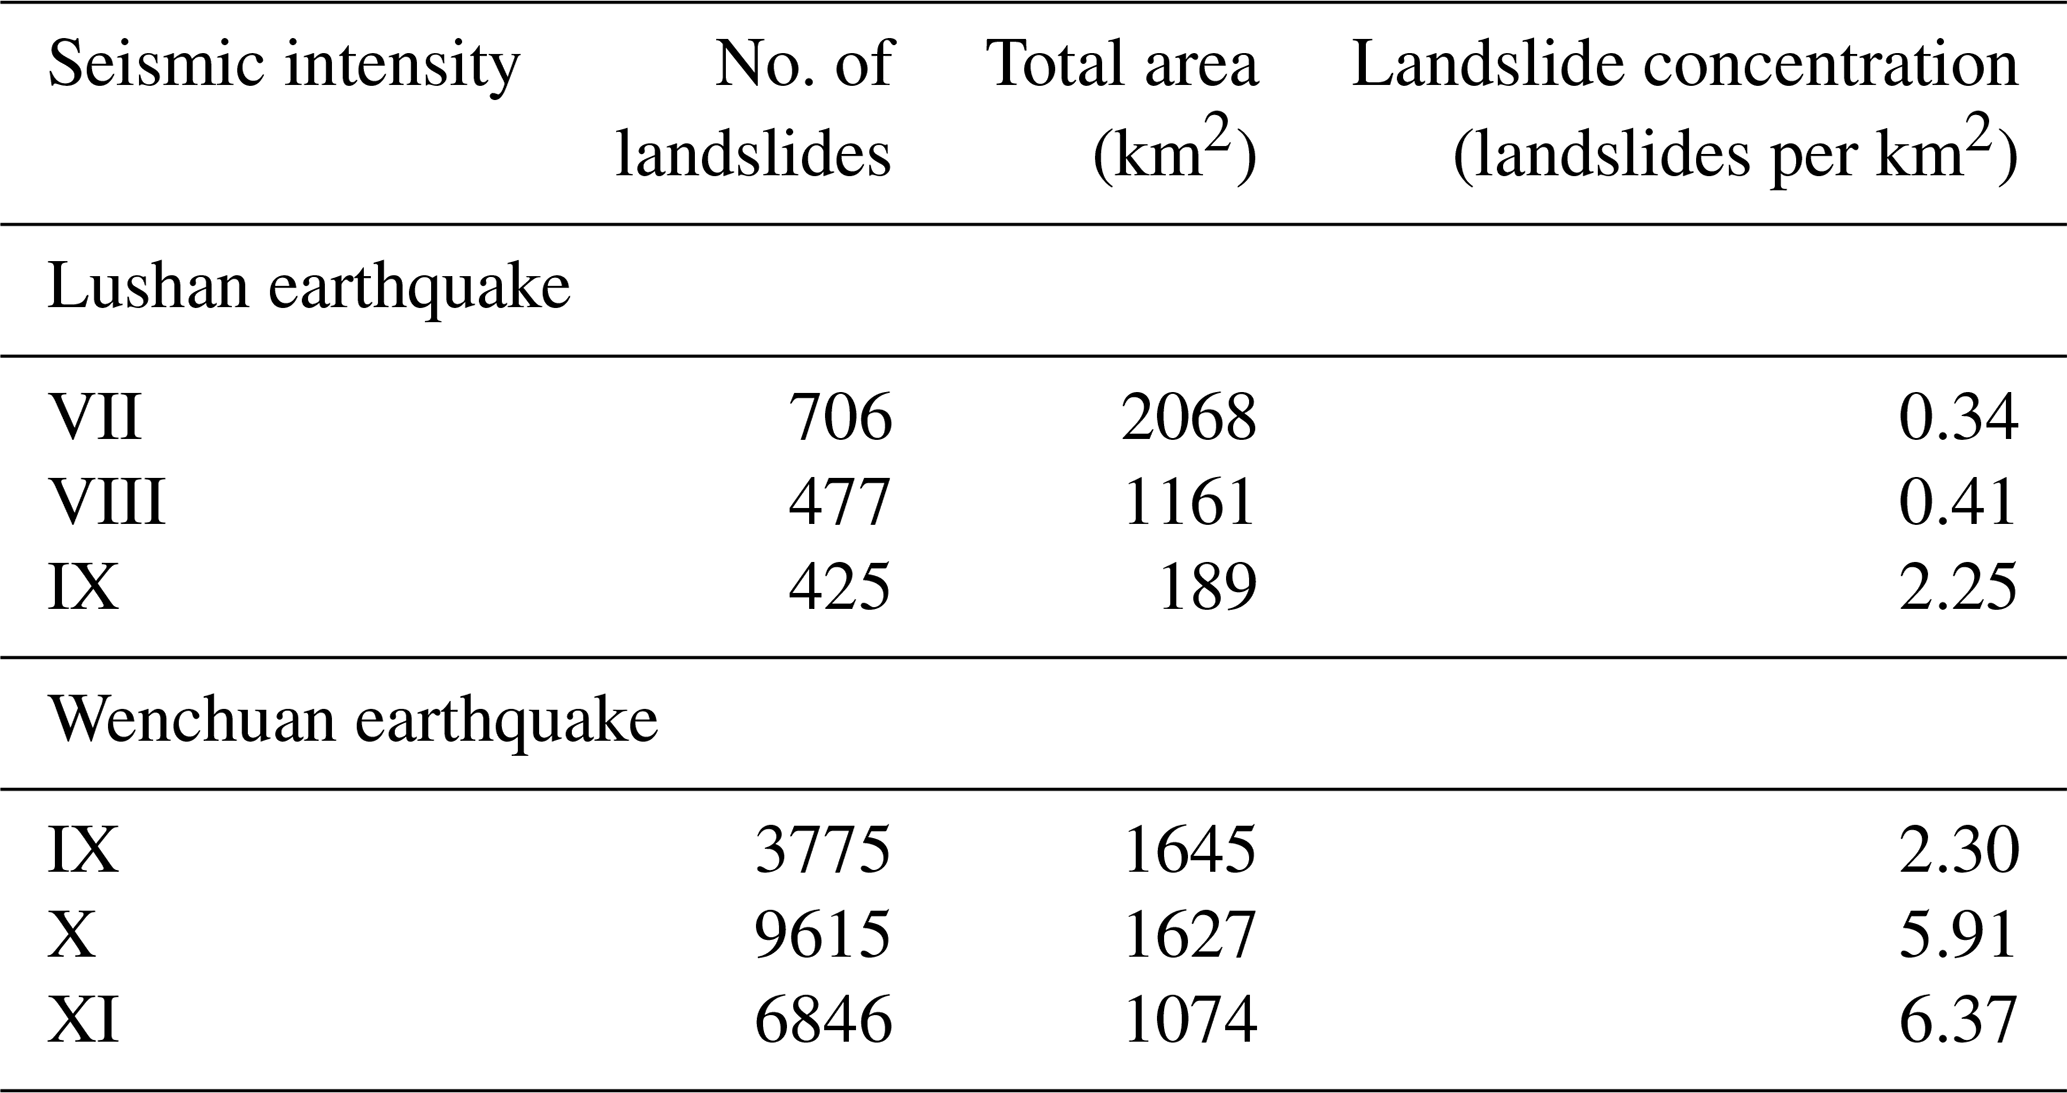
Landslide density clearly increases with seismic intensity, in agreement with previous studies (Qi et al., 2010). To test if the statistical results obtained from landslides generated by the Wenchuan and Lushan earthquakes may also apply to landslides in other areas, we combine cellular automaton simulations with laboratory experiments under the conceptual framework of SOC to interpret the distribution mechanism of earthquake-triggered landslides from a physical viewpoint.
Computer models are an integral component of SOC research, mostly from numerical simulations of a sandpile cellular automaton. The Bak–Tang–Wiesenfeld (BTW) model (Bak et al., 1987) is the earliest and most classic model of sandpile cellular automata, and many other models have been developed based on the BTW model for different physical systems that display SOC (e.g., earthquakes, forest fires, magnetic vortex motion, interface growth, and biological evolution). In this study, we introduce a sandpile cellular automata model to simulate earthquake-induced landslides.
3.1 The model
According to the physical features of earthquake-induced landslides, the model has the following aspects:
-
The BTW model is used to study the avalanche size distribution over time of a sandpile under disturbances. Because earthquake-induced landslides occur simultaneously, the avalanche size distribution of many sandpiles must be studied when they are disturbed by a single event.
-
In the BTW model, a system may be partially disturbed and remain strictly energetically conservative. During earthquake-induced landslides, the slope is disturbed as a whole, and its instability must overcome its self-stabilization ability, which requires input energy. The disturbed disseminate is therefore energetically nonconservative.
-
The BTW model is used to study the dynamic behavior of a system under the same perturbation conditions. For earthquake-induced landslides, the disturbance force on the slope is sensitive to the seismic intensity zone and may exceed the perturbation level. We must, therefore, modify the disturbance intensity to simulate this physical process.
According to the above characteristics, we constructed a sandpile cellular automata model to simulate earthquake-induced landslides. The model is defined on a two-dimensional L×L lattice. The sites were numbered with a pair of subindexes , and each site has four nearest neighbors located in the upper, lower, left, and right directions. The state of each site is characterized by a nonnegative integer variable Fi,j, which is a state value that reflects the stability of the site (i,j) (equivalent to the site energy), and each site has a threshold Fth. We introduce α as the disturbed transmission parameter for the four neighbors, which are not larger than 0.25 owing to nonconservative factors. The model is described by the following algorithm.
-
Step 1. N sandpiles of equal size are built simultaneously but with different initial states. For each sandpile, all sites are initialized to a random value between 0 and Fth, and Fmax is the maximum value of all sites in the sandpile.
-
Step 2. The N sandpiles are simultaneously disturbed. The state value of all sites increases uniformly by the disturbance intensity F′.
-
Step 3. The N sandpiles are investigated individually. If all sites in a given sandpile remain less than Fth, nothing happens. Conversely, if , the site (i,j) becomes unstable and relaxes according to the following rule:
The relaxation may cause some of the neighbors to become unstable. If so, step 3 is repeated until all sites are less than Fth . By changing F′, we can determine the relationship between avalanche magnitude and occurrence frequency.
It should be noted that when a disturbance is applied, some sandpiles will react while others will not, depending on F′. When , at least one sandpile will react. When F′ is small, sometimes only a few sites will be triggered. But as F′ increases, a batch of sites may be triggered, each of which may trigger chain reactions that may ultimately cross paths in space. Parallel processing is therefore adopted in the algorithm, and all disturbed sites react simultaneously in a parallel-updating manner. We measured avalanche size in terms of the number of sites participating in the relaxation. This property is called cluster size and is as a measure of the area affected by the avalanche.
3.2 Results and discussion
In a nondimensional formalism, the model parameter , and the lattice size is L=50. A total of 1 million sandpiles (N=106) were generated. Each sandpile was continuously reacted 105 times, with a disturbance intensity of in succession, to ensure that each sandpile evolves to a critical state before the formal experiment. A total of eight groups of simulation experiments were then carried out by increasing F′ from 0.00001 to 0.01, with each group reacting only once. Let the number of avalanches be S and the frequency of the avalanche size be equal to S be f(S). The avalanche density is equal to the number of sandpiles with avalanche events divided by the total number of sandpiles. The statistical results are shown in Table 4.
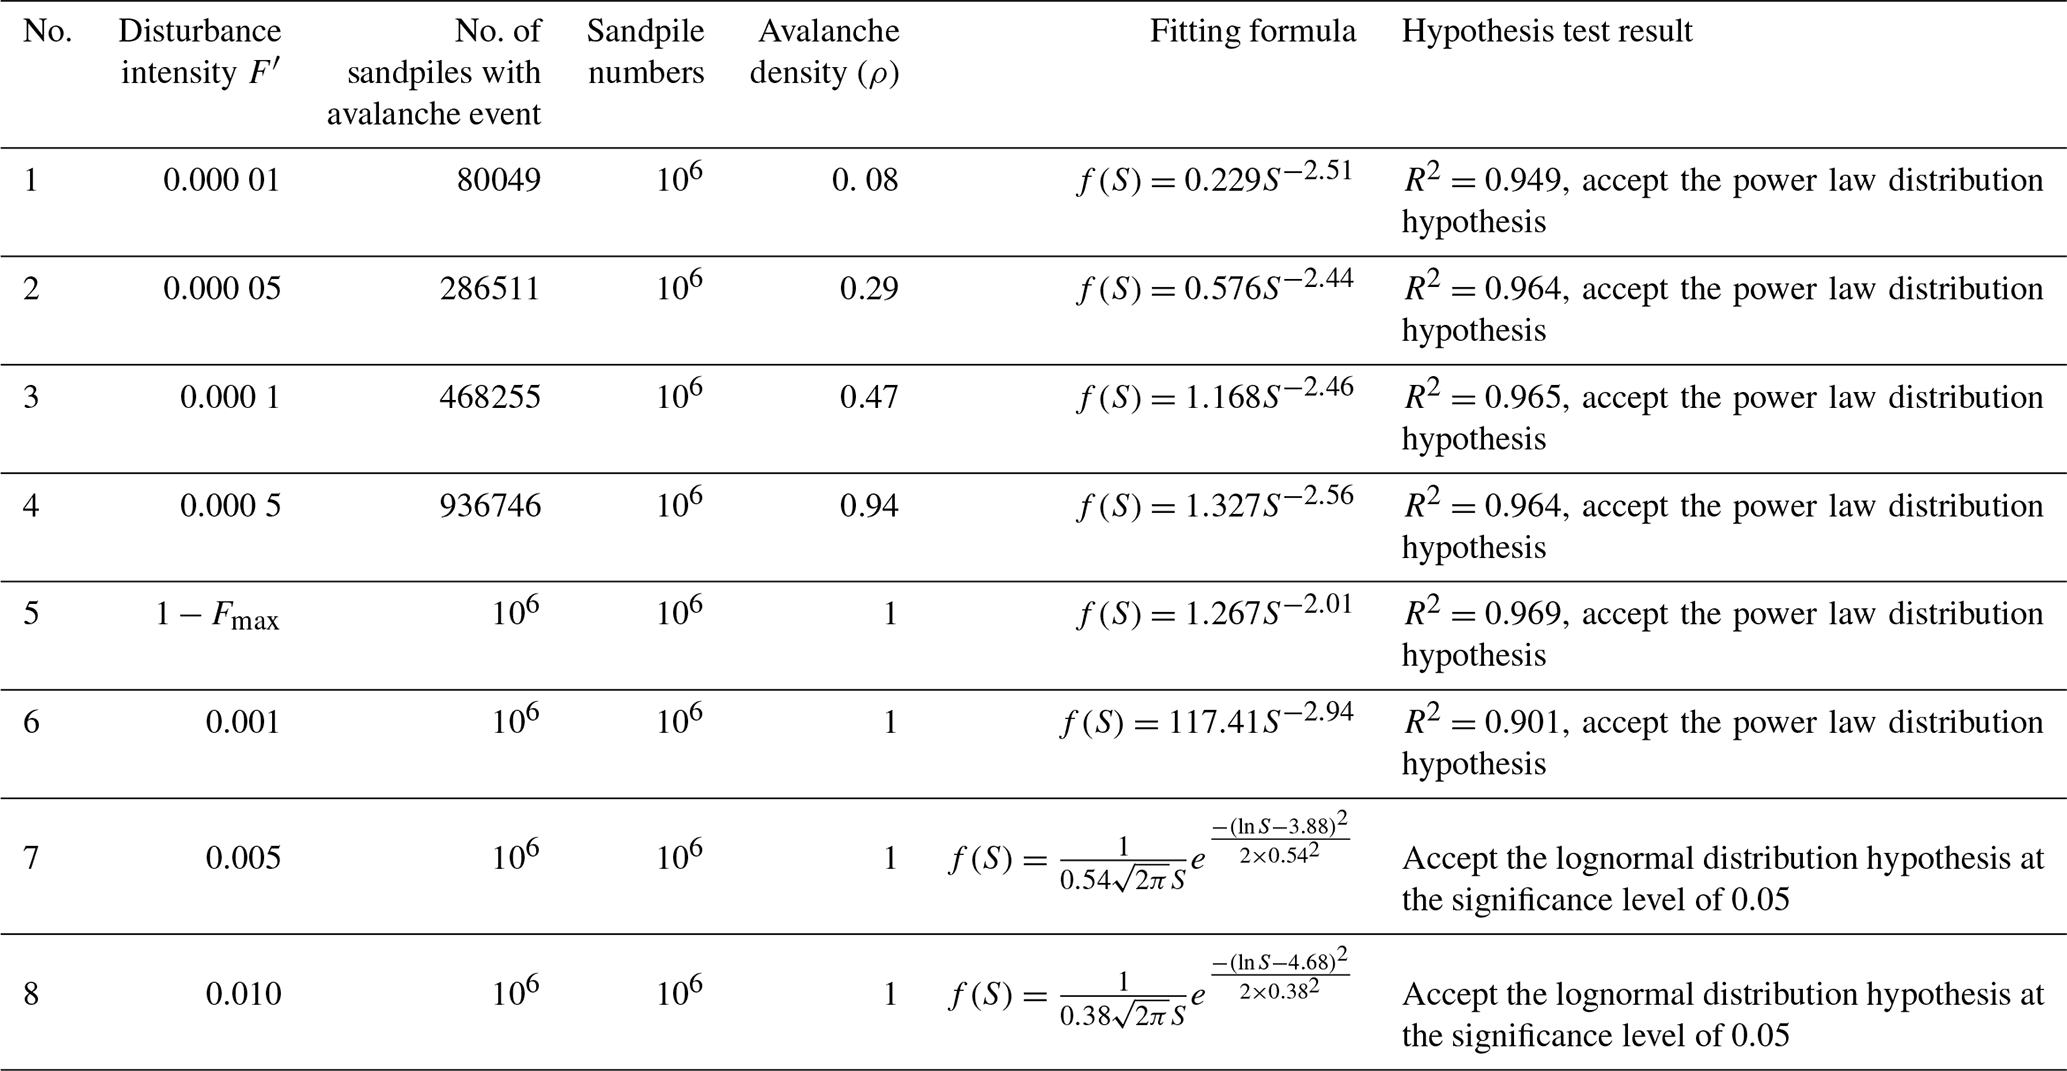
Table 4 shows that the disturbance intensity 1−Fmax can be divided into two intervals, and the dynamic characteristics of the sandpile model exhibit different properties. When , the avalanche scale and occurrence frequency basically obey the same power law distribution, but the avalanche density increases monotonously with increasing F′ (Fig. 4). When , the dynamics of the sandpile model exhibit a strong to weak power law relationship and then to a lognormal distribution with increasing F′ (Fig. 5).
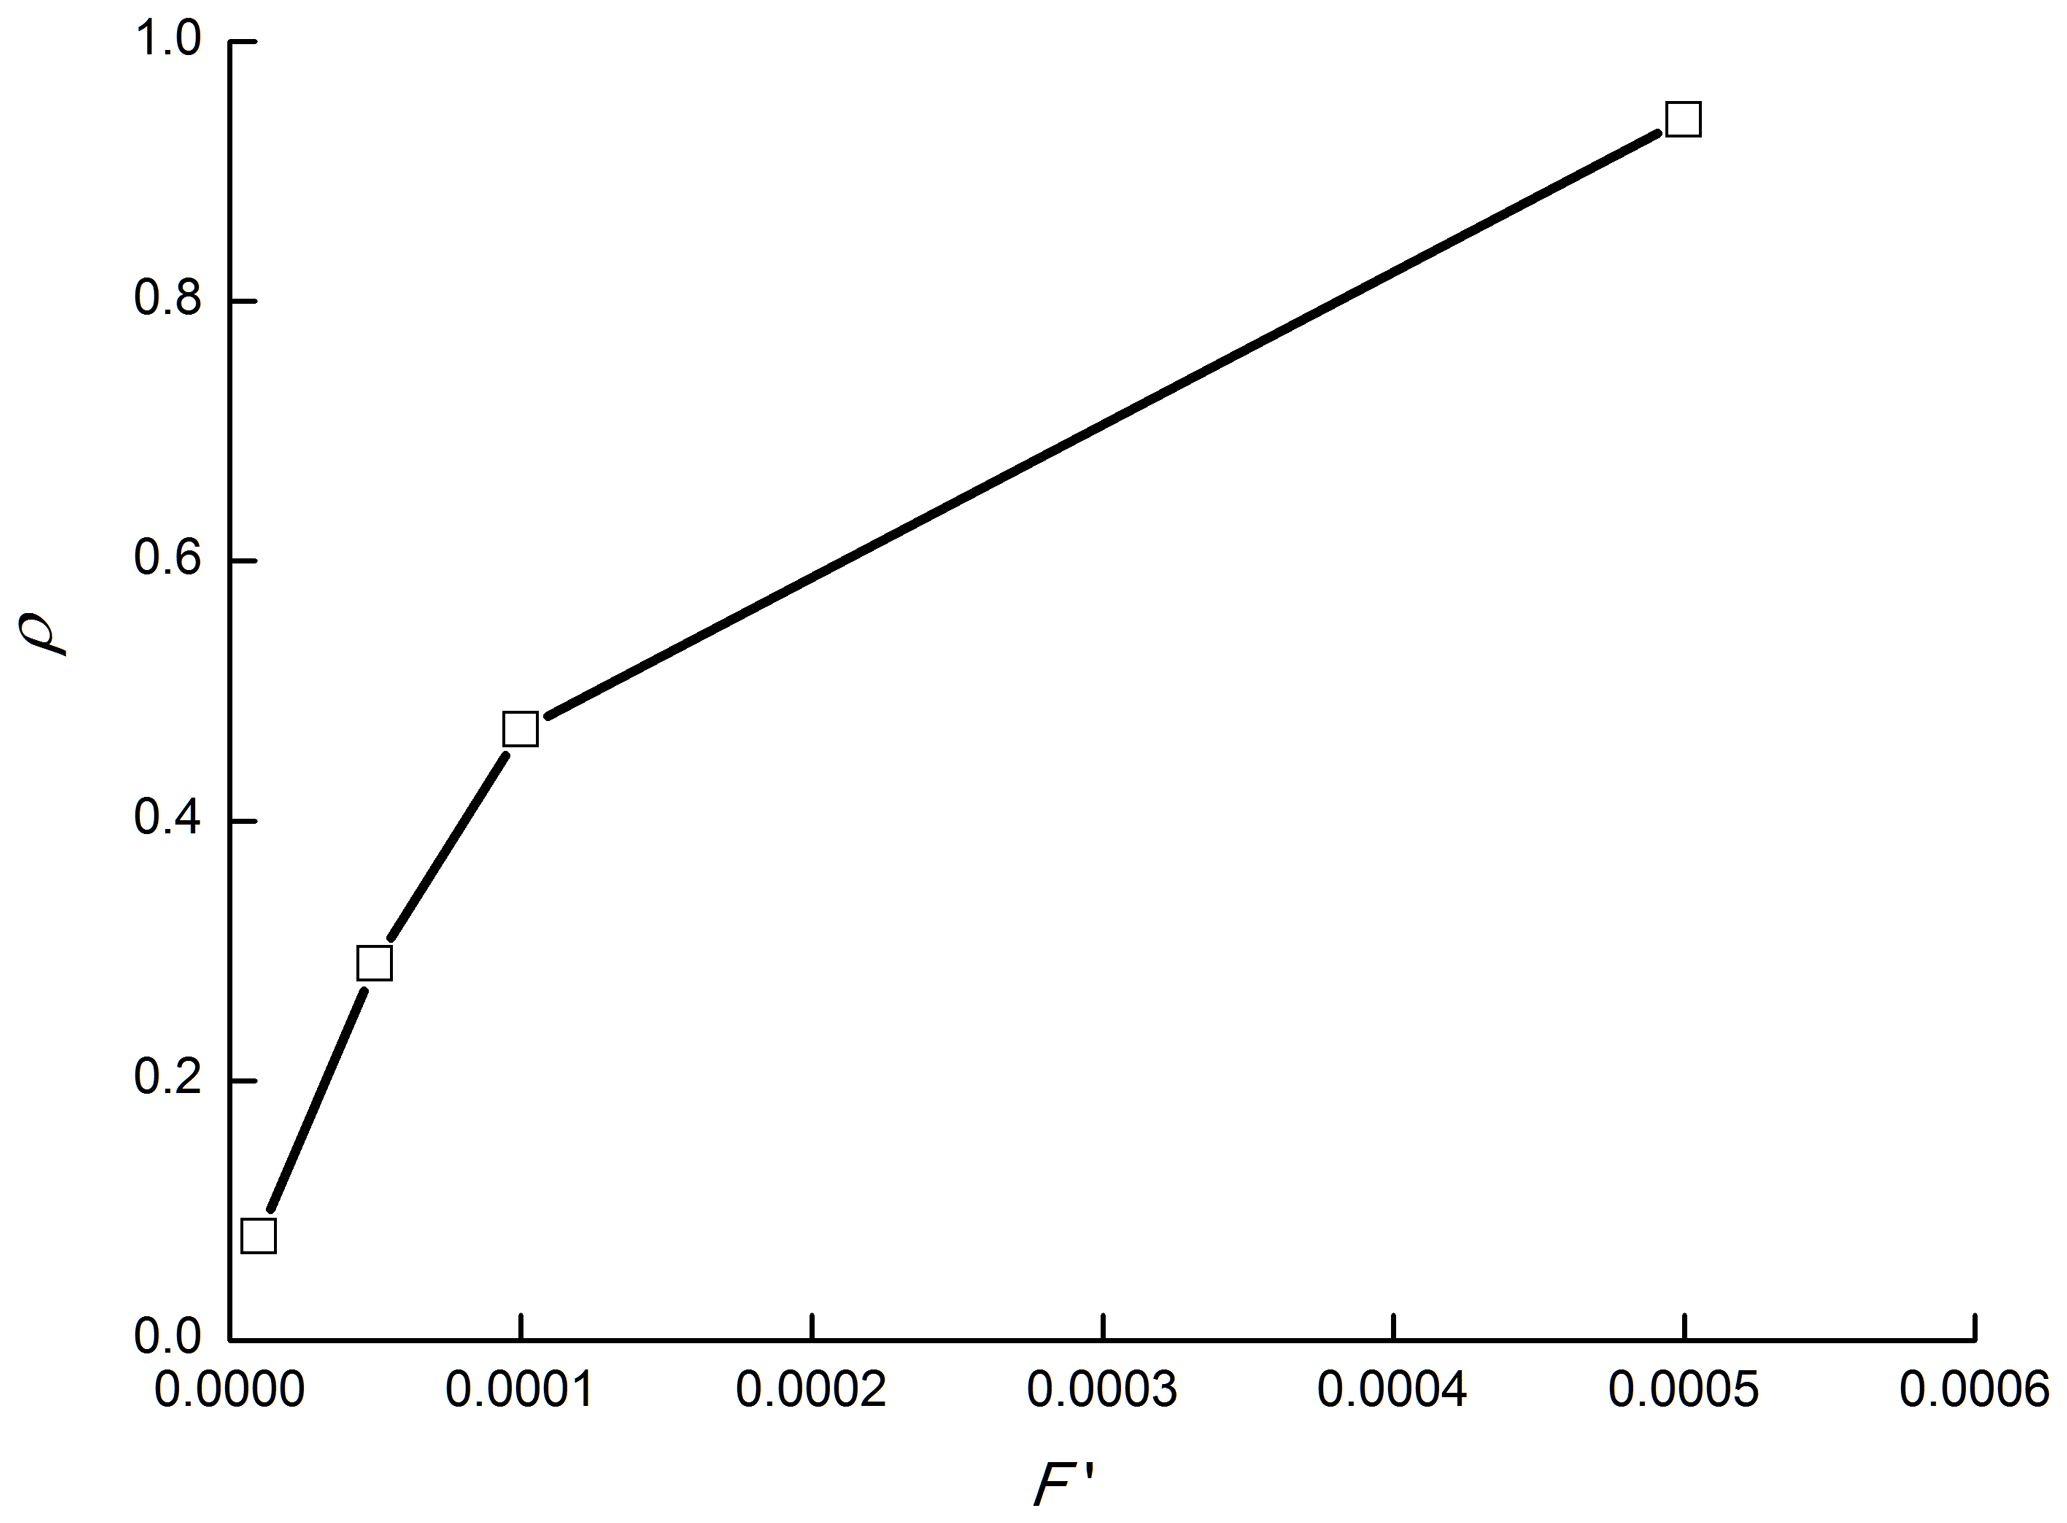
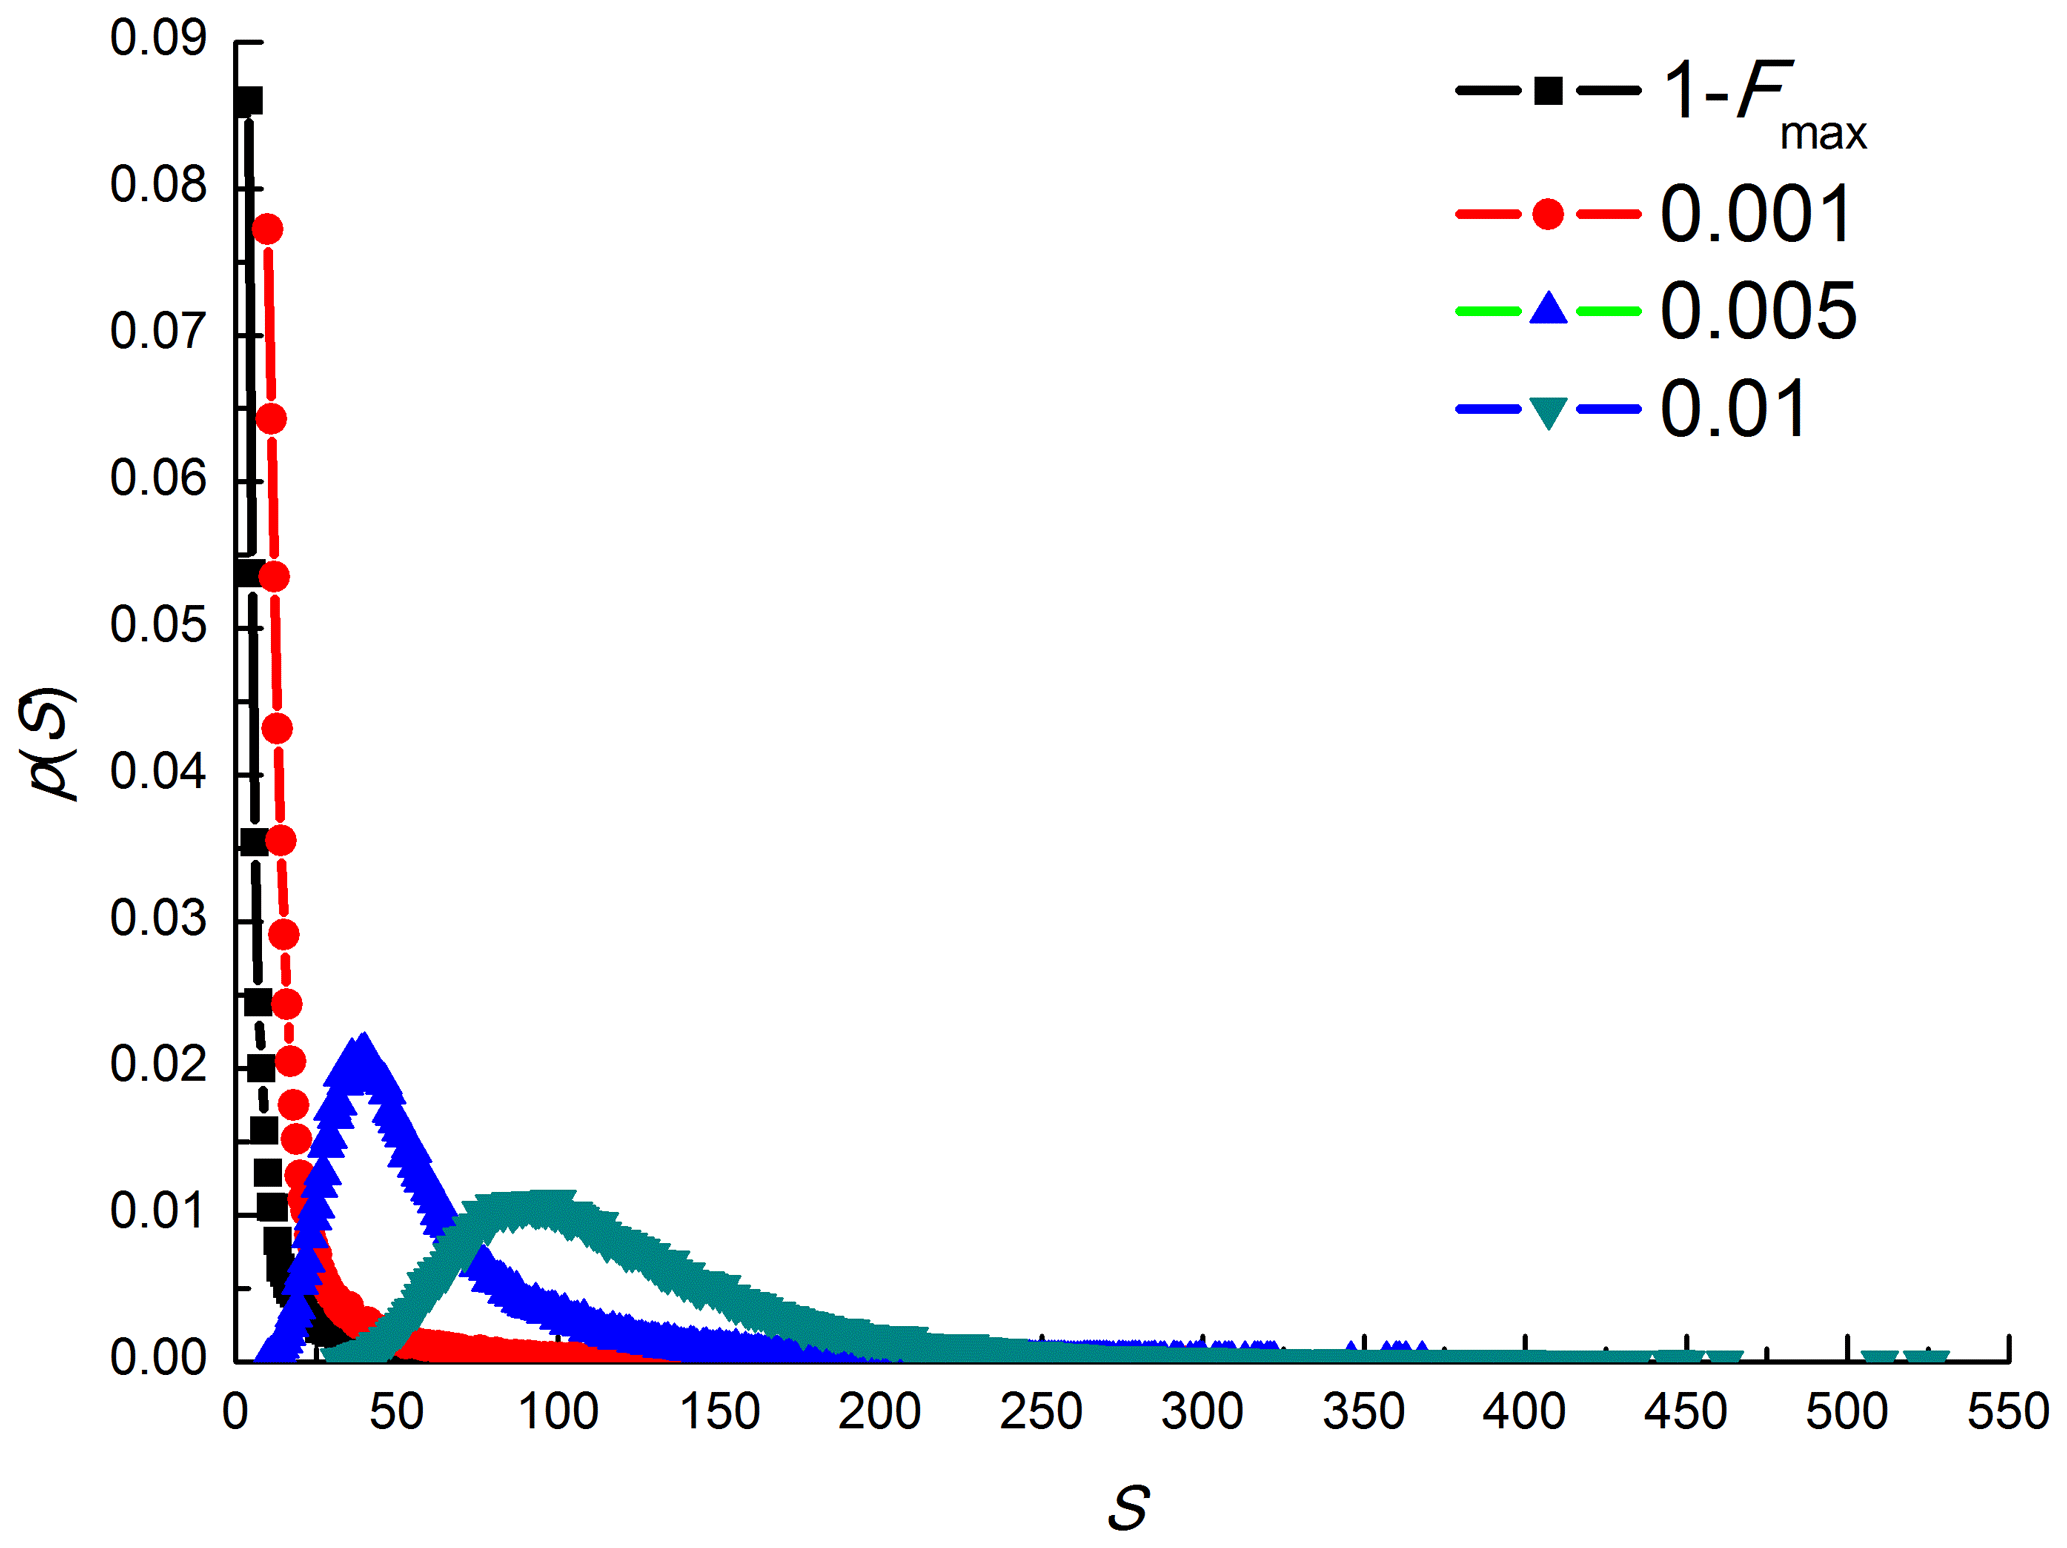
Figure 5The relation between P(S) and S. The different curves refer to different disturbance intensity.
Although cellular automata numerical simulations are the primary way to obtain the properties of a SOC system, physical experiments are necessary to verify the validity of its application to earthquake-trigged landslides. A sandpile is a classic example of SOC. Held et al. (1990) designed a physical experiment to show that a sandpile is indeed a SOC system, and subsequent studies have been carried out on various types of sandpile experiments to determine the mechanism of certain physical systems that show SOC. To better understand the physical phenomena of earthquake-induced landslides, we performed shaking table tests to study the dynamic behavior of a sandpile under different earthquake forces.
4.1 Experimental procedure
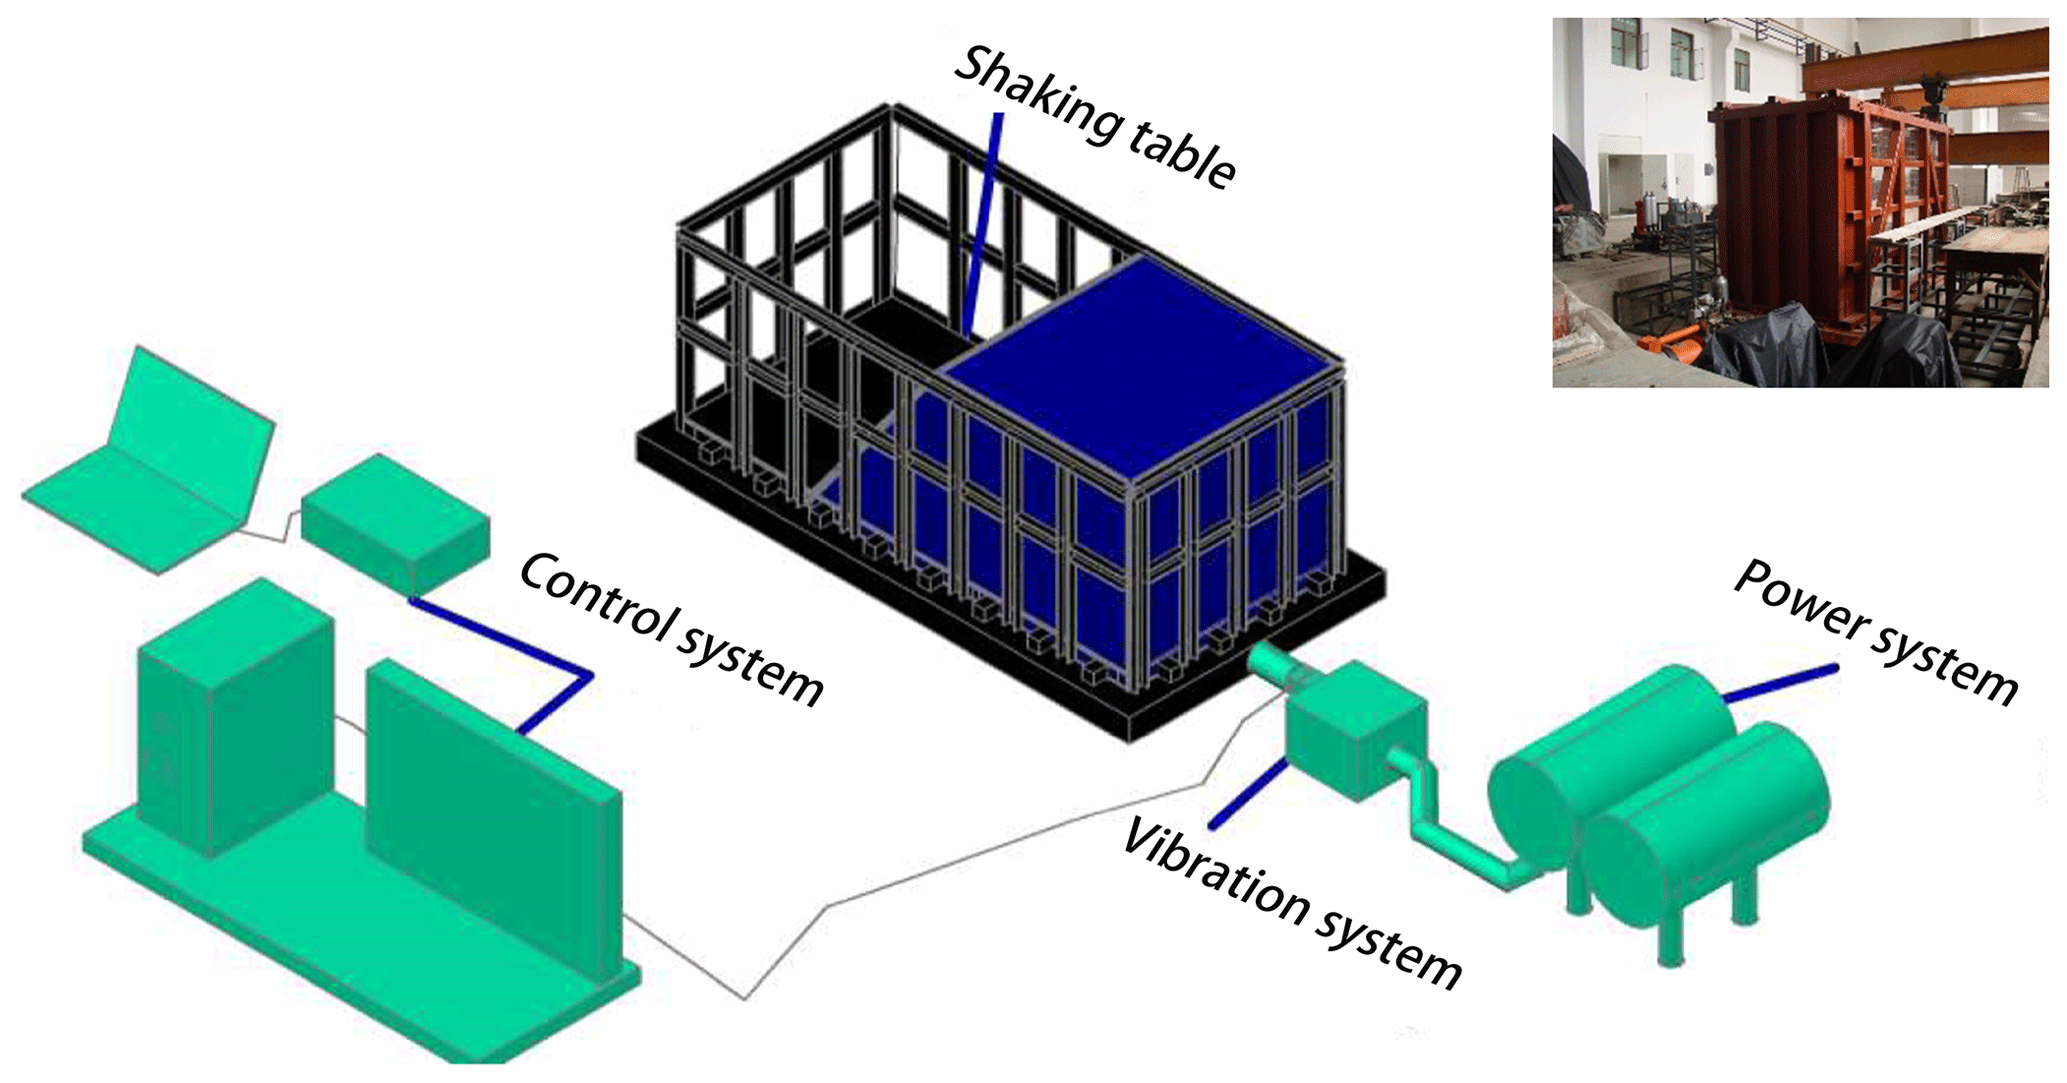
A landslide triggered by an earthquake is a natural phenomenon that occurs over a tremendously large size range (∼102–108 m3). The purpose of the experiment is to study the dynamic behavior of a sandpile and its evolution trend. The model sandpiles need not simulate a certain prototype. Previous sandpile experiments have shown that the gradation of model material, physical and mechanical parameters, and model size may influence the collapse size, but there is no influence on the relationship between collapse size and its occurrence frequency. We, therefore, did not consider similarity relations in the tests. Large-scale shaking table experiments were conducted in the Key Laboratory of High-speed Railway Engineering at Southwest Jiaotong University in China (Fig. 6). The shaking table is a single-direction table with a size of 2×4 m, capacity of 25 000 kg, and loading frequency range of 0.4–15 Hz. In the absence of an applied load, the maximum acceleration is 1.2 g, and the displacement ranges from −100 to 100 mm.
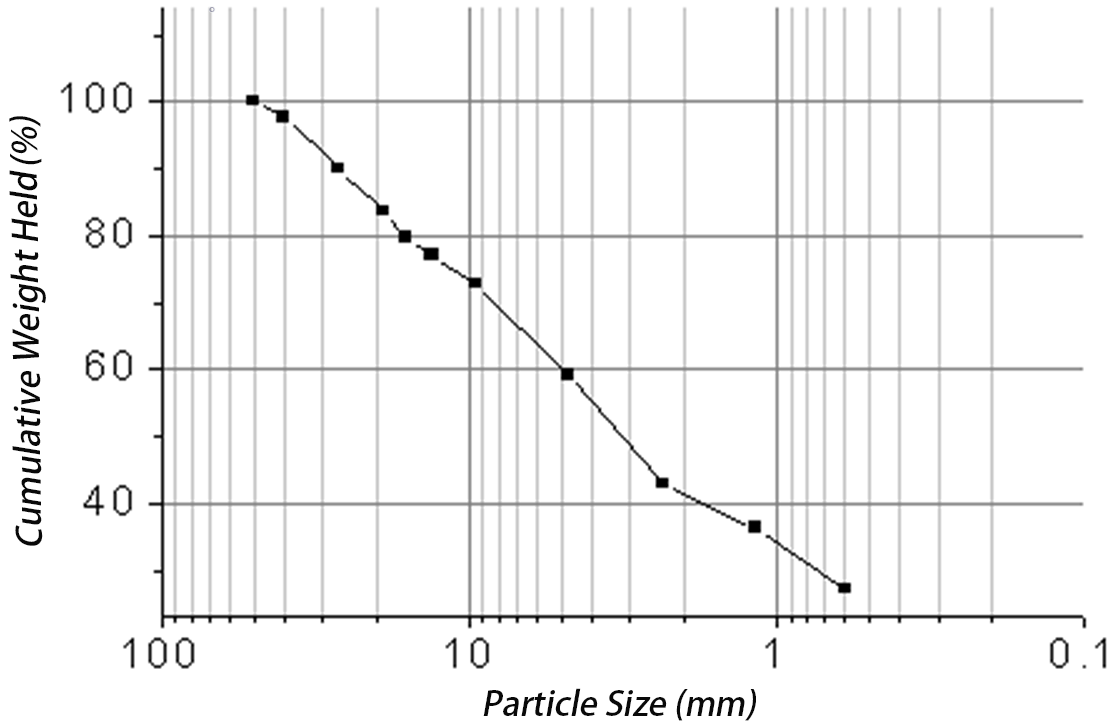
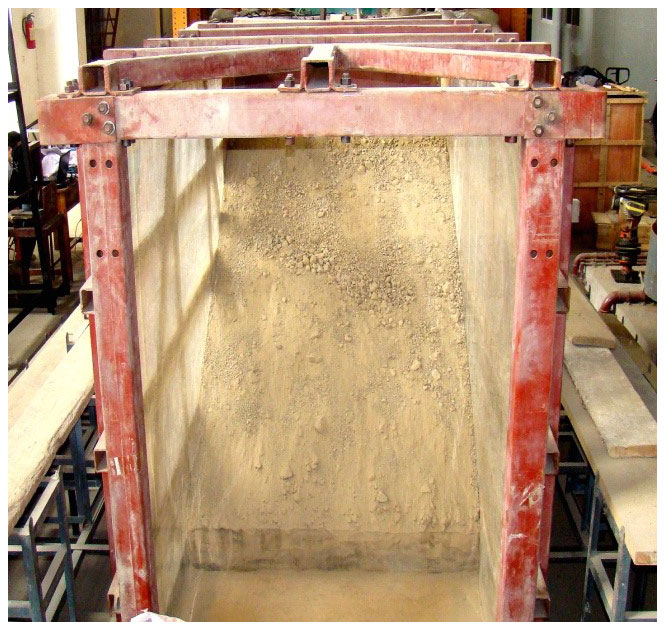
The one-sided slope sandpile was built in a steel model box with a 3.75 m length, 1.75 m width, and 2.75 m height placed on the shaking table. The sandpile material was a dried natural sand gravel collected from earthquake-triggered landslides in the Longmen Mountains. Particles larger than 50 mm were removed, and the gradation was measured (Fig. 7). When the sandpile reaches its natural angle (e.g., soil angle of internal friction), it is in a critical stable state. The sandpile has a length of 2.58 m, width of 1.5 m, height of 1.95 m, and total weight of 6800 kg (Fig. 8).
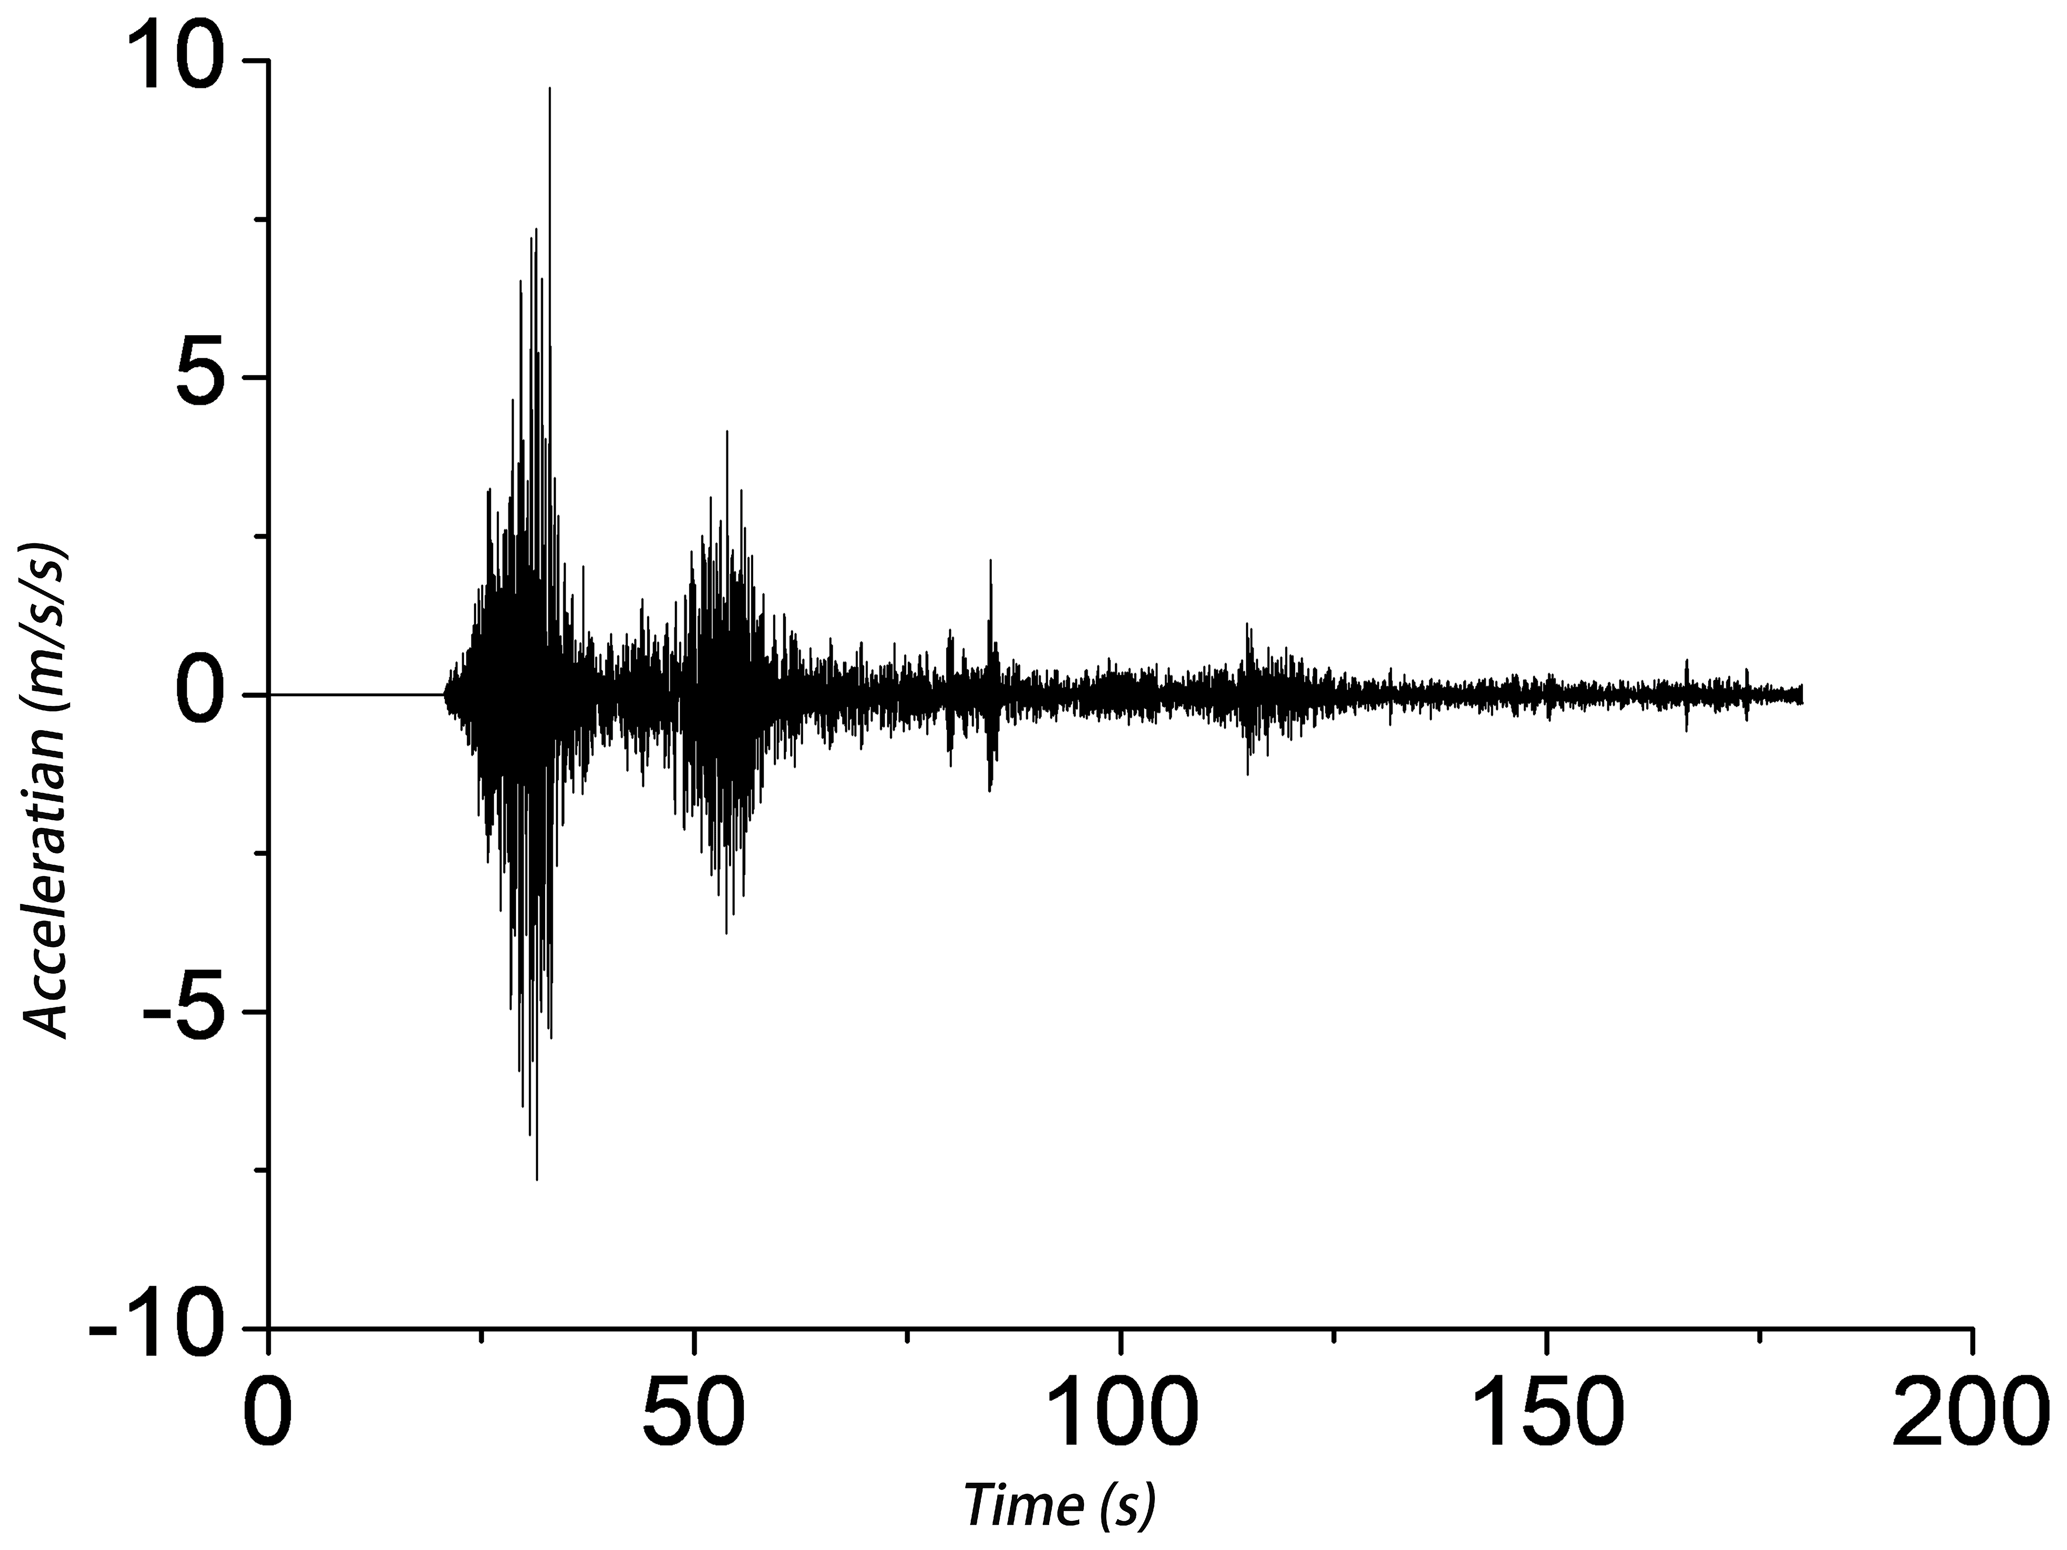
Slope responses under the excitation of field seismic waves were recorded at the Wolong (WL) seismic station of the 2008 Wenchuan earthquake (WL wave; Fig. 9). The input WL wave was proportionally scaled to its peak value.
To study the variation in sandpile dynamic characteristics with increasing disturbance intensity, we designed five sets of tests with input peak accelerations of 0.075 to 0.250 g. After inputting the excitation, the weight of the sand gravel collapse was measured as a test value. After each test, sand gravel was added from the top of the slope to ensure that the slope remained in a critical stable state. Each set of tests was run no fewer than 60 times.
4.2 Results and discussion
Let the collapse weight be x and the collapse weight frequency equal to be f(x). The analysis results are shown in Table 5. The collapse density is equal to the number of tests with collapse events divided by the total number of tests.
Table 5Statistical results of sandpile tests.

Note: when the PGA is 0.075, 0.1, and 0.125 g, some tests occurred without collapse events, and the number of tests was increased. The other groups were repeated 60 times.
When the peak ground acceleration (PGA) input was between 0.075 and 0.125 g, some tests occurred without collapses. When collapses did occur, small collapses were significantly more common than large collapses, and the results obey a power law distribution. When the PGA was between 0.15 and 0.25 g, no tests occurred with zero collapses, the power law relationship was weakened, and the results followed a lognormal distribution. The collapse density increases with increasing peak ground acceleration.
Studying the dynamic response of a sandpile with seismic waves as disturbance sources is a unique experimental method for studying SOC characteristics. Previous results have shown that the disturbance mode does not affect the sandpile dynamics characteristics, but it does influence the power law relationship parameters (Yang et al., 2007). The shaking table sandpile model tests show that changes in disturbance intensity lead to a shift in system dynamics. The physical process of the shaking table sandpile test is close to the prototype problem of earthquake-induced landslides, even though the number of experiments remains limited and provides good support for the universality of earthquake-triggered landslides in different intensity zones.
-
We analyzed data from landslides triggered by the 2013 Lushan and 2008 Wenchuan earthquakes. The results show a negative power law relationship between landslide size and frequency in the VII, VIII, and IX seismic intensity zones. The relationship becomes a weak power law in the X seismic intensity zone and changes into a lognormal distribution in the XI seismic intensity zone. Landslide density increases gradually with increasing seismic intensity. Cellular automaton simulations reveal that, with increasing disturbance intensity, the dynamical mechanism of the sandpile model changes from a strong power law to a weak power law and then to a lognormal distribution, and the avalanche density increases. The results of the shaking table sandpile model tests verify these findings. The overall landslide distribution law is therefore constrained, even though these landslides are complex and very random, and the evolution mechanism of the distribution law in different intensity zones is clarified. Although there are some possible limitations of samples size in this study, the distribution probability model of earthquake-triggered landslides and evolution model with increasing seismic intensity presented here exceed the statistical relation level of a typical sample, which is the significance of this study.
-
SOC was founded in 1987 as a branch of nonequilibrium thermodynamics, and the study of its phenomenology and precise definition continues. SOC has highlighted that thresholds, metastability, and large-scale fluctuations play a decisive role in the spatiotemporal behavior of a large class of multibody systems. However, the influence of disturbance intensity on the system dynamics behavior of SOC has not received much attention. The disturbance intensity range of a catastrophic event may span several orders of magnitude (e.g., the energy difference between a Ms 9 earthquake is 32 768 times more powerful than a Ms 6 earthquake). In the case of the 2008 Wenchuan and 2013 Lushan earthquakes, the dynamic characteristics of the SOC system undergo a strong power law, weak power law, and lognormal distribution evolution process with increasing disturbance intensity. This constraint on the evolution pattern of a SOC system behavior goes beyond the traditional field of SOC and makes a strong impetus to further develop basic SOC theory.
-
Compared with chaos theory, SOC does not greatly emphasize the initial conditions and system details which facilitate the experimental and analytical procedures. The sandpile example tends to explain nearly everything from mountain formation to stock market volatility. But if many of the unique details of mountain systems can be understood by simple cellular automata numerical simulations, it may not be realistic for most geographers and requires further validation. For example, slope structures (e.g., joints and fracture surfaces) in nature are nonuniformly distributed and natural granular materials often exhibit a wide gradation. The nonuniformity of components is one of the important characteristics of a mountain system, however, the influence of nonuniform components on the dynamics is not considered here. We briefly discuss the effect of nonuniformity on dynamics in a previous study (Guo et al., 2017). However, the heterogeneity of cell geometry, arrangement randomness, and interaction anisotropy can be considered to investigate the unique details of how nonuniformity property affects system dynamics. Further research will therefore aim to determine the deep-seated law of earthquake-induced landslides.
-
In the IX seismic intensity zone, the cumulative number–area distribution of landslides triggered by the earthquakes exhibits a negative power law relationship but with different power exponents, i.e., 1.543 for the Wenchuan earthquake and 0.955 for the Lushan earthquake. The difference in different seismic characteristics and the earthquake-affected area, such as geological and topographical conditions, may affect the power law exponents, which should be investigated in future studies.
The code of this study is available from the authors upon reasonable request.
The data of this study are available from the authors upon reasonable request.
LY designed this study, YH and LY carried out the study, and YH and LY analyzed the results and wrote the paper.
The authors declare that they have no conflict of interest.
We would like to express our gratitude to Chenwen Guo and Haiqiang Guo for their helpful contributions to this article. We thank Esther Posner, from Liwen Bianji, Edanz Editing China, for editing the English text of a draft of this paper.
This research has been supported by the National Natural Science Foundation of China (grant no. 41902302), the Sichuan Science and Technology Program of China (grant no. 2020YFH0056), the International S&T Cooperation Project of the Chinese Academy of Sciences (grant no. 131551KYSB20180042), and the Project of China Railway Eryuan Engineering Group Co. Ltd. (grant no. KYY2020054(20-22)).
This paper was edited by Behzad Ghanbarian and reviewed by two anonymous referees.
Aschwanden, M.: Self-organized criticality in astrophysics: The statistics of nonlinear processes in the universe, Springer-Praxis, New York, USA, https://doi.org/10.1007/978-3-642-15001-2, 2011. a
Aschwanden, M. J., Crosby, N. B., Dimitropoulou, M., Georgoulis, M. K., Hergarten, S., McAteer, J., Milovanov, A. V., Mineshige, S., Morales, L., Nishizuka, N., Pruessner, G., Sanchez, R., Sharma, A. S., Strugarek, A., and Uritsky, V.: 25 years of self-organized criticality: solar and astrophysics, Space Sci. Rev., 198, 47–166, https://doi.org/10.1007/s11214-014-0054-6, 2016. a
Bak P., Tang C., and Wiesenfeld K.: Self-organized criticality: An explanation of 1/f noise. Phys. Rev. Lett., 59, 381, https://doi.org/10.1103/PhysRevLett.59.381, 1987. a, b
Bak P., Tang C., and Wiesenfeld K.: Self-organized criticality, Phy. Rev. A, 38, 364, https://doi.org/10.1103/PhysRevA.38.364, 1988. a
Brunetti, M. T., Guzzetti, F., and Rossi, M.: Probability distributions of landslide volumes, Nonlin. Processes Geophys., 16, 179–188, https://doi.org/10.5194/npg-16-179-2009, 2009. a
Carrara, A., Crosta, G., and Frattini, P.: Geomorphological and historical data in assessing landslide hazard, Earth Surf. Proc. Land., 28, 1125–1142, https://doi.org/10.1002/esp.545, 2003. a
Catani, F., Casagli, N., Ermini, L., Righini, G., and Menduni, G.: Landslide hazard and risk mapping at catchment scale in the Arno River basin, Landslides, 2, 329–342, https://doi.org/10.1007/s10346-005-0021-0, 2005. a
Chen, C.-Y., Yu, F.-C., Lin, S.-C., and Cheung, K.-W.: Discussion of landslide self-organized criticality and the initiation of debris flow, Earth Surf. Proc. Land., 32, 197–209, https://doi.org/10.1002/esp.1400, 2007. a
Dahl, M.-P. J., Mortensen, L. E., Jensen, N. H., and Veihe, A.: Magnitude–frequency characteristics and preparatory factors for spatial debris-slide distribution in the northern Faroe Islands, Geomorphology, 188, 3–11, https://doi.org/10.1016/j.geomorph.2012.09.015, 2013. a
Dai, F., Xu, C., Yao, X., Xu, L., Tu, X., and Gong, Q.: Spatial distribution of landslides triggered by the 2008 Ms 8.0 Wenchuan earthquake, China, J. Asian Earth Sci., 40, 883–895, https://doi.org/10.1016/j.jseaes.2010.04.010, 2011. a
Davis, W. M.: The geographical cycle, Geogr. J., 14, 481–504, https://doi.org/10.2307/1774538, 1899.
Drossel, B. and Schwabl, F.: Self-organized critical forest-fire model, Phys. Rev. Lett., 69, 1629–1632, https://doi.org/10.1103/PhysRevLett.69.1629, 1992. a
Frattini, P. and Crosta, G. B.: The role of material properties and landscape morphology on landslide size distributions, Earth Planet. Sc. Lett., 361, 310–319, https://doi.org/10.1016/j.epsl.2012.10.029, 2013. a, b
Guo, C., Huang, Y., Yao, L., and Alradi, H.: Size and spatial distribution of landslides induced by the 2015 Gorkha earthquake in the Bhote Koshi river watershed, J. Mt. Sci., 14, 1938–1950, https://doi.org/10.1007/s11629-016-4140-y, 2017. a
Guthrie, R. H. and Evans, S.: Analysis of landslide frequencies and characteristics in a natural system, coastal British Columbia, Earth Surf. Proc. Land., 29, 1321–1339, https://doi.org/10.1002/esp.1095, 2004a. a
Guthrie, R. H. and Evans, S. G.: Magnitude and frequency of landslides triggered by a storm event, Loughborough Inlet, British Columbia, Nat. Hazards Earth Syst. Sci., 4, 475–483, https://doi.org/10.5194/nhess-4-475-2004, 2004b. a
Guzzetti, F., Malamud, B. D., Turcotte, D. L., and Reichenbach, P.: Power-law correlations of landslide areas in central Italy, Earth Planet. Sci. Lett., 195, 169–183, https://doi.org/10.1016/S0012-821X(01)00589-1, 2002. a, b
Harp, E. L. and Jibson, R. W.: Inventory of landslides triggered by the 1994 Northridge, California earthquake, Tech. rep., US Geological Survey, https://doi.org/10.3133/ofr95213, 1995. a
Harp, E. L. and Jibson, R. W.: Landslides triggered by the 1994 Northridge, California, earthquake, B. Seismol. Soc. Am., 86, S319–S332, 1996. a, b
Harp, E. L., Keefer, D. K., Sato, H. P., and Yagi, H.: Landslide inventories: the essential part of seismic landslide hazard analyses, Eng. Geol., 122, 9–21, https://doi.org/10.1016/j.enggeo.2010.06.013, 2011. a, b
Havenith, H.-B., Torgoev, I., Meleshko, A., Alioshin, Y., Torgoev, A., and Danneels, G.: Landslides in the Mailuu-Suu Valley, Kyrgyzstan – hazards and impacts, Landslides, 3, 137–147, https://doi.org/10.1007/s10346-006-0035-2, 2006. a
Held, G. A., Solina, D. H., Solina, H., Keane, D. T., Haag, W. J., Horn, P. M., and Grinstein, G.: Experimental study of critical mass fluctuations in an evolving sand pile, Phys. Rev. Lett., 65, 1120–1123, https://doi.org/10.1103/PhysRevLett.65.1120, 1990. a, b
Hergarten, S.: Self organized criticality in earth systems, vol. 2, Springer, New York, USA, https://doi.org/10.1007/978-3-662-04390-5, 2002. a
Hergarten, S.: Landslides, sandpiles, and self-organized criticality, Nat. Hazards Earth Syst. Sci., 3, 505–514, https://doi.org/10.5194/nhess-3-505-2003, 2003. a
Hergarten, S. and Neugebauer, H. J.:Self-organized criticality in a landslide mode, Geophys. Res. Lett., 25, 801–804, https://doi.org/10.1029/98GL50419, 1998. a
Hovius, N., Stark, C. P., and Allen, P. A.: Sediment flux from a mountain belt derived by landslide mapping, Geology, 25, 231–234, https://doi.org/10.1130/0091-7613(1997)025<0231:SFFAMB>2.3.CO;2, 1997. a
Huang, R.: Mechanism and geomechanical modes of landslide hazards triggered by Wenchuan 8.0 earthquake, Chinese Journal of Rock Mechanics and Engineering, 28, 1239–1249, https://doi.org/10.3321/j.issn:1000-6915.2009.06.021, 2009. a
Huang, R. and Li, W.: Analysis of the geo-hazards triggered by the 12 May 2008 Wenchuan Earthquake, China, Bull. Eng. Geol. Environ., 68, 363–371, https://doi.org/10.1007/s10064-009-0207-0, 2009. a
Iwahashi, J., Watanabe, S., and Furuya, T.: Mean slope-angle frequency distribution and size frequency distribution of landslide masses in Higashikubiki area, Japan, Geomorphology, 50, 349–364, https://doi.org/10.1016/S0169-555X(02)00222-2, 2003. a
Jaiswal, P. and van Westen, C. J.: Frequency–size relation of shallow debris slides on cut slopes along a railroad corridor: A case study from Nilgiri hills, Southern India, Natural Hazards, 61, 1263–1275, https://doi.org/10.1007/s11069-011-9978-2, 2012. a
Keefer, D. K.: Statistical analysis of an earthquake-induced landslide distribution – the 1989 Loma Prieta, California event, Eng. Geol., 58, 231–249, https://doi.org/10.1016/S0013-7952(00)00037-5, 2000. a
Li, Y., Huang, R. Q., Densmore, A. L., Zhou, R. J., and Cao, S. Y.: Basic features and research progresses of Wenchuan Ms 8.0 earthquake, Journal of Sichuan University (Engneering Science Edition), 41, 7–25, 2009. a
Liu, S.: Formation and evolution of the Longmenshan thrust belt and the western Sichuan foreland basin, Chengdu University of Science and Technology Press, Chengdu, China, 1993. a
Malamud, B. D. and Turcotte, D. L.: Self-organized criticality applied to natural hazards, Nat. Hazards, 20, 93–116, https://doi.org/10.1023/A:1008014000515, 1999. a
Malamud, B. D., Morein, G., and Turcotte, D. L.: Forest fires: an example of self-organized critical behavior, Science, 281, 1840–1842, https://doi.org/10.1126/science.281.5384.1840, 1998. a
Malamud, B. D., Turcotte, D. L., Guzzetti, F., and Reichenbach, P.: Landslide inventories and their statistical properties, Earth Surf. Proc. Land., 29, 687–711, https://doi.org/10.1002/esp.1064, 2004. a
Meunier, P., Hovius, N., and Haines, A. J.: Regional patterns of earthquake-triggered landslides and their relation to ground motion, Geophys. Res. Lett., 34, L20408, https://doi.org/10.1029/2007GL031337, 2007. a
Meunier, P., Hovius, N., and Haines, J. A.: Topographic site effects and the location of earthquake induced landslides, Earth Planet. Sci. Lett., 275, 221–232, https://doi.org/10.1016/j.epsl.2008.07.020, 2008. a
Olami, Z., Feder, H. J. S., and Christensen, K.: Self-organized criticality in a continuous, nonconservative cellular automaton modeling earthquakes, Phys. Rev. Lett., 68, 1244–1247, https://doi.org/10.1103/PhysRevLett.68.1244, 1992. a
Papadopoulos, G. A. and Plessa, A.: Magnitude–distance relations for earthquake-induced landslides in Greece, Eng. Geol., 58, 377–386, https://doi.org/10.1016/S0013-7952(00)00043-0, 2000. a
Parise, M. and Jibson, R. W.: A seismic landslide susceptibility rating of geologic units based on analysis of characteristics of landslides triggered by the 17 January, 1994 Northridge, California earthquake, Eng. Geol., 58, 251–270, https://doi.org/10.1016/S0013-7952(00)00038-7, 2000. a
Pelletier, J. D., Malamud, B. D., Blodgett, T., and Turcotte, D. L.: Scale-invariance of soil moisture variability and its implications for the frequency-size distribution of landslides, Eng. Geol., 48, 255–268, https://doi.org/10.1016/S0013-7952(97)00041-0, 1997. a
Qi, S., Xu, Q., Lan, H., Zhang, B., and Liu, J.: Spatial distribution analysis of landslides triggered by 2008.5.12 Wenchuan Earthquake, China, Eng. Geol., 116, 95–108, https://doi.org/10.1016/j.enggeo.2010.07.011, 2010. a
Rodrıguez, C. E., Bommer, J. J., and Chandler, R. J.: Earthquake-induced landslides: 1980–1997, Soil Dyn. Earthq. Eng., 18, 325–346, https://doi.org/10.1016/S0267-7261(99)00012-3, 1999. a
Sornette, D.: Why stock markets crash: critical events in complex financial systems, vol. 49, Princeton University Press, Princeton, USA, https://doi.org/10.1063/1.1712506, 2003. a
Stark, C. P. and Hovius, N.: The characterization of landslide size distributions, Geophys. Res. Lett., 28, 1091–1094, https://doi.org/10.1029/2000GL008527, 2001. a, b
Van Den Eeckhaut, M., Poesen, J., Govers, G., Verstraeten, G., and Demoulin, A.: Characteristics of the size distribution of recent and historical landslides in a populated hilly region, Earth Planet. Sci. Lett., 256, 588–603, https://doi.org/10.1016/j.epsl.2007.01.040, 2007. a
Xu, C., Xu, X., Yao, X., and Dai, F.: Three (nearly) complete inventories of landslides triggered by the May 12, 2008 Wenchuan Mw 7.9 earthquake of China and their spatial distribution statistical analysis, Landslides, 11, 441–461, https://doi.org/10.1007/s10346-013-0404-6, 2014. a, b
Xu, X., Su, L., and Liu, C.: The spatial distribution characteristics of shallow fissures of a landslide in the Wenchuan earthquake area, J. Mt. Sci., 13, 1544–1557, https://doi.org/10.1007/s11629-015-3487-9, 2016. a, b
Yang, Q., Yao, L., Qi, Y., and Gao, Z.-N.: Analysis of self-organized criticality of centrifugal model tests on granular mixtures and earthquake effect, Chinese Journal of Geotechnical Engineering, 29, 1630–1635, https://doi.org/10.3321/j.issn:1000-4548.2007.11.006, 2007. a
Yao, L. and Huang, Y.: Self-organized criticality of mountain system catastrophic behaviors, Journal of Southwest Jiaotong University, 51, 313–330, https://doi.org/10.3969/j.issn.0258-2724.2016.02.011, 2016. a
Yin, Y., Wang, F., and Sun, P.: Landslide hazards triggered by the 2008 Wenchuan earthquake, Sichuan, China, Landslides, 6, 139–152, https://doi.org/10.1007/s10346-009-0148-5, 2009. a