the Creative Commons Attribution 4.0 License.
the Creative Commons Attribution 4.0 License.
 | 18 Feb 2019
Exploring the sensitivity of Northern Hemisphere atmospheric circulation to different surface temperature forcing using a statistical–dynamical atmospheric model
Stefan Petri
Jascha Lehmann
Erik Peukert
Dim Coumou
Climate and weather conditions in the mid-latitudes are strongly driven by the large-scale atmosphere circulation. Observational data indicate that important components of the large-scale circulation have changed in recent decades, including the strength and the width of the Hadley cell, jets, storm tracks and planetary waves.
Here, we use a new statistical–dynamical atmosphere model (SDAM) to test the individual sensitivities of the large-scale atmospheric circulation to changes in the zonal temperature gradient, meridional temperature gradient and global-mean temperature. We analyze the Northern Hemisphere Hadley circulation, jet streams, storm tracks and planetary waves by systematically altering the zonal temperature asymmetry, the meridional temperature gradient and the global-mean temperature. Our results show that the strength of the Hadley cell, storm tracks and jet streams depend, in terms of relative changes, almost linearly on both the global-mean temperature and the meridional temperature gradient, whereas the zonal temperature asymmetry has little or no influence. The magnitude of planetary waves is affected by all three temperature components, as expected from theoretical dynamical considerations. The width of the Hadley cell behaves nonlinearly with respect to all three temperature components in the SDAM. Moreover, some of these observed large-scale atmospheric changes are expected from dynamical equations and are therefore an important part of model validation.
- Article
(1435 KB) - Full-text XML
- BibTeX
- EndNote


Large-scale atmosphere dynamics including Hadley cells, jet streams, storm tracks and planetary waves play a key role in the general circulation of the atmosphere, determining climatic conditions worldwide. There is emerging evidence that these large-scale dynamics have significantly changed in recent observations and/or might do so in climate change projections of the 21st century.
Hadley cells are large-scale atmospheric circulations in the tropics and are responsible for the transport of heat and moisture from the Equator to the mid-latitudes (D'Agostino and Lionello, 2016). Recent literature suggests that the Hadley cells have widened in the past few decades due to ozone depletion in the Southern Hemisphere (Kang et al., 2011; Son et al., 2009) and due to increases in different warming agents as carbon dioxide and tropospheric ozone in the Northern Hemisphere (Allen et al., 2012). Further possible drivers of the Hadley cell dynamics are sea surface temperature (SST) variations, which may lead to tropical contraction (Allen et al., 2014), stratospheric cooling, global warming or changes in baroclinic eddy phase speeds (Chen et al., 2014). While most studies based on reanalysis products observe that, together with this widening, there is also a strengthening of the Hadley cells (Nguyen et al., 2013), and modeling studies project a weakening over the 21st century under a high-emission scenario (Lu et al., 2007). This discrepancy may be explained by relatively short observational records, large natural variability or model deficiencies (Allen et al., 2014).
Changes in the strength and the width of the Hadley cell circulation have strong implications for a variety of atmospheric phenomena such as jet streams, extratropical storms and planetary waves.
Jet streams are upper-level fast currents of westerly winds that circulate around the hemisphere. The jet stream is caused by momentum conservation, when air of the Hadley cell moves poleward, and by meridional contrasts in solar heating (Woollings, 2010). Therefore, changes in the Hadley cell directly influence the jet. Storm tracks are associated with fast-traveling Rossby waves that move from west to east, which drive the jet stream (Totz et al., 2018). Under climate change, a weakening of the northern subtropical jet stream in winter is observed by most studies (Molnos et al., 2017; Rikus, 2015), though a few studies also observe a strengthening trend (Pena-Ortiz et al., 2013). The underlying drivers of those changes are still debated. One possible driver is the Arctic amplification leading to a decreasing meridional temperature gradient and a weakening of the jet stream and storm tracks.
Storm tracks play a crucial role in modulating precipitation in the Earth system (Hawcroft et al., 2012; Lehmann and Coumou, 2015; Raible et al., 2007). Yin (2005) studied storm tracks under climate change using 15 coupled climate models and found that storm tracks shift poleward and intensify under climate change in winter. In addition, O'Gorman (2010) discovered that the storm track intensity is nonlinearly related to global warming. Coumou et al. (2015) show that during the satellite period (1979–2013) storm tracks have significantly weakened in boreal summer. They argue that the weakening might be related to a decreasing meridional temperature gradient. Consistently, models of the Coupled Model Intercomparison Project Phase 5 (CMIP5) project a further decrease in summer storm track activity under a high-emission scenario until the end of the 21st century (Lehmann et al., 2014).
In contrast to the changes in these large-scale circulation components, a recent study by Barnes and Polvani (2013) indicates that there are no significant trends in the strength of long-term quasi-stationary planetary waves under climate change.
Planetary waves are disturbances of longer timescales (beyond 15 days) and are manifested by a displacement of the circumpolar flow out of zonal symmetry, as is apparent at high latitude. They lead to a gradual undulation of the jet stream about latitude circles (Salby, 2012). These planetary waves strongly interact with storm tracks in the mid-latitudes and impact their location and activity (Branstator, 1994; Hoskins and Valdes, 1990). The barotropic component of the planetary waves especially has a strong influence on the storm tracks and can change the distribution of storms by steering the disturbances (Branstator, 1994).
The large-scale atmospheric circulation is mainly a result of large-scale temperature differences between the Equator and the poles and between the ocean and land. A further key driver is the angular momentum as shown by the study of Egger et al. (2007) Different modeling studies have thus tried to examine the influences of different temperature sources on changes in mid-latitude circulation. Using an idealized general circulation model (GCM), Butler et al. (2010) separate the temperature effects by using different heating sources. Their main findings are that a warming tropical troposphere causes poleward shifts in the extratropical tropospheric storm tracks and a weakened stratospheric Brewer–Dobson circulation; a polar stratosphere cooling leads also to a shift of the extratropical storm tracks, and a warming at the polar surface results in a equatorward shift of the storm tracks. With their approach Butler et al. (2010) can attribute which forcing has the most important influence on the shift of jet streams, storm tracks, etc. In a study from 2011, Butler et al. (2011) presented an alternative perspective on the response of the mid-latitude tropospheric circulation to zonal-mean tropical heating. The projection of the heating onto the isentropic surfaces at extratropical latitudes drives the poleward shift in wave generation at lower levels. In addition, the poleward shift in the heat fluxes within the troposphere and the diffusive nature of eddy fluxes of the polar vortex lead to a poleward shift in wave breaking near the tropopause.
However, none of the studies mentioned above analyzed the impact of zonal temperature asymmetry and the meridional temperature gradient as well as global-mean temperature by changing the temperature components directly without adding a heat source or increasing CO2. For that reason, changes in the Hadley cell, jet streams, planetary waves and storm tracks might not be directly assigned to individual temperature components.
In this study, we analyze the full temperature space with a novel systematic approach using a statistical–dynamical atmospheric model (SDAM; Totz et al., 2018). This way we can scan for “nonlinearities” in the system (i.e., the Hadley cell edge – HCE – might only be very sensitive to meridional temperature gradients for a narrow range of meridional temperature gradient values, and outside of that range it is not sensitive). It is important to know such nonlinearities, as these could imply more abrupt changes under global warming.
The statistical–dynamical atmospheric model Aeolus 1.0 (Totz et al., 2018) is explained in Sect. 2 in more detail. In Sect. 3, we describe the data used for the experiments, the separation of the temperature components and the analyzed dynamical variables. In Sect. 4 we present the results, and in Sect. 5, we compare them with the literature. In Sect. 6 we provide a short discussion on the robustness and an interpretation of our results. We conclude with a summary in Sect. 7.
The experiments are run with the statistical–dynamical atmospheric model Aeolus 1.0 (Coumou et al., 2011; Totz et al., 2018). It is a model with 2.5 dimensions, with the vertical dimension coarsely resolved, therefore belonging to the model class of intermediate complexity atmosphere models (Claussen et al., 2002; Petoukhov et al., 2000). Aeolus is based on time-averaged (over short timescales) equations in which transient eddies are parameterized in terms of the large-scale field (Peixoto and Oort, 1992; Saltzman, 1978). This means that instead of solving every eddy directly, only the ensemble mean eddy characteristics (in terms of heat, water vapor and momentum transport) are solved. The essential difference compared to more widely used GCMs is thus the point of truncation in the frequency spectrum of atmospheric motion (Saltzman, 1978). This different approach allows for much coarser spatial and temporal discretization, making SDAMs computationally efficient, because the synoptic waves are parameterized in terms of the large-scale wind field which is the basic idea of a statistical–dynamical method. The model includes the two-way dynamical interactions between parameterized storms and resolved westerlies. A full description can be found in Coumou et al. (2011).
The model has five vertical levels in the troposphere, with the model top at 10 000 m altitude. Aeolus 1.0 has a “dummy” stratosphere (i.e., its physics and dynamics are not resolved) in order to have a boundary condition at the top of the troposphere. In this experiment we excluded topographic influences, and it is an atmosphere-only setup using prescribed sea level temperatures.
Aeolus 1.0 contains a full hydrological cycle consisting of three-layer stratiform cloud plus convective cloud scheme, as presented and validated in Eliseev et al. (2013). The convective plus three-layer stratiform cloud scheme includes low-level, mid-level and upper-level stratiform clouds. The equation for humidity is a prognostic equation and is described in Petoukhov et al. (2000).
Parameter values for the dynamical core were taken from the calibration process, as described in Totz et al. (2018), which optimizes the model's representation of the tropospheric large-scale circulation.
For more information, such as comparisons of Aeolus 1.0 with GCMs or the equations for planetary waves, zonal-mean meridional and zonal-mean velocities as well as the azonal wind velocities, we refer the reader to Totz et al. (2018).
3.1 Aeolus forcing parameters
The simulations are forced by climatological (1979–2014) winter mean (December–January–February: DJF) data of SST and specific humidity at the surface, using ERA-Interim data from the European Centre for Medium-Range Weather Forecasts (ECMWF; Dee et al., 2011). First, the data are regridded to (longitude×latitude). In this experiment, atmospheric temperatures extrapolated to sea level and humidity are prescribed to decouple the dynamics from diabatic heating and associated temperature changes. This way, the dynamical core equilibrates the prescribed temperature and humidity patterns without any additional complicating factors.
In the Aeolus stand-alone mode, the output is on the same time step as the input, i.e., seasonal means. However, internally, the time stepping of the solver is in 1 h resolution. In Aeolus, the synoptic wind fields u′ and v′ are parameterized in terms of the large-scale long-term fields (i.e., the seasonal mean fields). Detailed information is provided in Coumou et al. (2011).
We then test how different changes in the temperature profiles affect different aspects of the circulation. We do thousands of individual simulations to disentangle and separately analyze the effect of the global-mean temperature, Equator-to-pole temperature gradient and east–west temperature differences.
3.2 Specifications of the surface temperature
In this and the following sections, the angle brackets denote time-averaged quantities, the overline denotes zonal-mean quantities, the prime indicates synoptic scale components (2–6-day period), and the star indicates azonal components, i.e., deviations from the zonal mean.
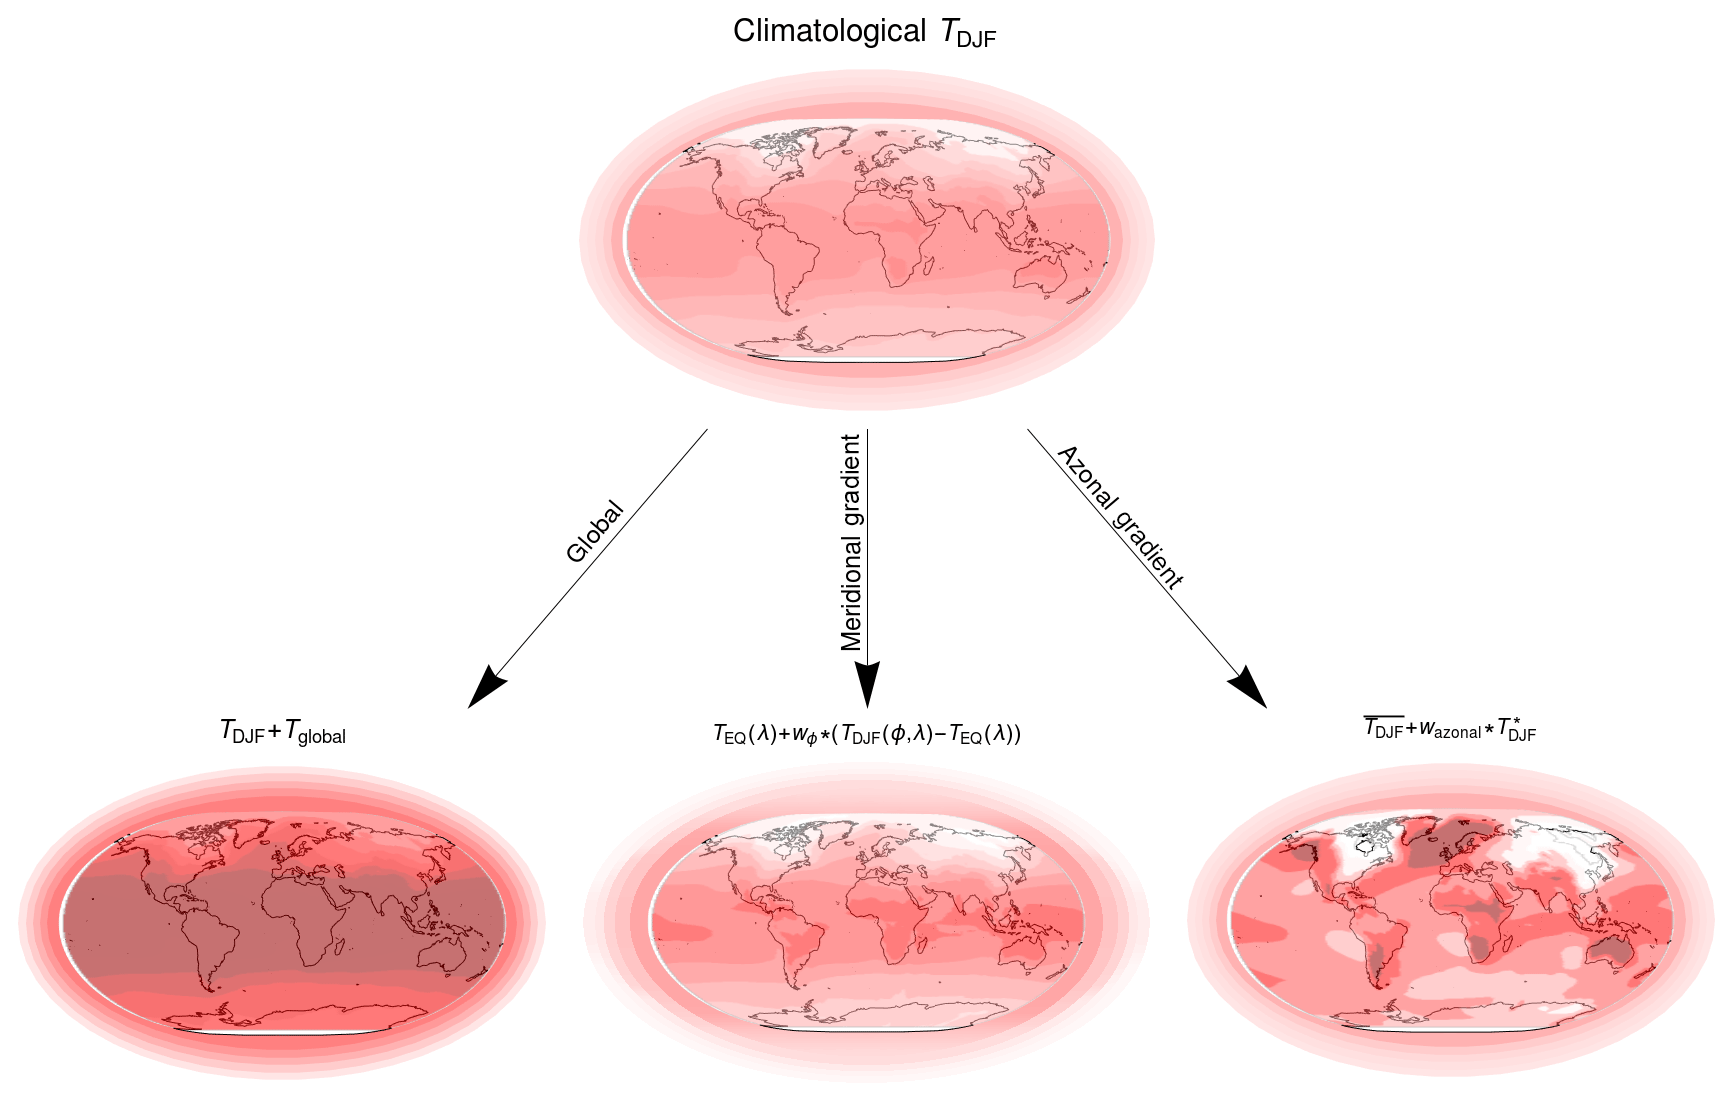
For the sensitivity analysis we vary three different temperature components: (1) the meridional temperature gradient , (2) the zonal temperature asymmetry T* (i.e., deviations from the zonal mean) and (3) the global-mean temperature Tglobal.
We change the temperature for each grid cell for the three components in three steps. First, the parameter is used to vary the meridional temperature gradient by cooling and/or warming the poles:
whereby ϕ and λ are respectively latitude and longitude, TDJF(ϕ,λ) is the original temperature, TEQ(λ) is the temperature at the Equator, and T1(ϕ,λ) is the altered temperature. In temperature T1 only the meridional temperature gradient is altered or updated, and the temperature change in the azonal component as well as the global-mean temperature are updated in the next steps. The parameter is varied between 0.75 and 1.1 (with steps of 0.025) to examine the behavior of the dynamical core under conditions between −25 % to +10 % of their present-day wintertime climatological values.
In the second step the global-mean temperature is adapted to the original global-mean temperature TDJF, and global-mean temperature is varied by the parameter Tglobal:
whereby Mean(T1) is the global-mean temperature of T1, and Mean(TDJF) is the global-mean temperature of TDJF.
In the third step, the parameter wazonal is used to alter the azonal temperature, which is added to the zonal-mean temperature :
This way , wazonal=1 and Tglobal=0 indicate present-day conditions. The temperature perturbation TFinal is the final temperature based on all three temperature components and is used as model input that the dynamical core equilibrates. The temperature perturbations are applied at sea level and propagate to the upper levels based on the lapse rate equation. A schematic plot of the different temperature perturbations is shown in Fig. 1.
Also the parameter wazonal is varied between 0.75 and 1.1 (with steps of 0.025). These limits roughly correspond to expected temperature gradients during the last glacial maximum scenario and in a 2×CO2 scenario (Coumou et al., 2011). Large zonal temperature differences, i.e., large values of wazonal, imply strong temperature deviations between land masses and oceans. Small values represent amplified warming of the poles, compared to the Equator, and thus a reduced meridional temperature gradient.
The parameter Tglobal is altered between −4 and +4 K (with steps of 4 K) relative to the climatological present-day (PD) temperature (1979–2014). This range covers climate variability over the past million years and possible near-future changes.
For each temperature component, we determine its influence on the strength and its width of the Hadley cell as well as the strength of zonal-mean jets, storm tracks and planetary waves in the Northern Hemisphere.
Since the changes for the zonal temperature asymmetry and the meridional temperature gradients are relative, it can be that in terms of absolute values the zonal temperature asymmetry is greater than that of the meridional temperature gradient.
To force the Aeolus dynamical core, we use perturbed surface temperature profiles derived from the ERA-Interim winter climatology as explained above. We performed 2025 simulations with a regular 3-D parameter space using the multi-run simulation environment SimEnv, which provides a tool to inspect the model's behavior in the parameter space by discrete numerical sampling (Flechsig et al., 2013).
3.3 Dynamical variables
To obtain the strength of the jet stream for this analysis, we use seasonally (DJF) averaged zonal mean and vertical averaged zonal wind from 3000 to 9000 m (corresponding to 200 to 700 mbar). For simplicity, we define the jet stream strength as the maximum of between 10 and 80∘ N of the vertical averaged wind velocity.
We define the strength of the Hadley cell as the maximum of the meridional mass stream function integrated between 200–700 mbar, as well as between 0 and 90∘ latitude, and the width as the distance between the mass flux zero crossings near the 0 and 30∘ latitude.
As a measure of storm track activity we calculate the eddy kinetic energy , whereby u′and v′ are the zonal and meridional synoptic wind velocity. We average the eddy kinetic energy over all five pressure levels and calculate the maximum between 10 and 80∘ N to analyze the strength and shift of the storm track activity.
We calculate the strength of the planetary waves by averaging all positive values between 20–80∘ N of the azonal wind components 〈u*〉 and 〈v*〉.
We compare and analyze the zonal-mean dynamical variables of eddy kinetic energy (which captures storm track activity), zonal-mean zonal wind velocity and the vertical integral of the lower tropospheric integrated mass flux as well as azonal wind velocities 〈u*〉 and 〈v*〉.
4.1 Tropical circulation
4.1.1 Strength and width of the Hadley cell
The integrated mass flux in the lower troposphere of the present-day modeled climatological Northern Hemisphere (NH) winter values (black line in Fig. 2) captures the shape of the red curve well from ERA-Interim data. In particular, the maximum strength, defined as the minimum between the zero crossings, is close to the ERA-Interim data. Bigger differences exist in the SH. This model bias might be related to the missing Antarctic ice sheet, upper-tropospheric ozone, the constant lapse rate assumption or fundamental limitations of the equations. Another reason could be due to the statistical nature of the eddy representation in the SDAM, since the summer Hadley cell (HC) is dominated by eddy momentum flux divergence (Schneider and Bordoni, 2008).
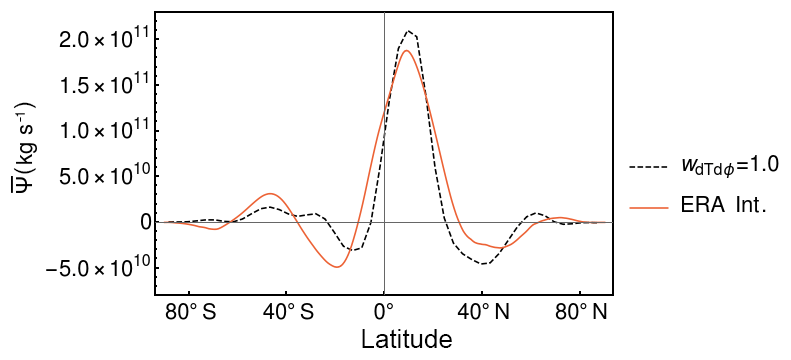
Figure 2Integrated meridional mass stream function in the lower troposphere. The black line indicates model output for and wazonal=1, and the red line indicates the ERA-Interim climatological boreal winter data.
Zero-crossing refers to the point in the graph where the function f(x) crosses the y=0 line. The modeled Hadley cell's width, defined as the distance between the mass flux zero crossings near the 0 and 30∘ latitude, is smaller than in ERA Interim.
For further analysis we plot the width (Fig. 3) and strength (Fig. 4) of the Hadley cell as a function of , wazonal and ΔTG,PD, whereby ΔTG,PD is the difference between the present-day global-mean temperature and the altered global-mean temperature. In general, both a stronger meridional temperature gradient and a stronger zonal temperature contrast lead to a nonlinear broadening of the Hadley cell width; for meridional temperature gradients smaller than the present day, the width is smaller for larger global-mean temperature. The Hadley cell expands for a stronger meridional temperature gradient and even for a greater zonal temperature asymmetry as well, but it expands with a smaller rate.
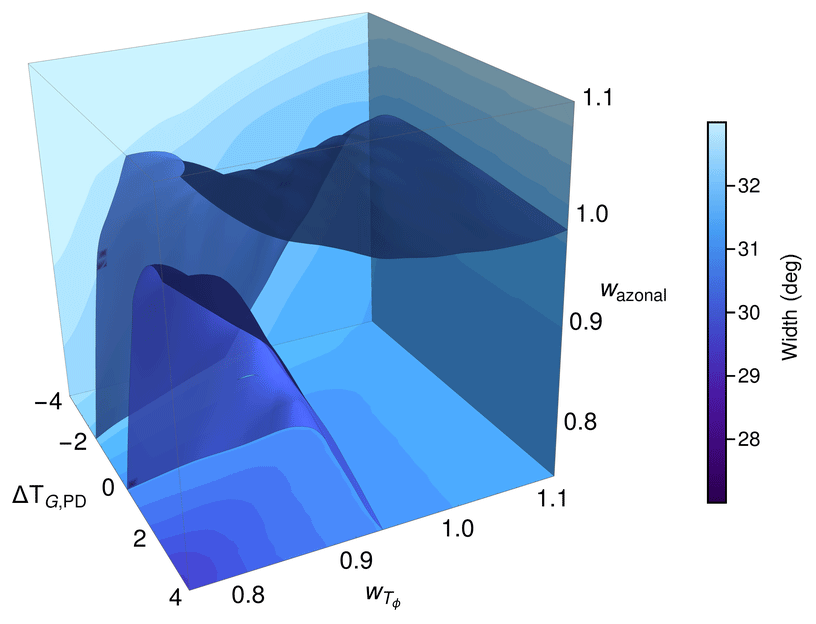
Figure 3Width of the Hadley cell in relation to and wazonal and ΔTG,PD, whereby ΔTG,PD is the difference between the present-day temperature and the altered global-mean temperature in boreal winter.
For meridional temperature gradients larger than the present day, the influence of the global-mean temperature and meridional temperature gradient are less significant, and the values of the zonal temperature asymmetry play a bigger role. In this case larger values of the zonal temperature asymmetry lead to a larger width of the Hadley cell. However, depending on the global-mean temperature an increase of the zonal temperature asymmetry can also lead to a decrease of the Hadley cell width, e.g., , and wazonal≥0.85.
The Hadley cell width shows larger changes in response to changes in the meridional temperature gradient than for changes in the zonal temperature asymmetry, indicating that the former has a stronger relative influence.
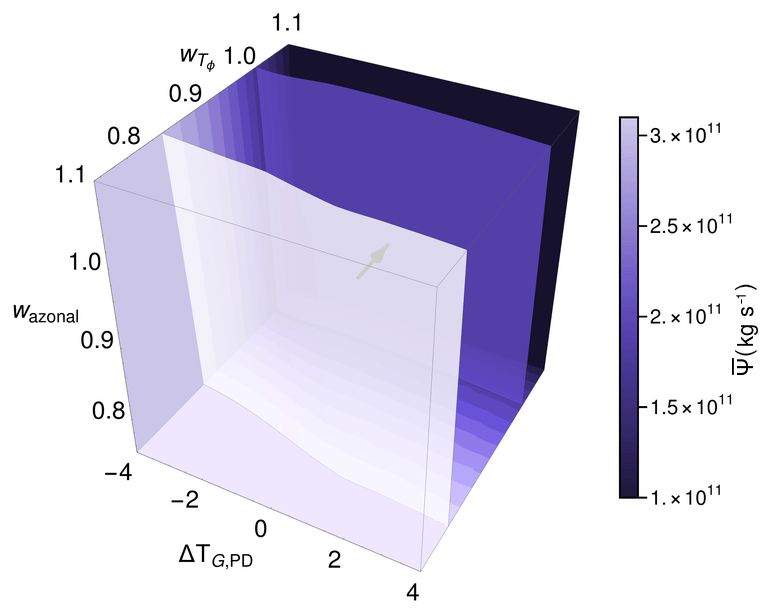
Figure 4Strength of the Hadley cell in relation to and wazonal and ΔTG,PD. The arrow points in the direction of the strongest gradient in boreal winter.
The Hadley cell strengthens with an increasing meridional gradient and depends more strongly on global-mean temperature than on wazonal (Fig. 4).
4.2 Extratropical circulation
4.2.1 Strength of the jet stream
The jet stream locations and strengths for both hemispheres are detectable as two distinct maxima in the zonal-mean zonal wind velocity in ERA Interim (Fig. 5a). Aeolus reasonably reproduces the main jet stream features in terms of spatial position and magnitude (Fig. 5c). The modeled magnitude of the jet in the Northern Hemisphere is in better agreement with reanalysis data than in the Southern Hemisphere. This is likely related to the fact that Aeolus is not coupled to an ice model, thus effects of the Antarctic ice sheet are not considered. The model reasonably reproduces near-surface tropical easterlies (“trade winds”) at low latitudes.
Figure 5b and d show the impact of changes in the meridional temperature gradient on jet stream dynamics. With a higher meridional temperature gradient, the strength of the jet stream increases and with a lower temperature gradient, the strength decreases. For present-day climatology values, the jet stream strength is about 25 m s−1 in the Northern Hemisphere. For a decrease of 10 % of the temperature gradient the velocity weakens to 20 m s−1. With an increase of 10 % of the meridional temperature, the jet stream velocity is more than 30 m s−1, and with 10 %, it is stronger in the Northern Hemisphere.
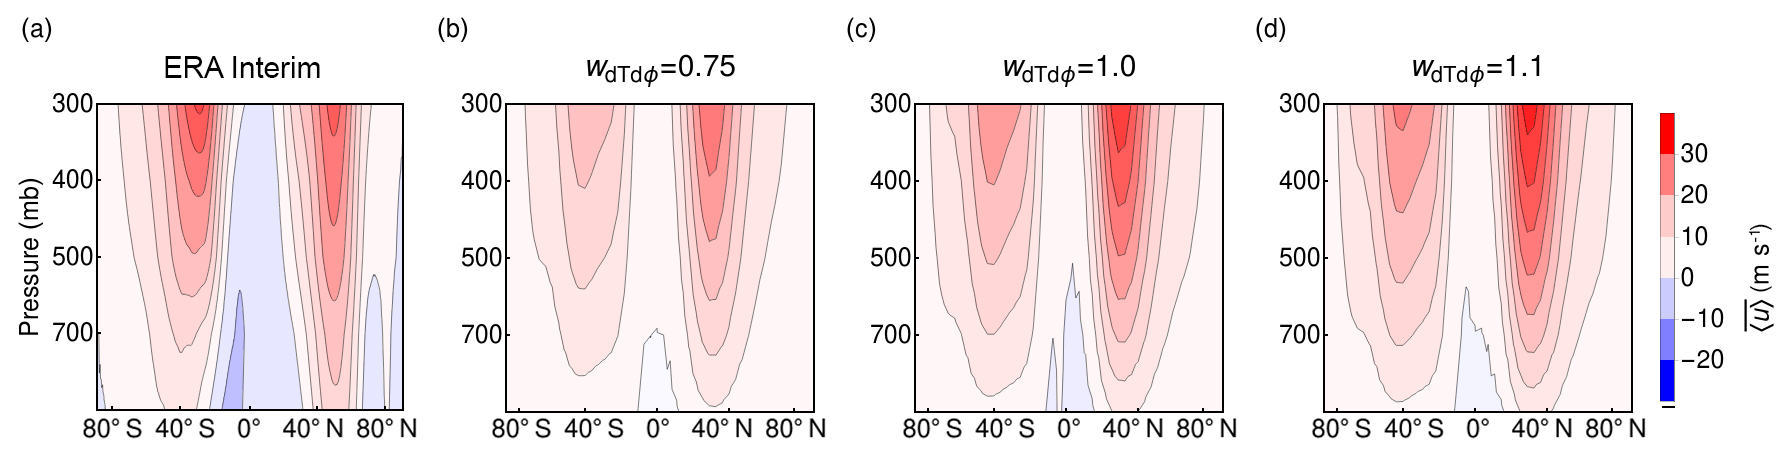
Figure 5Zonal mean zonal wind velocity representing the jet streams in boreal winter. Panel (a) shows ERA-Interim data, and the others show results from Aeolus with different . In (b), , in (c), and in (d), . All other parameters are set to standard values.
This is also observed in Fig. 6, where the jet stream strength is shown as function of , wazonal and ΔTG,PD.
The strength of the jet stream is sensitive to the meridional temperature gradient and to the global-mean temperature. The zonal temperature contrasts have little influence on the jet stream strength.
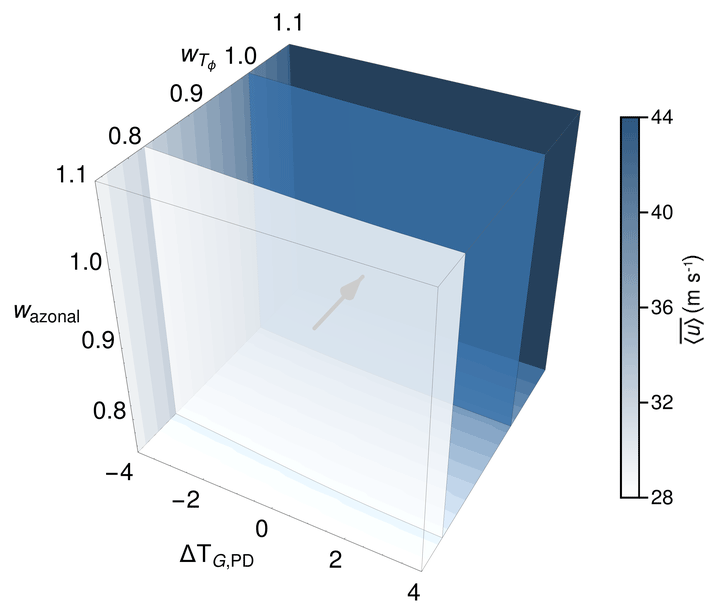
Figure 6Jet stream strength defined by the maximum of the zonal-mean zonal wind velocity () between 10 and 80∘ N at a height of 9000 m (corresponds to 300 mbar) in relation to and wazonal and ΔTG,PD in boreal winter.
4.2.2 Strength of the storm track activity
The NH winter climatological (1979–2014) storm track's activity in Aeolus (Fig. 7c) is similar to ERA-Interim data (Fig. 7a).
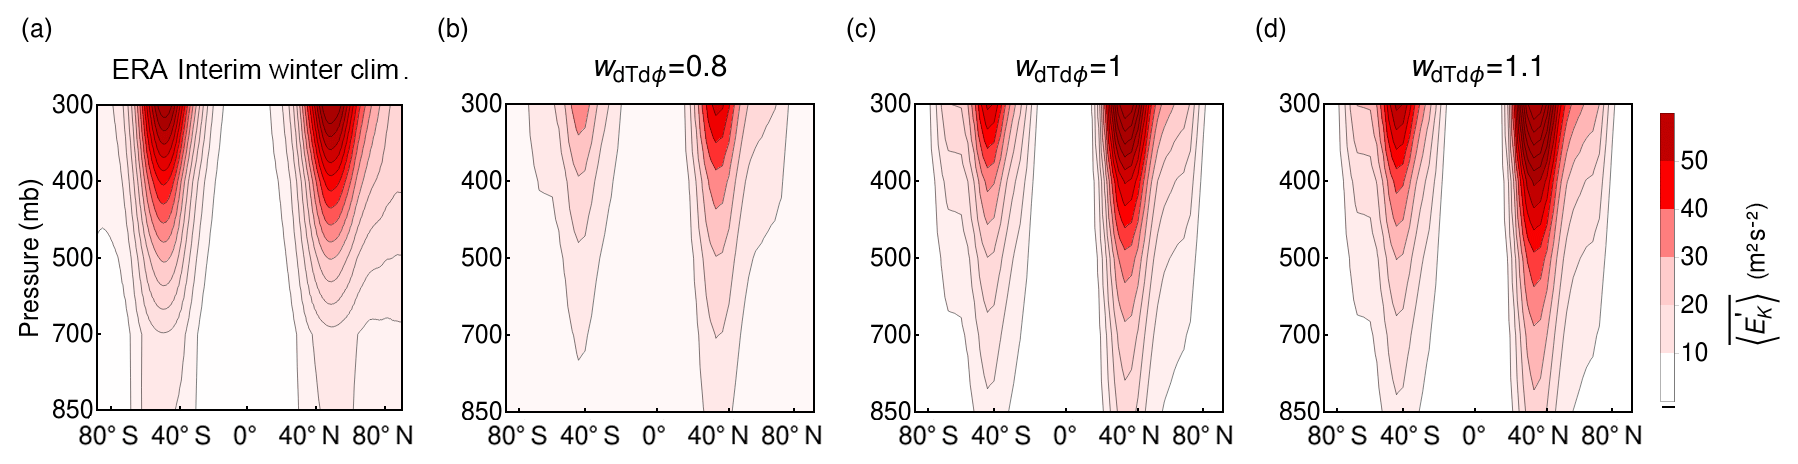
Figure 7Eddy kinetic energy representing storm track activity in boreal winter. Panel (a) shows ERA-Interim data, and (b)–(d) show data from Aeolus with different poleward temperature gradients . In (b), , in (c), and in (d), . All other parameters are set to climatology. With larger gradients, the storm track activity gets stronger.
Figure 7b–d show that storm track activity increases with an increasing temperature gradient.
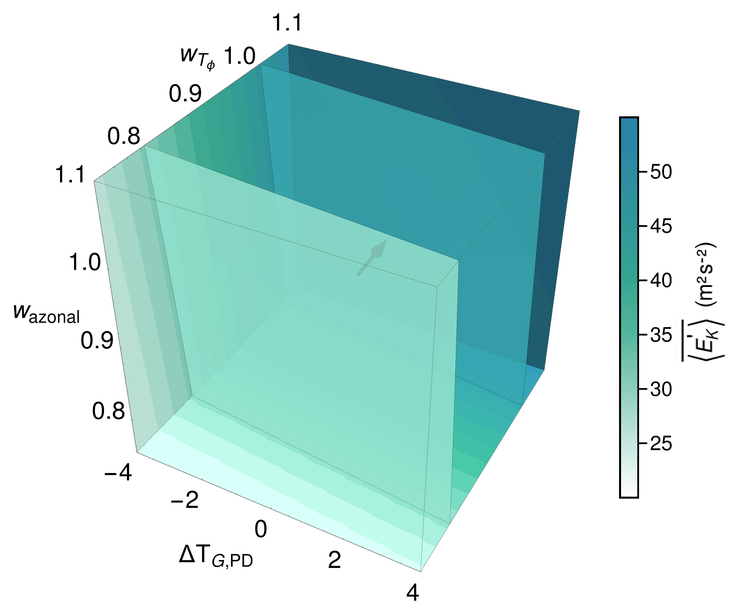
Figure 8Strength of the vertical integrated storm track activity in relation to and wazonal and ΔTG,PD. The arrow points in the direction of the strongest gradient in boreal winter.
The strength of the storm track activity depends on all three components, , wazonal and ΔTG,PD (Fig. 8), in a way that the influence of dominates the influence on storm track activity. The increased global-mean temperature leads to a general strengthening of the storm track activity (Fig. 8).
4.2.3 Wind velocity of the planetary waves
The wind velocity of the planetary waves is roughly as sensitive to as to wazonal, both in terms of 〈u*〉 (Fig. 9a) and in terms of 〈v*〉 (Fig. 9b). Both meridional and zonal wind directions exhibit the same relationship, such that larger meridional and zonal temperature asymmetries lead to stronger winds. In addition, if the scaling factor of the meridional temperature gradient is smaller than the scaling factor wazonal of the zonal temperature asymmetry, the strength of the planetary waves increases faster with higher relative changes in the meridional temperature gradient than if both have similar relative changes in magnitude. Moreover, if the relative change in the zonal temperature asymmetry is smaller than the relative changes in the meridional temperature gradient, the strength of the planetary waves increases faster with higher zonal temperature asymmetry than if both have a similar magnitude. This behavior leads to a curved structure of the azonal winds.
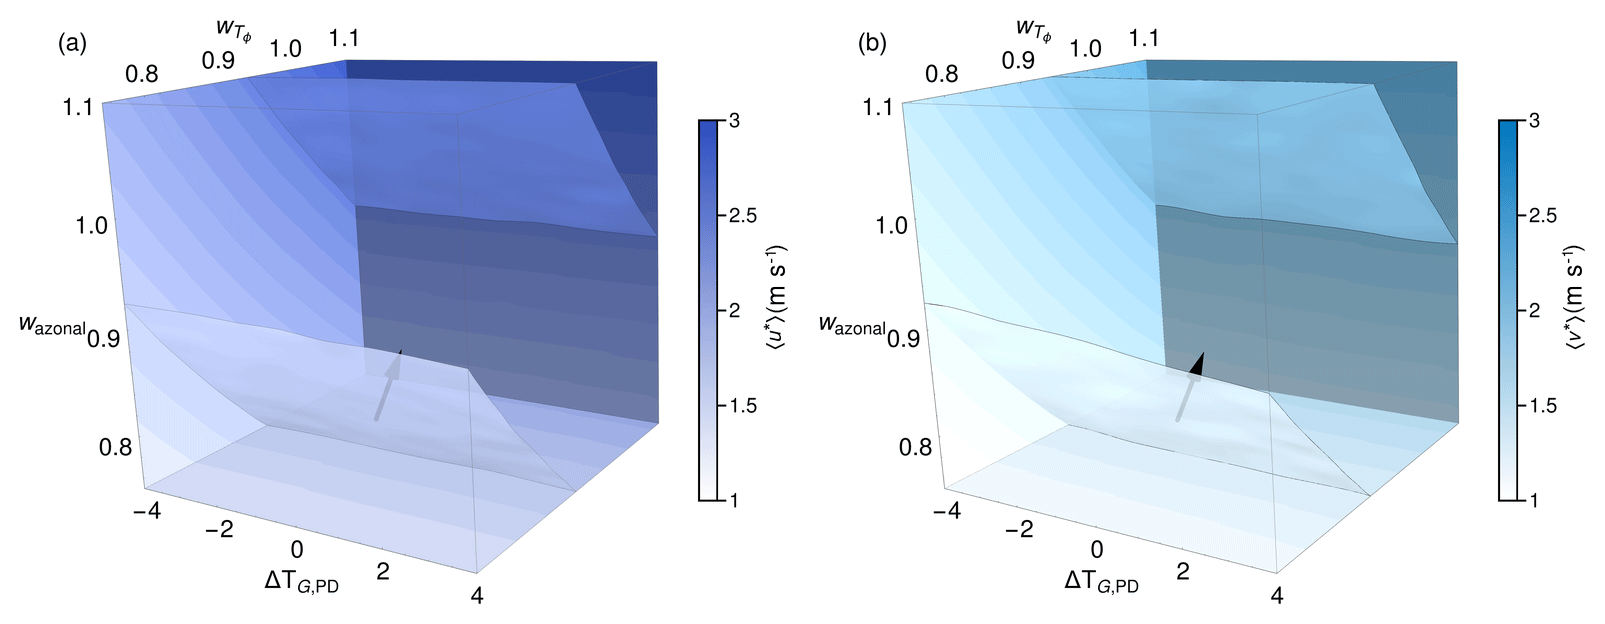
Figure 9Strength of planetary waves 〈u*〉 and 〈v*〉 in relation to and wazonal and ΔTG,PD. The arrow points in the direction of the strongest gradient.
The global-mean temperature has a positive but only weak influence on the strength of planetary waves.
For all investigated atmosphere variables, we observe a strengthening for higher global-mean temperature and higher absolute meridional temperature gradients and only a weak (strong) dependence on the zonal temperature asymmetry for storm tracks (planetary waves and Hadley cell width), which we discuss in comparison with results from literature in the following sections. However, most previous studies have analyzed only the combined effect of changes in several temperature components, making a direct comparison difficult.
5.1 Tropical circulation
5.1.1 Strength and width of the Hadley cell
The strength of the Hadley cell depends strongly on the meridional temperature gradient, with a stronger Hadley circulation for a larger meridional gradient (Fig. 4). Its strength is much less sensitive to global-mean temperature. A rising global-mean temperature leads to a weakening of the Hadley cell, explainable by the enhanced latent heat release under warmer conditions. The specific humidity increases faster with temperature than precipitation, therefore the strength weakens (Hill et al., 2015). Finally, it is almost insensitive to zonal temperature asymmetries.
In addition, our analysis suggests that the Hadley cell width depends nonlinearly on all three temperature components (Fig. 3). The dependence of the Hadley cell width on the meridional temperature gradient is consistent with findings from Frierson et al. (2007), using an idealized moist GCM and a full GCM.
However, our findings regarding the width of the Hadley cell are more complex than those from Frierson et al. (2007), who only observe an increase of the width with increasing global-mean temperature. Whether this is a model artifact or a true feature of tropical circulation should be assessed using high-resolution general circulation models.
Also Adam et al. (2014) examined the Hadley cell width using six reanalysis data sets, 22 Atmospheric Model Intercomparison Project (AMIP) simulations and 11 historical ocean–atmosphere coupled simulations from CMIP5. They observed the same behavior for the meridional temperature gradient, meaning that a weakening of the meridional temperature gradient leads to a widening of the Hadley cell width. The sensitivity of the Hadley cell width for global-mean temperature shows in their analysis, which is the opposite behavior of that in our analysis. To distinguish between the meridional temperature gradient and global-mean temperature, they decomposed SST into factors that are primarily associated with global warming (mean SST changes) and the El Niño–Southern Oscillation (ENSO; SST gradient changes). They concluded that a weakening of the temperature gradient and an increase of the global-mean temperature leads to a widening of the Hadley cell.
In agreement to our results, Mitas and Clement (2005) detected a strengthening of the Hadley cell in their analyses using several reanalysis data sets, a rawinsonde data set and a model data set. However, they found great differences between different data sets.
Lu et al. (2007) found a robust weakening and a poleward expansion of the Hadley circulation in response to increased greenhouse gas (GHG) forcing in simulations of the 21st century climate taken from the A2 scenario of the Intergovernmental Panel on Climate Change (IPCC) AR4 project. Lu et al. (2008) analyzed the change in the zonal-mean atmospheric circulation under global warming in comparison with the response to El Niño forcing by examining the CMIP5 model simulations. They again used the A2 scenario to simulate global warming. Under global warming due to higher CO2 concentrations, the Hadley cell weakens and expands northwards together with a poleward shift of the jet stream. Based on our results, we can assume that “El Niño-like” enhanced warming leads to a stronger zonal temperature asymmetry (and a higher global-mean temperature) resulting in a stronger Hadley cell, whereas the CO2 concentration leads to a weaker meridional temperature gradient (and a higher global-mean temperature), and as a consequence, the Hadley cell weakens. This can also explain the widening of the Hadley cell, which we observe in our experiments as well; a decreased meridional temperature gradient for a warmer global-mean temperature than the present day can lead to a smaller width of the Hadley cell and vice versa.
Seo et al. (2014) investigated possible drivers of the Hadley cell, such as the meridional temperature gradient, gross static stability and tropopause height using CMIP5 climate models. Consistent with our results, they found a robust dependence between meridional temperature gradient and the strength of the Hadley cell in winter; a decreased meridional temperature gradient leads to a weakening of the Hadley cell.
In addition, D'Agostino et al. (2017) analyzed and compared the Hadley cell during the last glacial maximum to global warming scenarios (RCP4.5 and RCP8.5), with a focus on the dependence on subtropical stability, a near-surface meridional potential temperature gradient and the tropical tropopause level. They concluded that the meridional temperature gradient is a major driver of Hadley cell changes.
However, in both studies the atmospheric composition in terms of anthropogenic aerosols is changed, hence not only the meridional temperature gradient changes, but the global-mean temperature and the zonal temperature asymmetry also change. This makes it difficult to attribute changes in the Hadley cell to one temperature component only.
Levine and Schneider (2015) investigated the sensitivity of the Hadley cell width to Equator-to-pole temperature contrasts and global-mean temperatures using two idealized GCMs. Their results confirm our findings that an increasing Equator-to-pole temperature leads to a widening of the Hadley cell (Levine and Schneider, 2015).
5.2 Extratropical circulation
5.2.1 Strength of the jet stream
We show that the strength of the jet stream decreases with decreasing absolute meridional temperature gradient (Figs. 5 and 6).
This is in agreement with findings from Polvani and Kushner (2002) and Haigh et al. (2005). Polvani and Kushner used a simple general circulation model and showed that for sufficiently strong cooling of the polar winter stratosphere, jet streams weaken and shift poleward. Haigh et al. (2005) analyze the weakening and shift of the subtropical jet using a multiple regression analysis of the NCEP NCAR reanalysis zonal-mean zonal wind velocity. Furthermore, with a simple general circulation model, they show that the generic heating of the lower stratosphere tends to weaken the subtropical jets.
In most observational studies, a weakening of the jet is observed over the last decades, like when Archer and Caldeira (2008) use NCEP and ERA-40 reanalysis sets or when Rikus (2015) uses ERA-40 data and ERA-Interim data.
However, Pena-Ortiz et al. (2013) found that trends in both the strength and position of the jet vary strongly between different reanalysis products.
5.2.2 Strength of the storm track activity
In this study, we observe a strengthening of storm track activity under an increased global-mean temperature (Fig. 8).
Our results are supported by findings from McCabe et al. (2001), who observe a strengthening of the storm track activity with higher global temperatures induced by GHG forcing. This is also in agreement with Yin (2005), who investigated 15 coupled climate models and showed that storm tracks intensify under global warming. In addition, Chang et al. (2012) found that storm tracks in the upper troposphere increase in winter using 23 CMIP5 models (below 300 mbar, they found a slight decrease), and the strength of storm track activity depends strongly on the meridional temperature gradient, which is consistent with our findings.
This latter result is intuitive, as the prime role of storm tracks within the general circulation is to transport heat poleward, with a stronger temperature contrast leading to enhanced heat transport. It also directly follows from the equation of eddy kinetic energy, which depends on the meridional temperature gradient in the first place (Coumou et al., 2011).
Harvey et al. (2013) observe similar results using CMIP5 data; larger temperature differences in the Equator-to-pole temperature at upper- and lower-tropospheric levels lead to stronger storm activity.
In reanalysis data a strengthening of the storm tracks can also be observed (Schneidereit et al., 2007; Wang et al., 2006), which is supposedly because of the rising global-mean temperature. The zonal temperature asymmetry could not be responsible for a strengthening, since the zonal temperature asymmetry should be reduced in winter due to global warming. According to our results, this would lead to a weakening of the storm track activity.
O'Gorman and Schneider (2008) examined the response of storm tracks to different climate conditions by simulating an aqua-planet and by changing the longwave optical thickness in the radiation scheme of the GCM (representing variations in greenhouse gas concentrations). They found that eddy kinetic energy has a maximum for a climate with the global-mean temperature similar to that of the present-day climate. Lower or higher global-mean temperatures lead to significantly smaller values. In addition, they observed that the eddy kinetic energy increases monotonically with the meridional insolation gradient (representing changes in, for example, high-latitude surface albedo).
Similarly, Pfahl et al. (2015) investigated the behavior of extratropical cyclones under strongly varying climate conditions using idealized climate model simulations in an aqua-planet setup. They changed the meridional insolation gradient together with the longwave optical thickness, with shortwave parameters held constant. They found that the maximum of eddy kinetic energy is reached at a global-mean temperature slightly warmer than the present-day climate.
These results are different to our results, where no such peak in eddy kinetic energy can be observed. The different results may be explained by the different techniques applied to simulate higher global-mean temperature. In our study, we directly change the temperature, whereas Pfahl et al. (2015) change the longwave optical thickness with shortwave parameters held constant, which represent variations in longwave absorbers like carbon dioxide and water vapor. These changes could also change the meridional and zonal temperature asymmetry, leading to different results.
Nevertheless, we also observe a strong positive dependence between temperature gradient and eddy kinetic energy.
5.2.3 Wind velocity of planetary waves
In our analysis the strengthening of the planetary wave wind velocities depends on all temperature components (Fig. 9). Larger meridional and zonal temperature asymmetries as well as global-mean temperatures lead to stronger winds.
Since azonal wind components emerge due to zonal temperature asymmetries, it is expected that higher zonal temperature differences lead to stronger azonal wind components. Stronger temperature gradients cause stronger meridional wind velocities, which are deflected by the Coriolis force, therefore the zonal wind velocities are also stronger. Those wind velocities are slowed down or accelerated due to topography and the land–ocean contrast, hence the azonal component of the wind velocity will also be stronger. In addition, a higher global-mean temperature leads to more available energy in the atmosphere and therefore to a larger azonal wind velocity.
Under climate change the global-mean temperature increases, whereas the meridional temperature is expected to decrease. Our results suggest that this will have contrary effects on the strength of planetary waves.
Thus, this could explain the results which Barnes and Polvani (2013) found by analyzing the planetary waves with wave number 1–6 as well as wave numbers 1–3. She concluded that there is no significant trend in terms of the strength of the planetary waves, thus Arctic amplification does not play a dominant role in changing the undulations of the jet stream.
The large-scale dynamical atmospheric changes due to variations of the temperature components, as presented here, coincide with those expected from dynamical principles, with the possible exception of the Hadley cell width changes. This therefore first of all serves as an important validation of our SDAM atmosphere model. To our knowledge, no other SDAM model exists that captures these dynamical interactions between the large-scale circulation components of tropical circulation, jets, storm tracks and planetary waves.
The fine sampling resolution of the parameter space reveals that most variables have a linear relationship to the investigated temperature components. In retrospect, a coarser resolution sampling of the parameter space using a GCM might have sufficed for detecting the relations between temperature components and dynamical variables.
However, this linearity could only be shown through our many runs using the fast SDAM.
In this paper, we present a study on multiple fundamental components of the large-scale atmosphere dynamics to different surface temperature forcing with the statistical–dynamical atmospheric model Aeolus 1.0. Due to the statistical–dynamical approach, Aeolus 1.0 is much faster than GCMs, which allows us to do 1000s of individual simulations and thus test the sensitivity of the dynamical fields to different surface temperature changes. This way one can disentangle and separately analyze the effect of the global-mean temperature, Equator-to-pole temperature gradient and east–west temperature differences. Therefore, we are one of the first to scan the full temperature phase space. This way we can scan for nonlinearities in the system (i.e., the Hadley cell edge might be very sensitive to meridional temperature gradients only for a narrow range of temperature gradient values, and outside of that range, it is not sensitive), as done, for example, in Levine and Schneider (2015). It is important to know such nonlinearities, as it could imply more abrupt changes under global warming.
The model's climatology generally reproduces the dynamical fields of ERA Interim, especially in the Northern Hemisphere, which is the focus of our analysis. If possible, we compare our findings with results of the literature and conclude that most modeled changes are in line with theory and simulations. Exceptions are the planetary waves, which are well explained by theoretic dynamical consideration and the width of the Hadley, which could be a model artifact or a real feature. Latter should be tested with GCMs.
These results also serve as an important validation of the dynamical core of the Aeolus. We could show that Aeolus is, to our knowledge, the first model that captures the dynamical interactions expected from dynamical principles between the large-scale circulation components of tropical circulation, jets, storm tracks and planetary waves. In future work we would like to use the gained knowledge to simulate only specific temperature component configurations to further explore the dependence of the different atmospheric large-scale circulations on near-surface temperature profiles.
All original data were downloaded from public archives. Code and data are stored in PIK's long-term archive and are made available to interested parties on request.
ST, EP and DC developed the study conception. ST, SP, EP and DC developed the analysis method. DC, SP and ST developed the model code and performed the simulations. ST, JL and DC analyzed and interpreted the data. ST wrote the paper, with contributions from all co-authors.
The authors declare that they have no conflict of interest.
We thank ECMWF for making the ERA Interim available. The work was supported
by the German Federal Ministry of Education and Research, grant no.
01LN1304A, (S.T., D.C.). The authors gratefully acknowledge the European
Regional Development Fund (ERDF), the German Federal Ministry of Education
and Research and the state of Brandenburg for supporting this project by
providing resources for the high-performance computer system at the Potsdam
Institute for Climate Impact Research.
The publication of this article was funded by the
Open Access Fund of the Leibniz Association.
Edited by: Stefano Pierini
Reviewed by: two anonymous referees
Adam, O., Schneider, T., and Harnik, N.: Role of changes in mean temperatures versus temperature gradients in the recent widening of the Hadley circulation, J. Climate, 27, 7450–7461, https://doi.org/10.1175/JCLI-D-14-00140.1, 2014.
Allen, R. J., Sherwood, S. C., Norris, J. R., and Zender, C. S.: Recent Northern Hemisphere tropical expansion primarily driven by black carbon and tropospheric ozone, Nature, 485, 350–354, https://doi.org/10.1038/nature11097, 2012.
Allen, R. J., Norris, J. R., and Kovilakam, M.: Influence of anthropogenic aerosols and the Pacific Decadal Oscillation on tropical belt width, Nat. Geosci., 7, 270–274, https://doi.org/10.1038/NGEO2091, 2014.
Archer, C. L. and Caldeira, K.: Historical trends in the jet streams, Geophys. Res. Lett., 35, 1–6, https://doi.org/10.1029/2008GL033614, 2008.
Barnes, E. A. and Polvani, L. M.: Response of the midlatitude jets, and of their variability, to increased greenhouse gases in the CMIP5 models, J. Clim., 26, 7117–7135, https://doi.org/10.1175/JCLI-D-12-00536.1, 2013.
Branstator, G. W.: Organization of Storm Track Anomalies by Recuring Low-Frequency Circulation Anomalies, J. Atmos. Sci., 52, 207–224, 1994.
Butler, A., Thompson, W. J., and Heikes, R.: The Steady-State Atmospheric Circulation Response to Climate Change – like Thermal Forcings in a Simple General Circulation Model, J. Climate, 23, 3474–3496, https://doi.org/10.1175/2010JCLI3228.1, 2010.
Butler, A. H., Thompson, D. W. J., and Birner, T.: Isentropic Slopes, Downgradient Eddy Fluxes, and the Extratropical Atmospheric Circulation Response to Tropical Tropospheric Heating, J. Atmos. Sci., 68, 2292–2305, https://doi.org/10.1175/JAS-D-10-05025.1, 2011.
Chang, E. K. M., Guo, Y., and Xia, X.: CMIP5 multimodel ensemble projection of storm track change under global warming, J. Geophys. Res.-Atmos., 117, 1–19, https://doi.org/10.1029/2012JD018578, 2012.
Chen, S., Wei, K., Chen, W., and Song, L.: Regional changes in the annual mean Hadley circulation in recent decades, J. Geophys. Res.-Atmos., 119, 7815–7832, https://doi.org/10.1002/2014JD021540, 2014.
Claussen, M., Mysak, L., Weaver, A., Crucifix, M., Fichefet, T., Loutre, M. F., Weber, S., Alcamo, J., Alexeev, V., Berger, A., Calov, R., Ganopolski, A., Goosse, H., Lohmann, G., Lunkeit, F., Mokhov, I., Petoukhov, V., Stone, P., and Wang, Z.: Earth system models of intermediate complexity: Closing the gap in the spectrum of climate system models, Clim. Dynam., 18, 579–586, https://doi.org/10.1007/s00382-001-0200-1, 2002.
Coumou, D., Petoukhov, V., and Eliseev, A. V.: Three-dimensional parameterizations of the synoptic scale kinetic energy and momentum flux in the Earth's atmosphere, Nonlin. Processes Geophys., 18, 807–827, https://doi.org/10.5194/npg-18-807-2011, 2011.
Coumou, D., Lehmann, J., and Beckmann, J.: The weakening summer circulation in the Northern Hemisphere mid-latitudes, Science, 348, 324–327, 2015.
D'Agostino, R. and Lionello, P.: Evidence of global warming impact on the evolution of the Hadley Circulation in ECMWF centennial reanalyses, Clim. Dynam., 48, 1–14, https://doi.org/10.1007/s00382-016-3250-0, 2016.
Dee, D. P., Uppala, S. M., Simmons, A. J., Berrisford, P., Poli, P., Kobayashi, S., Andrae, U., Balmaseda, M. A., Balsamo, G., Bauer, P., Bechtold, P., Beljaars, A. C. M., van de Berg, L., Bidlot, J., Bormann, N., Delsol, C., Dragani, R., Fuentes, M., Geer, A. J., Haimberger, L., Healy, S. B., Hersbach, H., Hólm, E. V., Isaksen, L., Kållberg, P., Köhler, M., Matricardi, M., Mcnally, A. P., Monge-Sanz, B. M., Morcrette, J. J., Park, B. K., Peubey, C., de Rosnay, P., Tavolato, C., Thépaut, J. N., and Vitart, F.: The ERA-Interim reanalysis: Configuration and performance of the data assimilation system, Q. J. Roy. Meteorol. Soc., 137, 553–597, https://doi.org/10.1002/qj.828, 2011.
Egger, J., Weickmann, K., and Hoinka, K. P.: Angular momentum in the global atmospheric circulation, Rev. Geophys., 45, 1–25, https://doi.org/10.1029/2006RG000213, 2007.
Eliseev, A. V., Coumou, D., Chernokulsky, A. V., Petoukhov, V., and Petri, S.: Scheme for calculation of multi-layer cloudiness and precipitation for climate models of intermediate complexity, Geosci. Model Dev., 6, 1745–1765, https://doi.org/10.5194/gmd-6-1745-2013, 2013.
Flechsig, M., Böhm, U., Nocke, T., and Rachimow, C.: The Multi-Run Simulation Environment SimEnv, available at: https://www.pik-potsdam.de/research/transdisciplinary-concepts-and-methods/tools/simenv/ (last access: 27 January 2019), 2013.
Frierson, D. M. W., Lu, J., and Chen, G.: Width of the Hadley cell in simple and comprehensive general circulation models, Geophys. Res. Lett., 34, 1–5, https://doi.org/10.1029/2007GL031115, 2007.
Haigh, J. D., Blackburn, M., and Day, R.: The Response of Tropospheric Circulation to Perturbations in Lower-Stratospheric Temperature, J. Climate, 18, 3672–3685, 2005.
Harvey, B. J., Shaffrey, L. C., and Woollings, T. J.: Equator-to-pole temperature differences and the extra-tropical storm track responses of the CMIP5 climate models, Clim. Dynam., 43, 1171–1182, 2013.
Hawcroft, M. K., Shaffrey, L. C., Hodges, K. I., and Dacre, H. F.: How much Northern Hemisphere precipitation is associated with extratropical cyclones?, Geophys. Res. Lett., 39, 1–7, https://doi.org/10.1029/2012GL053866, 2012.
Hill, S. A., Ming, Y., and Held, I. M.: Mechanisms of forced tropical meridional energy flux change, J. Climate, 28, 1725–1742, https://doi.org/10.1175/JCLI-D-14-00165.1, 2015.
Hoskins, B. J. and Valdes, P. J.: On the Existence of Storm-Tracks, J. Atmos. Sci., 47, 1854–1864, 1990.
Kang, S. M., Polvani, L. M., Fyfe, J. C., and Sigmond, M.: Impact of polar ozone depletion on subtropical precipitation, Science, 332, 951–954, https://doi.org/10.1126/science.1202131, 2011.
Lehmann, J. and Coumou, D.: The influence of mid-latitude storm tracks on hot, cold, dry and wet extremes, Sci. Rep., 5, 17491, https://doi.org/10.1038/srep17491, 2015.
Lehmann, J., Coumou, D., Frieler, K., Eliseev, A. V., and Levermann, A.: Future changes in extratropical storm tracks and baroclinicity under climate change, Environ. Res. Lett., 9, 084002, https://doi.org/10.1088/1748-9326/9/8/084002, 2014.
Levine, X. J. and Schneider, T.: Baroclinic Eddies and the Extent of the Hadley Circulation?: An Idealized GCM Study, J. Atmos. Sci., 72, 2744–2761, https://doi.org/10.1175/JAS-D-14-0152.1, 2015.
Lu, J., Vecchi, G. A., and Reichler, T.: Expansion of the Hadley cell under global warming, Geophys. Res. Lett., 34, 1–5, https://doi.org/10.1029/2007GL030931, 2007.
Lu, J., Chen, G., and Frierson, D. M. W.: Response of the Zonal Mean Atmospheric Circulation to El Niño versus Global Warming, J. Climate, 21, 5835–5851, https://doi.org/10.1175/2008JCLI2200.1, 2008.
McCabe, G. J., Clark, M. P., and Serreze, M. C.: Trends in Northern Hemisphere surface cyclone frequency and intensity, J. Climate, 14, 2763–2768, https://doi.org/10.1175/1520-0442(2001)014<2763:TINHSC>2.0.CO;2, 2001.
Mitas, C. M. and Clement, A.: Has the Hadley cell been strengthening in recent decades?, Geophys. Res. Lett., 32, L03809, https://doi.org/10.1029/2004GL021765, 2005.
Molnos, S., Mamdouh, T., Petri, S., Nocke, T., Weinkauf, T., and Coumou, D.: A network-based detection scheme for the jet stream core, Earth Syst. Dynam., 8, 75–89, https://doi.org/10.5194/esd-8-75-2017, 2017.
Nguyen, H., Evans, A., Lucas, C., Smith, I., and Timbal, B.: The hadley circulation in reanalyses: Climatology, variability, and Change, J. Climate, 26, 3357–3376, https://doi.org/10.1175/JCLI-D-12-00224.1, 2013.
O'Gorman, P. A.: Understanding the varied response of the extratropical storm tracks to climate change, P. Natl. Acad. Sci. USA, 107, 19176–19180, https://doi.org/10.1073/pnas.1011547107, 2010.
O'Gorman, P. A. and Schneider, T.: Energy of Midlatitude Transient Eddies in Idealized Simulations of Changed Climates, J. Climate, 21, 5797–5806, https://doi.org/10.1175/2008JCLI2099.1, 2008.
Peixoto, J. and Oort, A. H.: Physics of Climate, 1st edn., American Institute of Physics, New York, 1992.
Pena-Ortiz, C., Gallego, D., Ribera, P., Ordonez, P., and Del Carmen Alvarez-Castro, M.: Observed trends in the global jet stream characteristics during the second half of the 20th century, J. Geophys. Res.-Atmos., 118, 2702–2713, https://doi.org/10.1002/jgrd.50305, 2013.
Petoukhov, V., Ganopolski, A., Brovkin, V., Claussen, M., Eliseev, A. V., Kubatzki, C., and Rahmstorf, S.: CLIMBER 2: a climate system model of intermediate complexity. Part I: model description and performance for present climate, Clim. Dynam., 16, 1–17, https://doi.org/10.1007/PL00007919, 2000.
Pfahl, S., O'Gorman, P. A., and Singh, M. S.: Extratropical Cyclones in Idealized Simulations of Changed Climates, J. Climate, 28, 9373–9392, https://doi.org/10.1175/JCLI-D-14-00816.1, 2015.
Polvani, L. M. and Kushner, P. J.: Tropospheric Response to Stratospheric Perturbations in a Relatively Simple General Circulation Model, Geophys. Res. Lett., 29, 40–43, https://doi.org/10.1175/1520-0469(2003)060<1835:TRTSDI>2.0.CO;2, 2002.
Raible, C. C., Yoshimori, M., Stocker, T. F., and Casty, C.: Extreme midlatitude cyclones and their implications for precipitation and wind speed extremes in simulations of the Maunder Minimum versus present day conditions, Clim. Dynam., 28, 409–423, https://doi.org/10.1007/s00382-006-0188-7, 2007.
Rikus, L.: A simple climatology of westerly jet streams in global reanalysis datasets part 1: mid–latitude upper tropospheric jets, Clim. Dynam., 50, 2285–2310, https://doi.org/10.1007/s00382-015-2560-y, 2015.
Salby, M. L.: Physics of the atmosphere and climate, Cambridge University Press, Cambridge, 2012.
Saltzman, B.: A Survey of Statistical-Dynamical Models of the Terrestrial Climate, Adv. Geophys., 20, 183–304, https://doi.org/10.1016/S0065-2687(08)60324-6, 1978.
Schneider, T. and Bordoni, S.: Eddy-Mediated Regime Transitions in the Seasonal Cycle of a Hadley Circulation and Implications for Monsoon Dynamics, J. Atmos. Sci., 65, 915–934, https://doi.org/10.1175/2007JAS2415.1, 2008.
Schneidereit, A., Blender, R., Fraedrich, K., and Lunkeit, F.: Icelandic climate and North Atlantic cyclones in ERA-40 reanalyses, Meteorol. Z., 16, 17–23, https://doi.org/10.1127/0941-2948/2007/0187, 2007.
Seo, K., Frierson, D. M. W., and Son, J.: A mechanism for future changes in Hadley circulation strength in CMIP5 climate change simulations, Geophys. Res. Lett., 40, 5251–5258, https://doi.org/10.1002/2014GL060868, 2014.
Son, S. W., Tandon, N. F., Polvani, L. M., and Waugh, D. W.: Ozone hole and Southern Hemisphere climate change, Geophys. Res. Lett., 36, 3–7, https://doi.org/10.1029/2009GL038671, 2009.
Totz, S., Eliseev, A. V., Petri, S., Flechsig, M., Caesar, L., Petoukhov, V., and Coumou, D.: The dynamical core of the Aeolus 1.0 statistical–dynamical atmosphere model: validation and parameter optimization, Geosci. Model Dev., 11, 665–679, https://doi.org/10.5194/gmd-11-665-2018, 2018.
Wang, X. L., Swail, V. R., and Zwiers, F. W.: Climatology and Changes of Extratropical Cyclone Activity?: Comparison of ERA-40 with NCEP – NCAR Reanalysis for 1958–2001, J. Climate, 19, 3145–3167, https://doi.org/10.1175/JCLI3781.1, 2006.
Woollings, T.: Dynamical influences on European climate: an uncertain future., Philos. Trans. A. Math. Phys. Eng. Sci., 368, 3733–3756, https://doi.org/10.1098/rsta.2010.0040, 2010.
Yin, J. H.: A consistent poleward shift of the storm tracks in simulations of 21st century climate, Geophys. Res. Lett., 32, 1–4, https://doi.org/10.1029/2005GL023684, 2005.