the Creative Commons Attribution 4.0 License.
the Creative Commons Attribution 4.0 License.
 | 22 Apr 2025
Statistical and neural network assessment of the climatology of fog and mist at Pula Airport in Croatia
Marko Zoldoš
Jadran Jurković
Frano Matić
Sandra Jambrošić
Ivan Ljuština
Maja Telišman Prtenjak
A study was conducted on the climatological characteristics of fog and mist at Pula Airport in the northeastern Adriatic, using statistical and machine learning approaches. The study utilized meteorological data from Pula Airport, along with satellite sea surface temperature (SST) data from two coastal areas west and east of the airport, to gain insights into the influence of sea temperature on fog formation. To identify weather patterns associated with the occurrence of fog and mist, wind and mean sea level pressure (MSLP) data from the fifth-generation reanalysis (ERA5) of the European Centre for Medium-Range Weather Forecasts (ECMWF) were analyzed using Growing Neural Gas (GNG), a machine learning algorithm. A notable finding was a declining trend in the frequency of fog and mist at the airport, which can be linked to the results of the GNG analysis of the ERA5 data. This analysis showed a decrease in synoptic patterns favorable for fog and mist. Fog occurs mainly between October and March and is primarily associated with weak westerly and northwesterly winds. Additionally, fog is more likely to occur when the sea surface temperature is higher than the air temperature. Mist has similar characteristics to fog, although it is more likely to occur with easterly winds.
- Article
(15941 KB) - Full-text XML
- BibTeX
- EndNote


According to the World Meteorological Organization (WMO), fog is the suspension of very small water droplets or ice crystals in the atmosphere, reducing visibility on Earth's surface to less than 1 km (WMO, 1992). The formation of these water droplets and ice crystals is influenced by factors such as cooling, increased humidity, and the mixing of air masses with different temperatures (Gultepe et al., 2007). Mist, a related phenomenon, occurs when horizontal visibility at the surface is between 1 and 10 km, with aviation meteorology specifically defining mist as conditions where visibility is between 1 and 5 km. Fog is a unique atmospheric phenomenon confined to the atmospheric boundary layer (ABL), the lowest part of the atmosphere, and its characteristics are influenced by Earth's surface. The formation and dissipation of fog are impacted by synoptic and mesoscale conditions as well as surface features such as moisture sources (e.g., oceans, lakes, and rivers), vegetation, orography, urban areas, and sea currents.
This study examines fog occurrence over an extended period at Pula Airport, located in the coastal region of Croatia in the northeastern Adriatic (Fig. 1). The Adriatic Sea is a large semi-enclosed sea separating the Apennine Peninsula from the Balkans. It is the northernmost arm of the Mediterranean Sea, extending from the Strait of Otranto (where it connects to the Ionian Sea and the rest of the Mediterranean) to the northwest, toward the Po Valley and the Istrian Peninsula. This region frequently experiences marine fog due to synoptic-scale effects that can trigger subsidence within the boundary layer, which causes stratus clouds to descend to the surface. Similar marine fog events have been studied in the northwestern Pacific and Atlantic oceans (e.g., Koračin et al., 2001; Koračin and Dorman, 2017). In the Adriatic Sea, fog typically occurs between September and May, often disrupting sea transport and port operations (Popović et al., 2014). Fog also significantly affects air traffic at airports, where it can cause significant flight delays due to poor visibility and low cloud ceilings. These delays result in substantial financial losses for airlines, underscoring the need for accurate fog forecasting. For example, dense fog at New Delhi Airport in India caused losses of approximately USD 3.9 million between 2011 and 2016 (Kulkarni et al., 2019). Improved fog forecasting could mitigate such losses, as illustrated by Allan et al. (2001), who estimated that better forecasts for low-visibility events at three New York City airports could save up to USD 240 000 per event.
These factors highlight the critical role of fog research in advancing forecasting capabilities. Despite its importance, the study of fog remains an area of atmospheric science where our understanding is limited over both land (Gultepe et al., 2007) and the ocean (Koračin and Dorman, 2017). Fog formation involves a complex interaction of processes ranging from synoptic-scale to microscale levels. The typical size of fog condensation nuclei is around 0.1 µm (10−5 cm), while the synoptic-scale processes that contribute to fog development occur on a scale of 108 cm or more, making the ratio of interacting length scales about 1013. Fully understanding fog formation involves various elements, including large-scale synoptics (Belo-Pereira and Santos, 2016), characteristics of surface and radiation exchange (Duynkerke, 1991), microphysics (Gultepe and Milbrandt, 2007; Wang et al., 2019), climatology (Stolaki et al., 2009; Veljović et al., 2015), relationships with turbulence intensity (Ju et al., 2020), or the presence of aerosol (Oztaner and Yilmaz, 2013). The complicated interplay of meteorological parameters that determine whether fog forms or not poses a substantial challenge for accurate fog forecasting (Bergot and Koračin, 2021). In addition to local factors influencing fog and mist formation, the impact of global warming and climate change cannot be overlooked. These global phenomena have been linked to a reduction in the number of days with fog and mist (Kawai et al., 2016; Klemm and Lin, 2016). Considering that fog occurrence in the eastern Adriatic has been studied infrequently, with the most recent research conducted over 50 years ago (Stipaničić, 1972), there is a need for updated insights.
This study analyzes the climatological characteristics of fog at Pula Airport, Croatia, with a focus on understanding the general patterns of fog initiation and dissipation. The primary objective is to provide detailed statistical analyses to help understand the local and dynamic processes leading to fog development. A secondary objective is to assess the influence of sea surface temperature (SST) in the vicinity of the study area on the frequency and intensity of advective fog. SST has been shown to significantly impact the accuracy of numerical weather prediction (NWP) models (Huang et al., 2022). To achieve these goals, the Growing Neural Gas (GNG) network, an unsupervised machine learning algorithm within artificial neural networks (Martinetz and Schulten, 1991), was applied. This method classifies synoptic conditions that prevail before and during the occurrence of fog at Pula into distinct weather patterns and identifies those that favor fog development. The results of this research could aid local forecasters in improving fog prediction by accounting for specific terrain and coastline features as well as synoptic and local influences (particularly SST), thereby closing a gap in scientific knowledge about fog characteristics in this part of the Mediterranean.
2.1 Location
Pula Airport, located approximately 6 km ENE of the coastal city of Pula in western Croatia (Fig. 1b), serves as the region's international airport. Its geographical coordinates are 44°53′37′′ N and 13°55′20′′ E, with an elevation of 84 m above mean sea level (AMSL). In 2024, the airport served 498 251 passengers, ranking as the fifth busiest airport in Croatia by passenger traffic (source: https://podaci.dzs.hr/2024/en/77287, last access: 20 February 2025). The airport is situated at the southern tip of the Istrian Peninsula – the largest peninsula in the Adriatic Sea – positioned between the Gulf of Trieste to the northwest and the Kvarner Gulf to the east. The climate of Istria is influenced by the Alps and Dinaric Alps as well as the Mediterranean Sea. Winters in Istria are typically mild and wet, while summers are hot and humid. The interior of Istria experiences a more continental climate, while the coastal area is significantly influenced by the Adriatic Sea. Recent research has analyzed bioclimatic parameters, highlighting these climatic boundaries across the peninsula (e.g., Omazić et al., 2020).
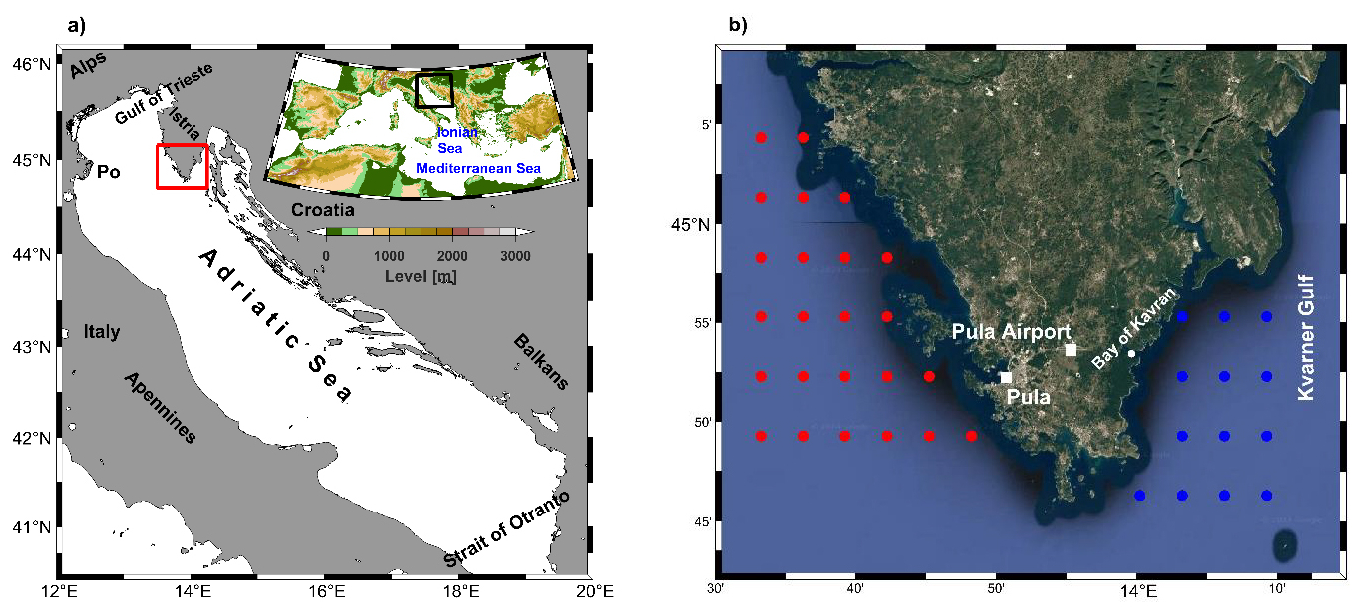
Figure 1(a) Map of the bathymetry of the Adriatic Sea, with the black square marking the Adriatic Sea area. The red rectangle on the map marks the immediate surroundings of Pula Airport (b) (© Google Maps 2024). The important localities are marked with white squares, while blue and red dots mark the eastern and western grid points from which the satellite SST values were extracted. The wider area of the Mediterranean Sea corresponds to the area of ERA5.
Two weather patterns are primarily associated with fog in Pula. The first involves a westerly to northwesterly flow that advects moist air under anticyclonic conditions. In these cases, advection can occur over a broad geographical area. Fog is often advected from the Po Valley in northern Italy, where it is a frequent phenomenon during the fall–winter season (Mariani, 2009), across the northern Adriatic to the Istrian coast. Under such conditions, fog can persist for days across the affected region (Bendix, 1994). For example, Linate Airport in Milan, Italy, historically experienced the highest number of annual closures due to fog among European airports (Mariani, 2009). While advective fog is less common in the northwestern Adriatic, it still frequently occurs on the western coast of Istria (Tešić and Brozinčević, 1974), which is climatologically the foggiest area of the eastern Adriatic (Stipaničić, 1972). The second weather pattern associated with fog in Pula involves an easterly to southeasterly flow during a weakening anticyclone, often advecting moist air from the southeast. These patterns are linked to the broader atmospheric circulation over the Adriatic Sea, which is shaped by four dominant wind regimes. The northeasterly bora and southeasterly sirocco winds, both common in the colder months, are influenced by regional synoptic systems. In contrast, in the warmer months, sea or land breezes and, to a lesser extent, the Etesian winds, become more prominent. The wind regime strongly influences changes in wind direction at Pula Airport (e.g., Pandžić and Likso, 2005; Telšman Prtenjak and Grisogono, 2007; Telišman Prtenjak et al., 2010; Belušić et al., 2018).
The terrain surrounding the airport is predominantly flat and covered with grassland and small forested areas. There are no significant hills or mountains nearby that would notably influence the local weather or climate. The central part of the airport, along with its southern surroundings, lies within a very shallow basin, which is prone to nighttime inversions under calm wind conditions and clear skies (as reported by local forecasters). The proximity of the sea exerts a substantial influence on the airport's weather. Pula Bay is located 6 km WSW, while the open waters of the northern Adriatic Sea are just 10 km away. To the east, the open sea is 7 km away, with the small Bay of Kavran situated just 5 km from Pula Airport. These geographical factors contribute to the significant marine influence on the weather at Pula Airport, even though the airport itself is not directly on the coast.
2.2 Data and methods
The dataset used for this study includes half-hourly METAR (METeorological Aerodrome Report) and 3-hourly SYNOP (Surface Synoptic Observations) reports from the meteorological station at Pula Airport. METAR is a coded report describing weather conditions at the airport in a manner standardized for aviation. SYNOP is a coded report describing weather conditions at a meteorological station. An airport meteorological station sends both SYNOP and METAR reports. The meteorological variables considered are wind speed and direction, temperature at 2 m above the ground, dew point temperature, relative humidity, surface pressure, cloud cover, and horizontal visibility. These variables are reported by both station observers and automatic instruments. The dataset spans a 20-year period from 1 January 2001 to 31 December 2020, with all measurements recorded at the airport's meteorological station. Runway 27, the primary operational runway, is equipped for Category I operations. This allows for takeoff and landing under low-visibility conditions with a runway visual range (RVR) of up to 550 m or a ceiling height of 200 ft (approximately 60 m). This ability underscores the operational challenges posed by fog: visibility below 550 m prohibits aircraft landings and takeoffs.
In addition to the airport data, daily SST measurements from the Pula Bay oceanographic station were included. These SST values, recorded at 07:00, 14:00, and 21:00 LT from 1 January 2001 to 31 December 2020, were supplemented with reprocessed satellite SST data from the Copernicus Marine Data Store (https://data.marine.copernicus.eu/, last access: 21 December 2023). This gap-free dataset, which has been optimally interpolated with a grid resolution of 0.05° (Merchant et al., 2019), provides a comprehensive view of sea surface temperatures. Two coastal areas were selected for analysis: one to the west of the airport, encompassing the open Adriatic Sea, and the other to the east, covering the Kvarner Gulf (Fig. 1). These regions were chosen to calculate the average spatial SST for a given day and to evaluate their influence on fog formation. The selected areas are representative of the nearshore waters where the prevailing winds most frequently originate.
To identify the synoptic wind and pressure fields associated with fog occurrence at Pula Airport and across the Mediterranean region, 10 m wind and mean sea level pressure (MSLP) data were sourced from the fifth-generation reanalysis (ERA5) of the European Centre for Medium-Range Weather Forecasts (ECMWF). This reanalysis provides a comprehensive record of the global climate and weather from the last 4 to 7 decades. ERA5 integrates observational data with atmospheric models to deliver detailed and accurate assessments of past weather. It has a horizontal resolution of 0.25° for latitude and longitude, a temporal resolution of 1 h, and a vertical resolution based on 37 pressure levels (Hersbach et al., 2020a, b). The study area spans 6° W–42° E and 30–48° N (Fig. 1a, inset map), encompassing the region where key synoptic processes influencing the Adriatic Sea predominantly occur. The analysis covers a 40-year period from 1979 to 2019, providing a comprehensive temporal dataset for assessing atmospheric conditions. At the same time, this area optimizes the calculation time.
To manage the large datasets of 10 m wind and MSLP and classify them into spatiotemporal patterns that shed light on atmospheric conditions favoring fog formation at Pula Airport, the Growing Neural Gas (GNG) network was employed. GNG is an unsupervised artificial neural network that clusters high-dimensional input data by reducing their dimensions and grouping them into best-matching units (BMUs) (Fritzke, 1995). Unlike traditional neural networks with fixed structures, GNG expands dynamically by adding new neurons in response to input patterns. This ability to grow and adapt allows GNG to effectively cluster data and detect patterns and anomalies. The GNG algorithm has been used successfully to detect anomalies in Adriatic Sea data, combining various biological and oceanographic inputs (Šantić et al., 2021; Džoić et al., 2022).
In this study, the methodology described in Matić et al. (2022) was applied to a high-dimensional, hourly, and 40-year dataset comprising wind components u and v, analyzed separately for each month of the year. Prior to implementing the GNG algorithm, the wind data were arranged in such a way that two columns represented the spatial variations of u and v, while rows corresponded to temporal instances. Wind data over land were excluded and assigned as NaN (not a number) values to reduce the calculation time. This exclusion did not affect the results, as the study's primary focus was on the synoptic-scale influences that generate specific wind patterns conducive to the formation of fog and mist. Over the sea, the winds are very homogeneous and are often directly related to large-scale synoptic systems such as cyclones or anticyclones. Over land, the influence of topography and vegetation introduces noise, making it more difficult to distinguish synoptic influences from local influences. The proximity of the airfield to the sea and the flat, low-lying terrain in the direction of the prevailing winds (Fig. 1b) justified this simplification of the calculations. The GNG algorithm, implemented using the NeuPy Python library and parameterized following Matić et al. (2022), was used to calculate nine BMUs per month for each month of the year. These BMUs were then linked to the corresponding MSLP fields. The temporal sequence of BMUs was utilized to compute an average pressure field for each BMU, offering a detailed representation of atmospheric patterns associated with fog formation.
Data processing and visualization were conducted using Python and MATLAB, with MATLAB employing the M_map mapping package (Pawlowicz, 2020) available at http://www.eoas.ubc.ca/~rich/map.html (last access: September 2023).
3.1 Climatological analysis
To comprehensively analyze fog occurrence over Pula Airport, a climatological analysis was conducted at both large and small scales. Figure 2a illustrates the annual number of days with fog and mist from 2001 to 2020. A “fog day” is defined as any day with at least one METAR indicating visibility below 1 km and the presence of fog at the airport. Similarly, a “mist day” is defined as any day with a METAR indicating visibility between 1 and 5 km accompanied by mist observation, consistent with aeronautical meteorology definitions. This approach excludes cases where reduced visibility was caused by precipitation, such as rain or drizzle. On average, Pula Airport experiences 13.4 fog days and 45.6 mist days per year; however, this number is steadily decreasing, as indicated by the pronounced negative trend. The Mann–Kendall statistical significance test shows that this result is statistically significant at the 95 % confidence level. A detailed evaluation of the linear trend indicates that the average number of fog days decreased by more than 10 d, from 18.4 in 2001 to 8.3 in 2020, with a slope coefficient of −0.53. Similarly, the average number of mist days declined by over 22 d, from 56.8 in 2001 to 34.4 in 2020, with a slope coefficient of −1.18. The larger absolute value of the slope coefficient for mist suggests that the average number of mist days is declining at a faster rate.
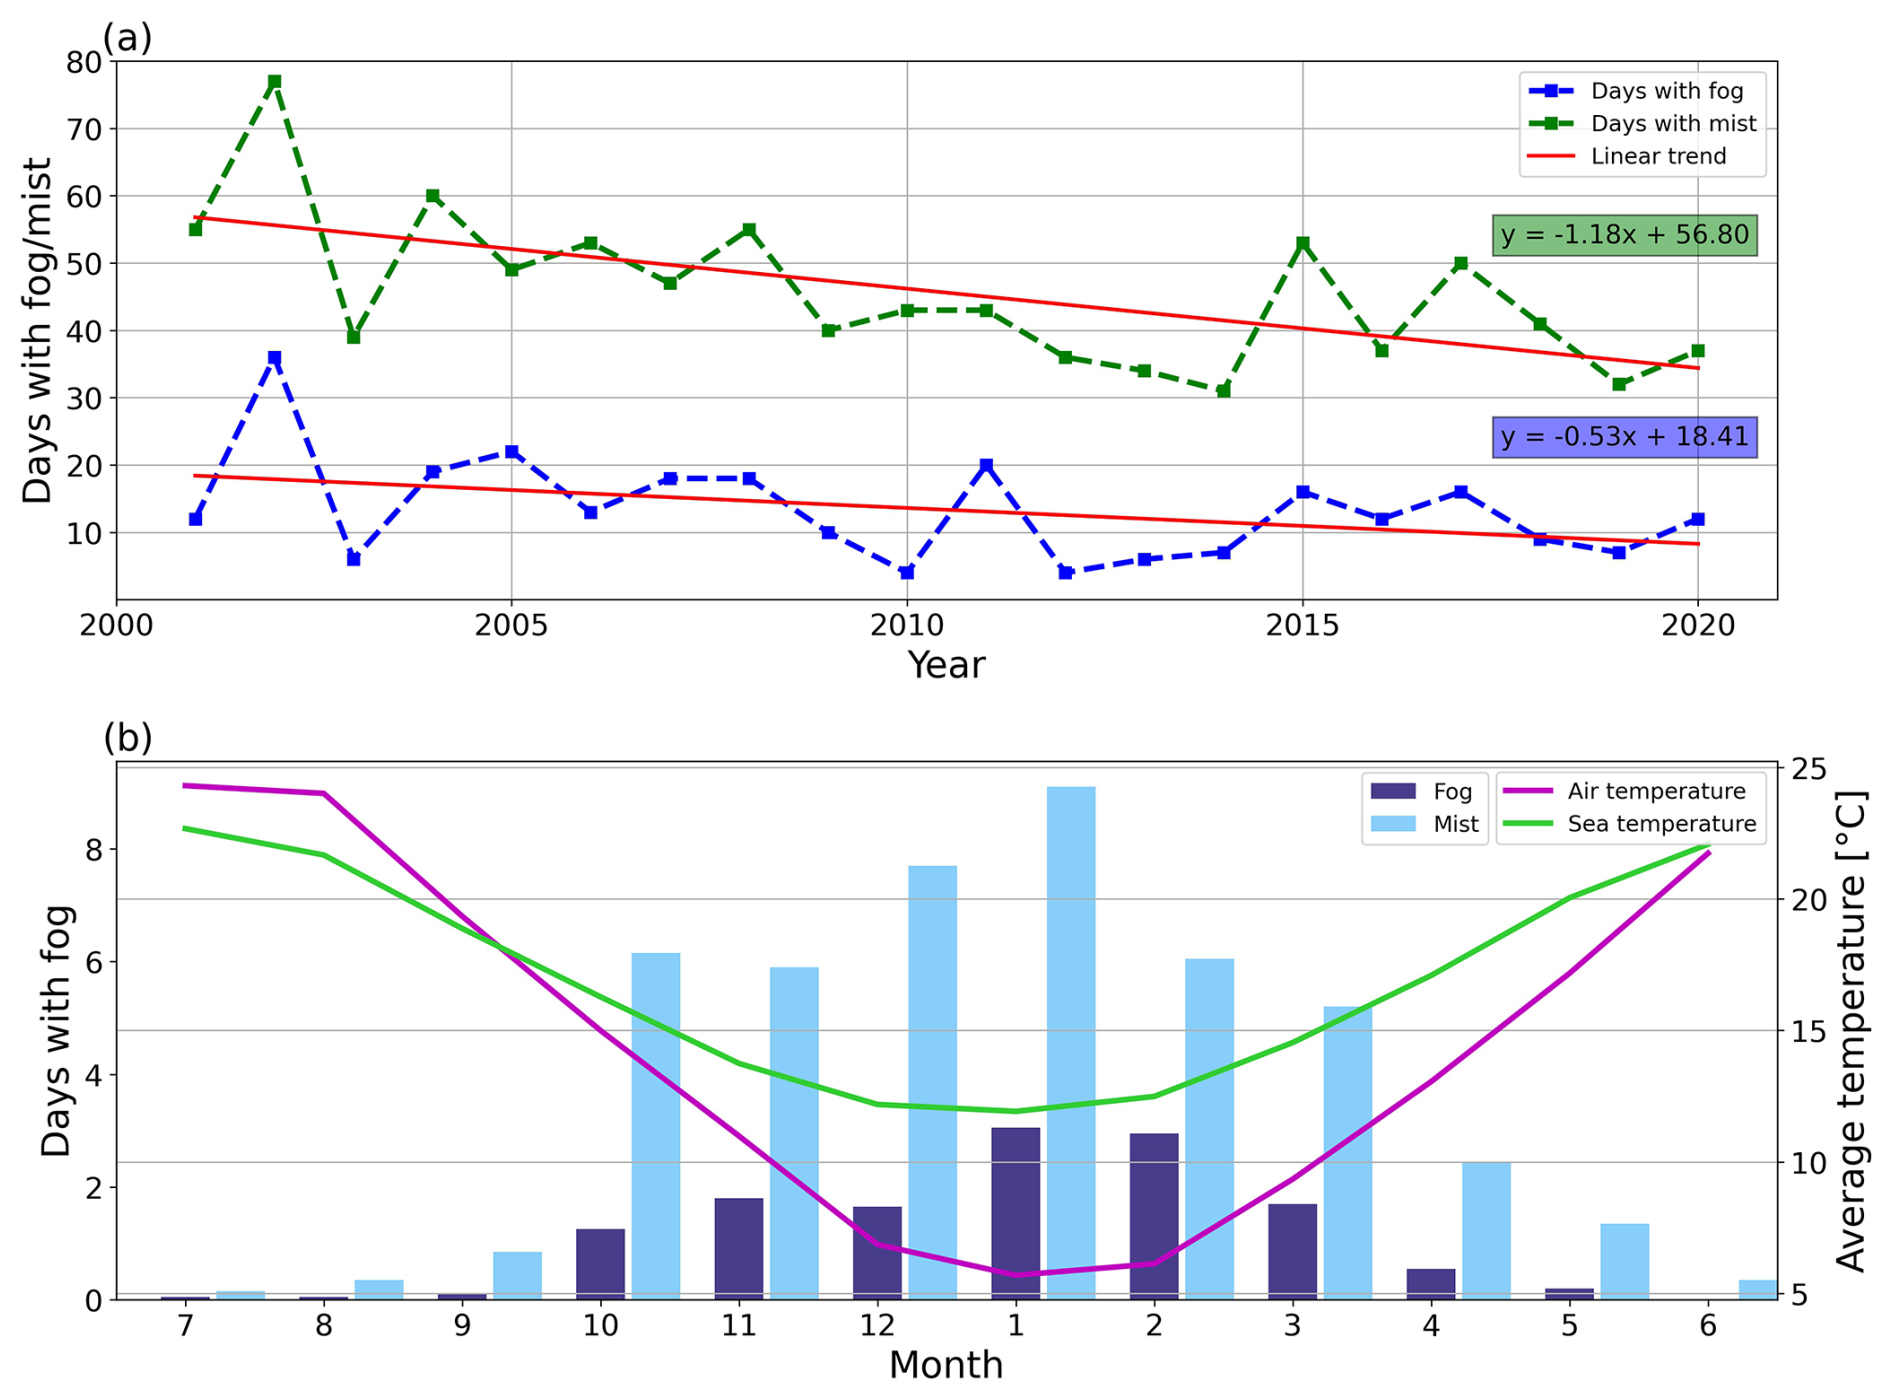
Figure 2(a) Annual number of days with fog (blue line) and mist (green line) at Pula Airport for 2001–2020, with the associated linear trends and trend equations. (b) Average monthly number of days with fog and mist at Pula Airport; the average sea temperature was measured at the oceanographic station in Pula Bay, and the average air temperature was measured at Pula Airport for 2001–2020. The graph is centered on the boreal winter.
The observed statistically significant decreasing trend in the frequency of fog and mist at the airport is consistent with similar findings in Europe, such as at Zagreb Airport (Zoldoš and Jurković, 2016) and Milan Airport (Mariani, 2009). While the decrease in Zagreb and Milan is largely attributed to reduced air pollution, this conclusion is more challenging to apply to Pula. As a smaller city with less industrial development, Pula's impact on neighboring suburban and rural areas is not as pronounced. While a decrease in fog and mist frequency has been observed across Europe, the effect is more prominent in continental Europe than in the Mediterranean region (Vautard et al., 2009).
Global warming and climate change are key drivers behind the long-term decline in fog frequency. Contributing factors include rising temperatures in Pula and the surrounding Istria region (Bonacci, 2010; Šimunić et al., 2021), increased SST throughout the Mediterranean (Pastor et al., 2018), and global trends in ocean stratification (Li et al., 2020). Climate model reanalysis for the Adriatic Sea from 1987 to 2017 shows clearly positive SST trends, especially in summer (Tojčić et al., 2023). Positive wind trends have been observed over the sea and along the Adriatic coast, between 0.1 and 0.2 m s−1 per decade (Tojčić et al., 2023), which could influence fog formation. Furthermore, future projections suggest that these changes will intensify, including lower wind speeds in coastal areas and more extreme contrasts such as increased droughts and heavy precipitation events (Tojčić et al., 2024). Warmer SSTs influence fog formation in two ways. Generally, they increase evaporation rates, enhancing fog advection when winds are favorable. Additionally, in cases where fog forms with SST<SAT (surface air temperature), they reduce the temperature gradient required for fog development. In Pula, these favorable winds, which blow over the sea, play a significant role in fog and mist formation.
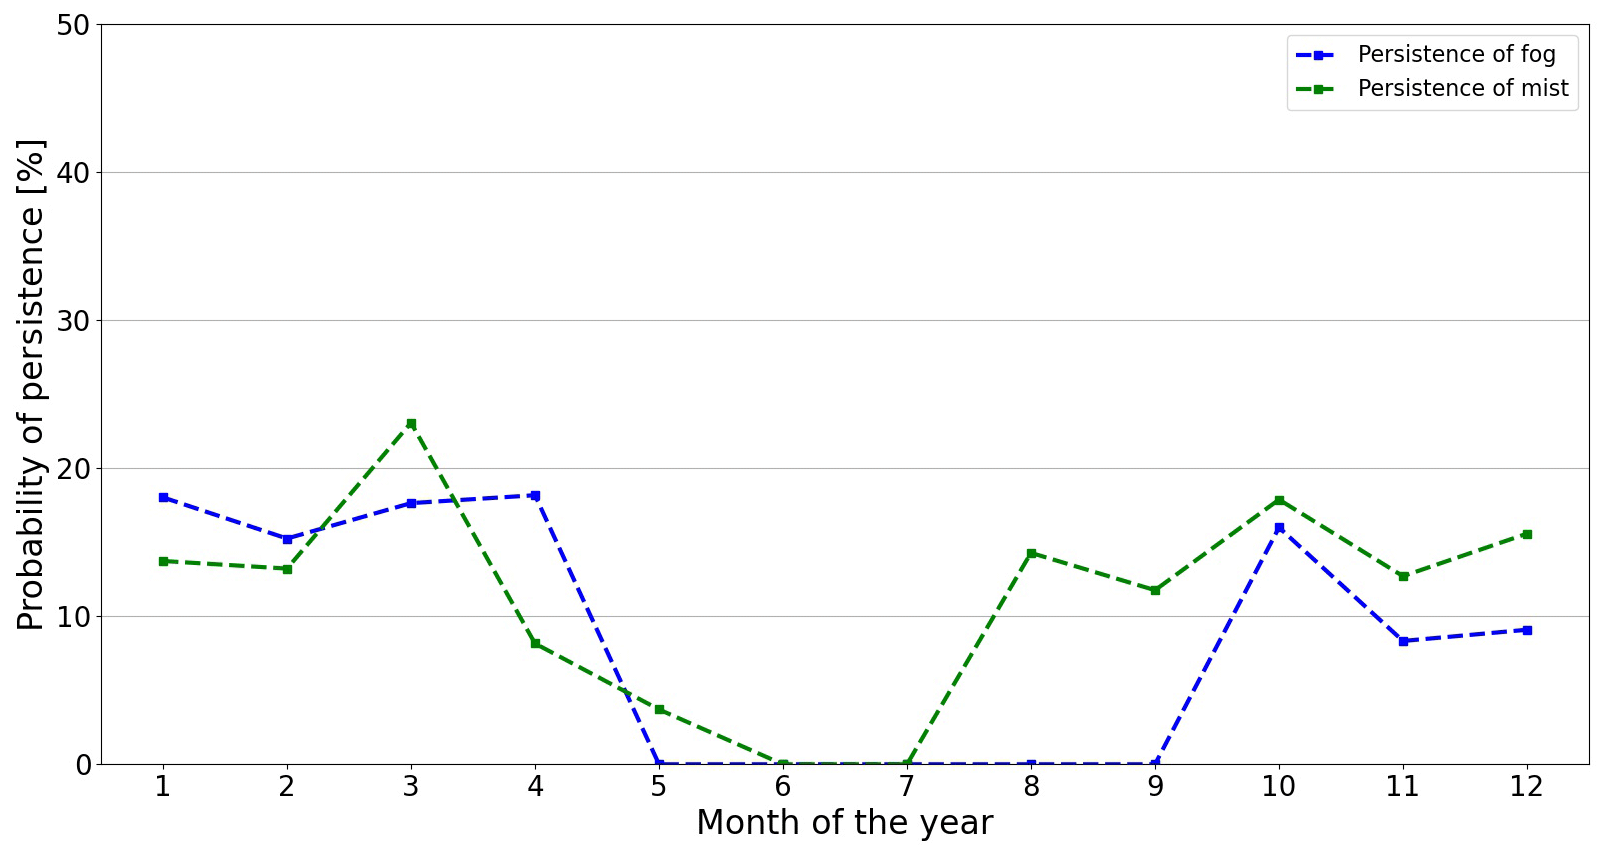
Figure 3Yearly distribution of the climatological probability of persistence (fog occurrence on 2 consecutive days) of fog and mist at Pula Airport for 2001–2020. The probability of persistence is defined as the number of days with persistence relative to the total number of days with fog in a given month. Cases where a single fog event was present around midnight (and thus spanned 2 d) were not counted as persistence.
A seasonal analysis (Fig. 2b) reveals that over 90 % of fog and mist events occur between October and March. January accounts for the highest frequency of fog (23 % of days) and mist (20 % of days), followed by February (21 % and 13 %, respectively), with December notable for mist (17 %). In March, October, and November, fog and mist occur on 12 %–13 % of the days. Fog is rare from April to May and almost absent from June to September; for example, no fog was observed in June during the analyzed period. The annual distribution of fog at Pula Airport is also comparable to the annual distribution of fog events at Zagreb Airport (Zoldoš and Jurković, 2016). A summary of the data shows that, during the climatological summer (June–August), fog occurrence can be expected approximately every 6 years. Mist follows a similar seasonal pattern but is more frequent overall. In recent decades, January and February have swapped positions as the months with the highest frequency of fog. While February used to be the foggiest month at Pula Airport with an average of 3.5 foggy days (Stipaničić, 1972), climatological results have shown us that January has become the foggiest month with 3.05 foggy days. The frequency of fog persistence, which is defined as fog occurrence on 2 consecutive days, is shown in Fig. 3. As expected based on previous findings on fog characteristics, persistence can only be expected in the colder part of the year (October–April). From May to September, there have been no recorded instances of fog occurring on 2 consecutive days. Stable anticyclonic conditions during the cold season are most conducive to fog persistence.
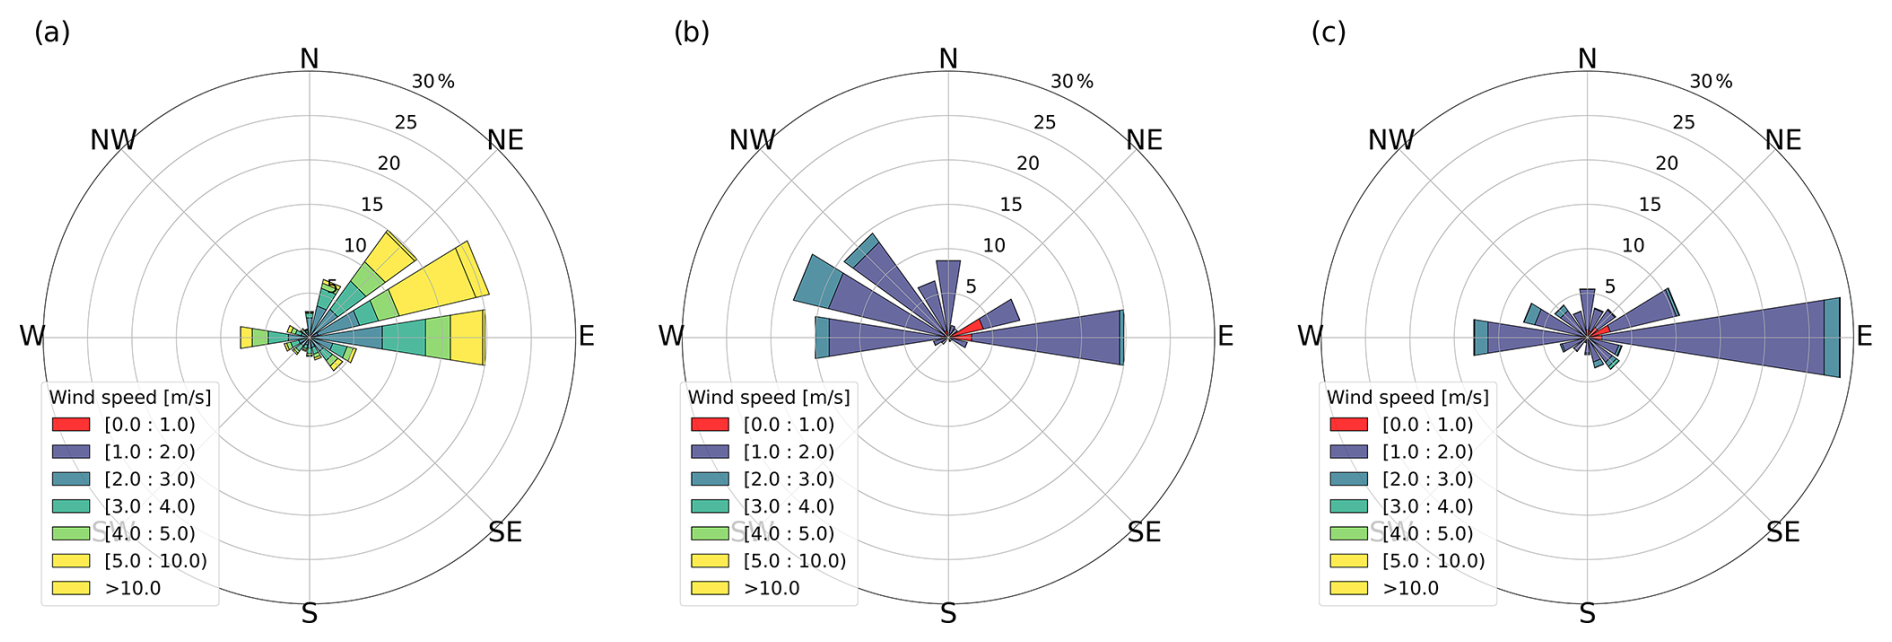
Figure 4Wind rose plots for Pula Airport for the dataset in the period 2001–2020: (a) the whole dataset, (b) fog conditions, and (c) mist conditions. The data only include reports where the variation in direction is less than 60° according to the ICAO (International Civil Aviation Organization) definition. These account for 74 % of the total data, 36 % of the data under fog conditions, and 39 % of the data under mist conditions.
Wind is a critical factor influencing the formation and persistence of fog, as turbulence from wind shear significantly impacts the height of the stable boundary layer. To understand this relationship, the statistical characteristics of wind during fog episodes were analyzed. Figure 4 shows wind distributions (data from METAR) for all conditions and for fog and mist conditions in a wind rose plot. In general, the dominant wind at Pula Airport is northeasterly (bora), which can easily reach speeds greater than 10 m s−1. Other frequently observed winds include westerlies, resulting from the interaction of Etesian winds with the sea breeze circulation (Pandžić and Likso, 2005; Klaić et al., 2009), as well as north-northeasterly and southeasterly winds. Winds from the northwest and southwest are relatively rare. The wind rose for fog conditions (Fig. 4b) contrasts sharply with general conditions; west-northwesterly winds are the most common (accounting for 47.7 % of the measurements). These winds blow from the direction of the open sea, whereas easterly winds blow from Kvarner Bay, characterized by deeper waters and numerous islands. In some cases, fog also forms under light easterly winds typically below 3 m s−1, although westerly fog events are often accompanied by wind speeds exceeding this threshold. Southerly winds are rarely associated with fog at Pula Airport.
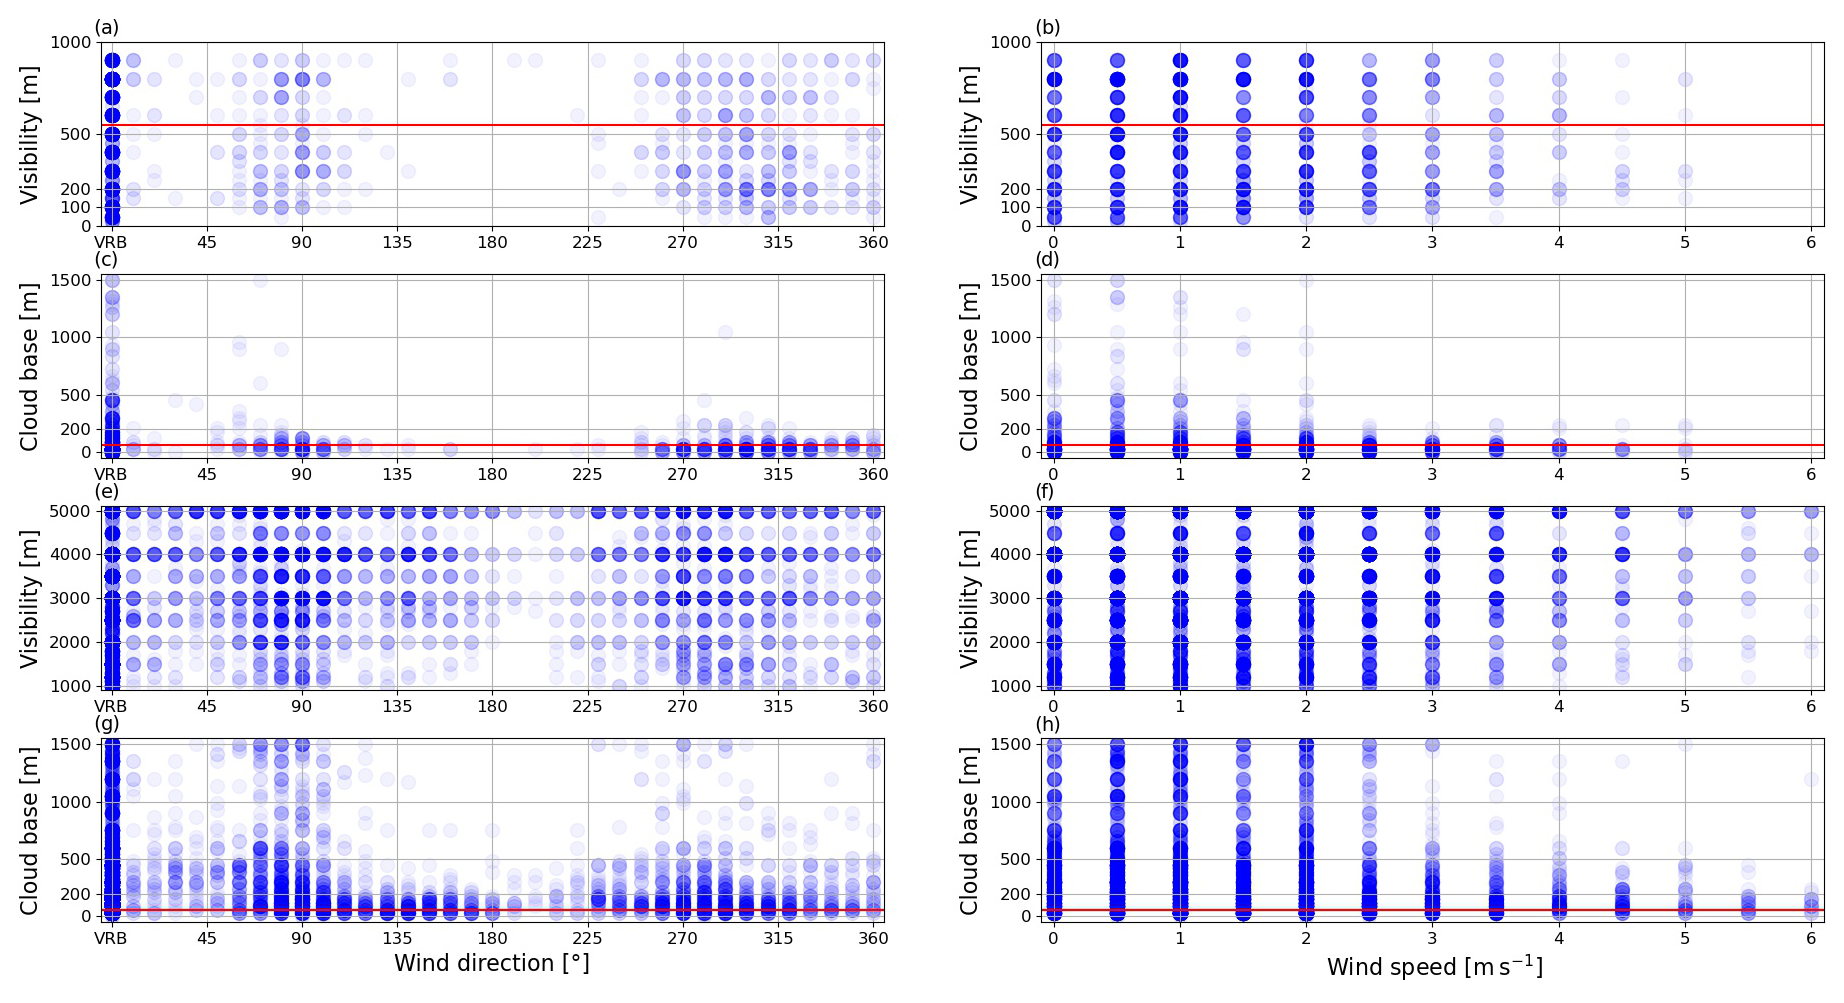
Figure 5Scatterplots of various meteorological parameters for fog conditions (a–d) and mist conditions (e–h) at Pula Airport for 2001–2020. Circles are colored according to the frequency of data points (darker – more frequent). Red lines mark the limits for the Category I takeoff–landing procedures mentioned in Sect. 2. “VRB” denotes variable wind direction (180° or more in a 2 min interval) according to the definition of the ICAO.
Mist conditions show a different wind pattern (Fig. 4c). Unlike fog, mist frequently occurs with easterly winds, which account for 28.8 % of the observations. This is consistent with the higher overall occurrence of mist compared to fog (Fig. 2). Further analysis of the relationship between wind and visibility or cloud base under fog conditions (Fig. 5a–d) highlights the rarity of fog in situations with northerly winds. The scatterplot of visibility and wind speed confirms the existence of an optimal range of wind speeds conducive to fog, with most fog events occurring at wind speeds between 0 and 2 m s−1. The same is also observed for low clouds (lower than 200 m) – the majority of low cloud bases were observed at wind speeds of 1 m s−1 or less, some between 1 and 2 m s−1, and a very few cases at higher wind speeds. The absence of cloud bases above 300 m at wind speeds higher than 2 m s−1 is interesting. Higher wind speeds indicate stronger advection, and personal communication from forecasters suggests that in these cases cloud bases can be very low. This is particularly evident under westerly flows, where fog is more common and where wind speeds are higher. The data for mist conditions (Fig. 5e–h) lead to similar conclusions for visibility – mist occurs more frequently under westerly or easterly winds with slightly higher wind speeds than fog. Mist conditions with cloud bases above 500 m do occur but are rare, and one noteworthy difference between mist and fog is the higher number of mist events with a low cloud base during southeasterly and southwesterly winds.
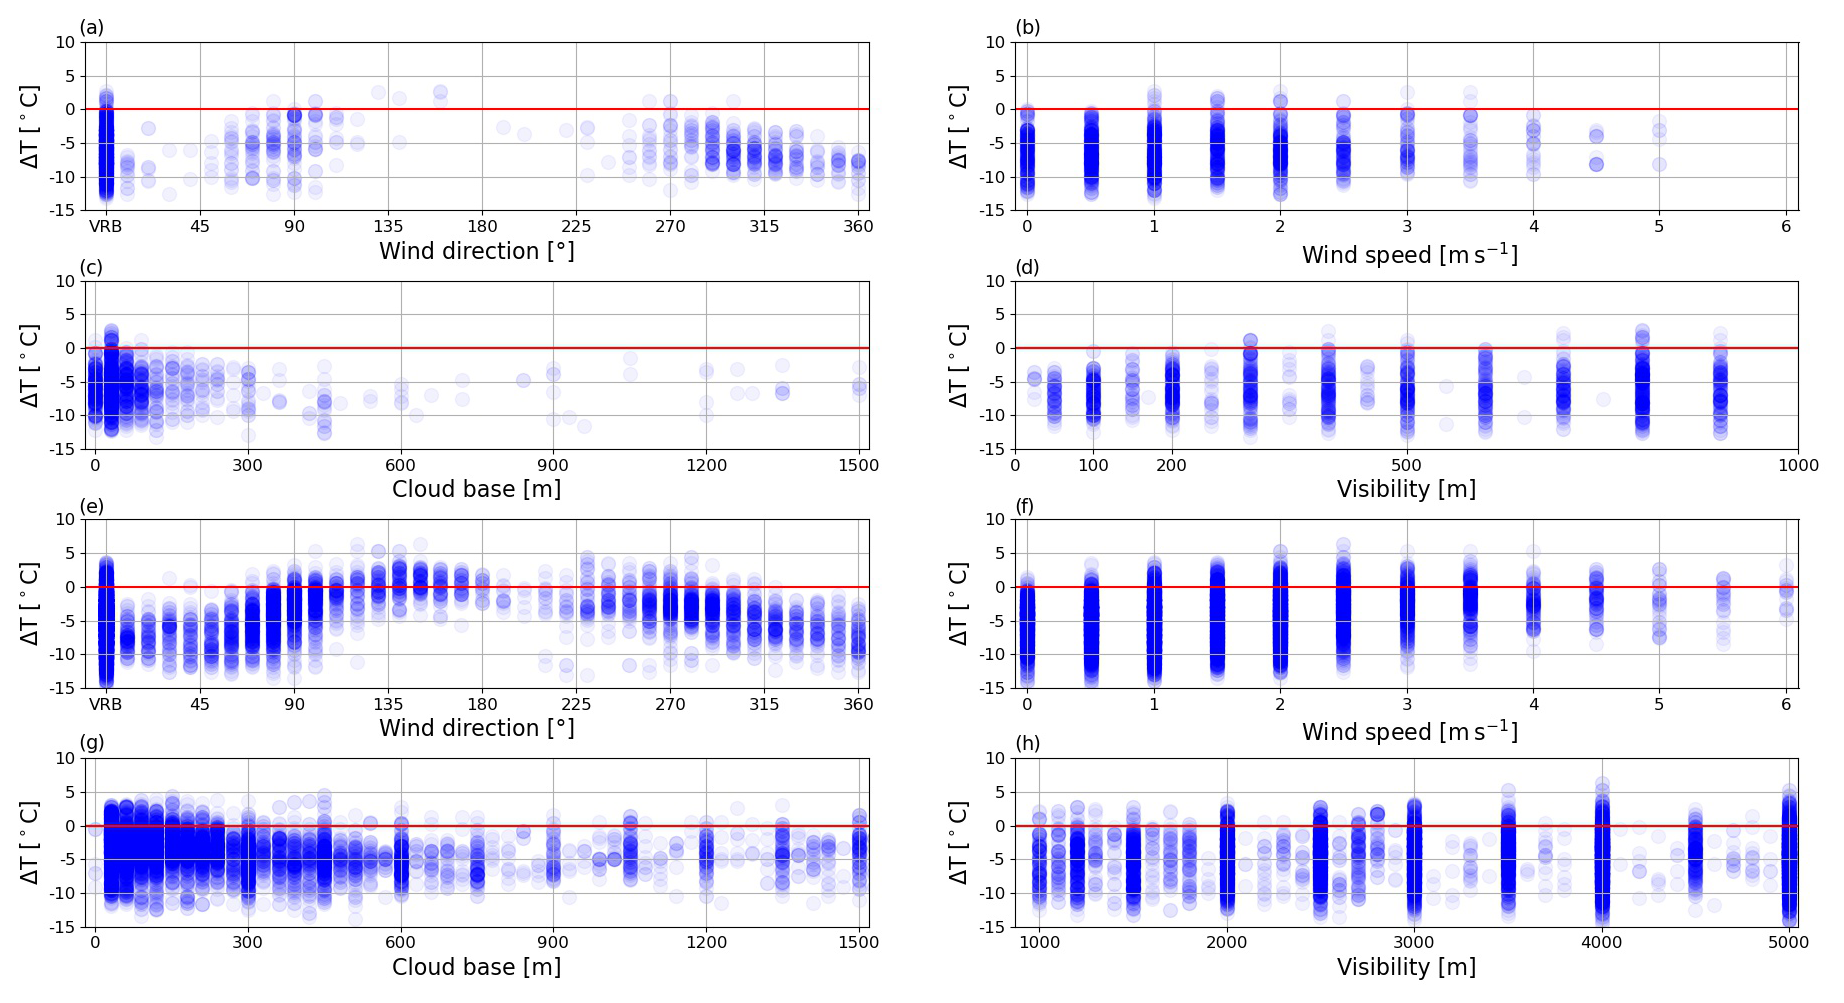
Figure 6Scatterplots of the air–sea temperature difference between Pula Airport and the Pula oceanographic station as well as various meteorological parameters at fog initiation (a–d) and mist initiation (e–h) for 2001–2020. Circles are colored according to the frequency of data points (darker – more frequent). Red lines mark the 0 °C difference between air and sea temperature. “VRB” denotes variable wind direction (180° or more in a 2 min interval) according to the definition by the ICAO.
Fog occurrence can also be analyzed by examining conditions leading up to or at the time of its formation, as demonstrated in previous studies (Tardif and Rasmussen, 2007; Veljović et al., 2015; Zoldoš and Jurković, 2016), or by investigating the difference between air and sea surface temperature for marine fog (Li et al., 2022). In this study, SAT data from METAR at Pula Airport were compared with SST measurements from the oceanographic station in Pula Bay. Figure 6a–d depict scatterplots of SAT − SST differences and various parameters at fog initiation (first METAR with visibility<1000 m), while Fig. 6e–h present similar data for mist initiation.
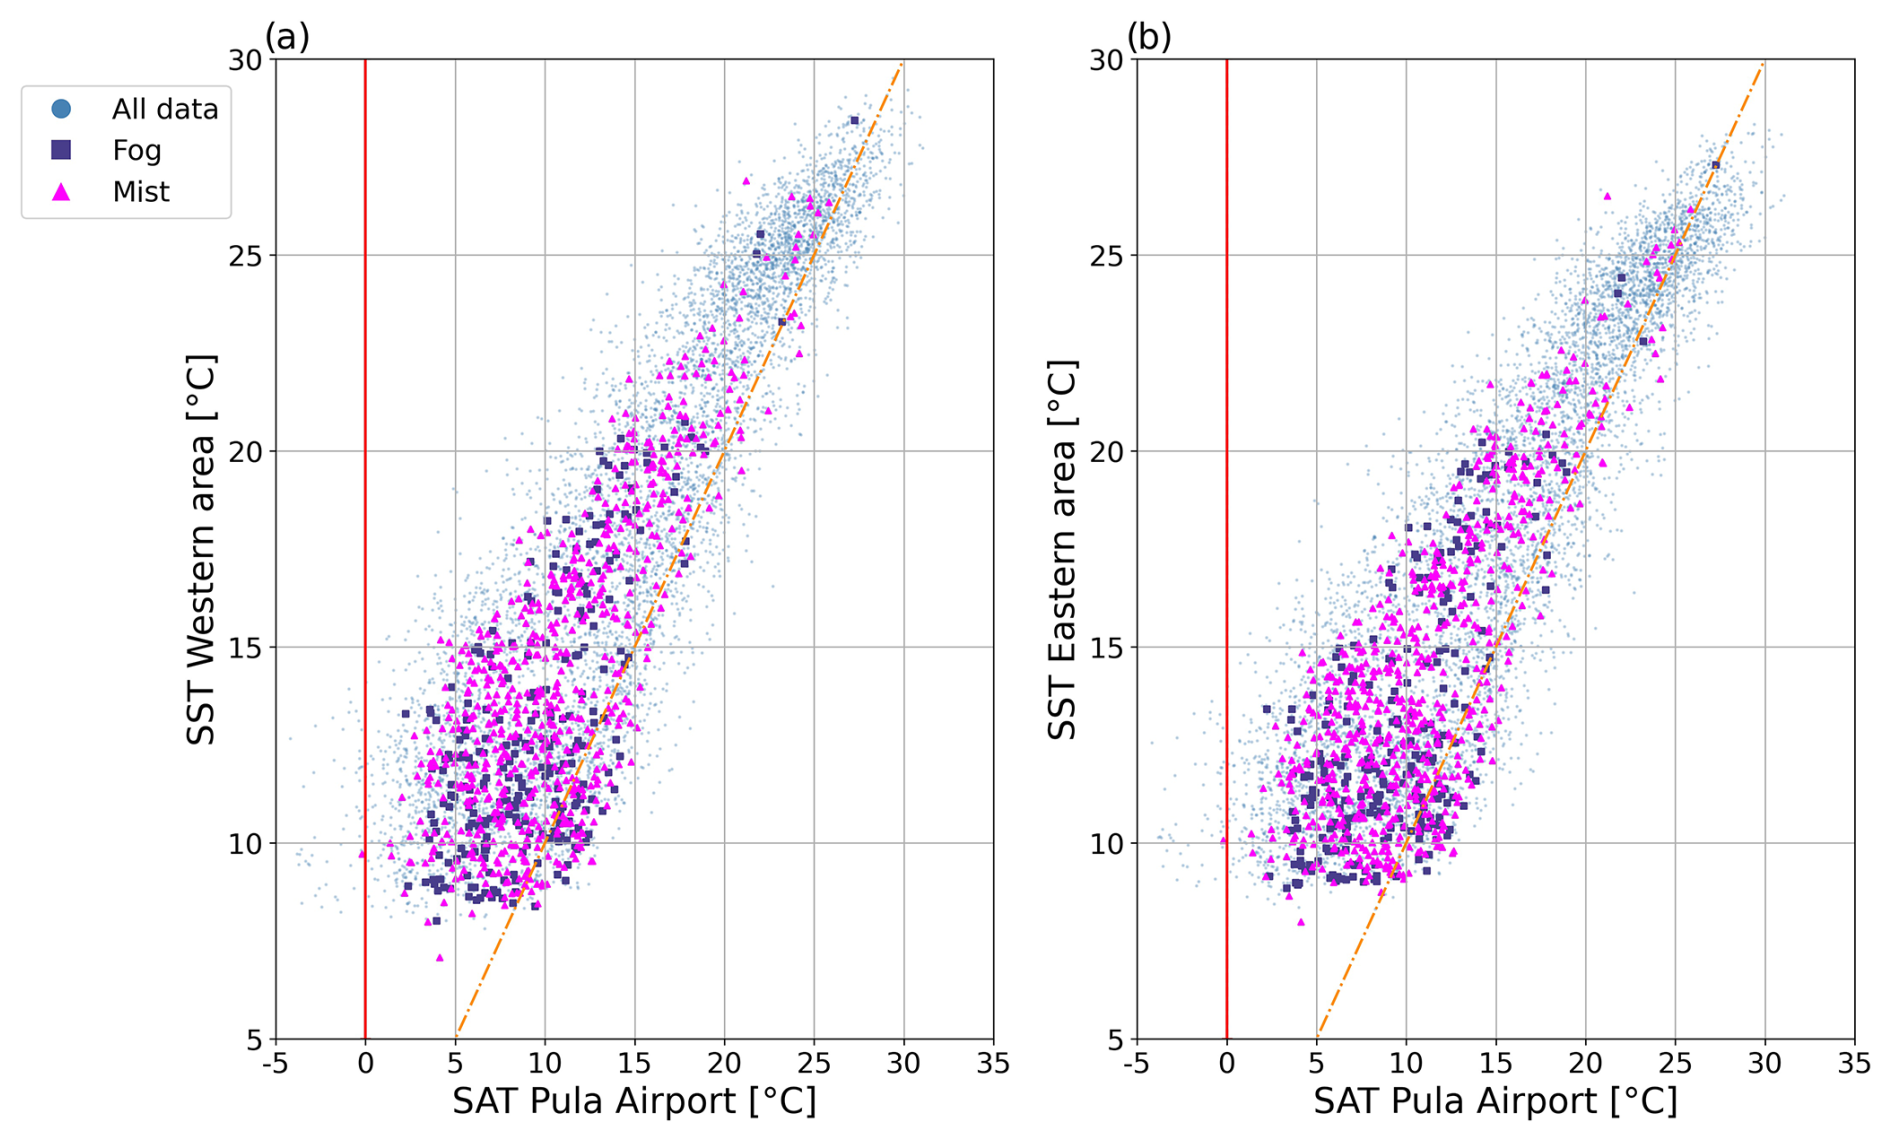
Figure 7Scatterplots of satellite sea surface temperature (SST) for the western area (a) and eastern area (b), together with the surface air temperature (SAT) at Pula Airport for 2001–2020. The vertical red line indicates SAT=0 °C, and the dotted diagonal orange line indicates SAT=SST.
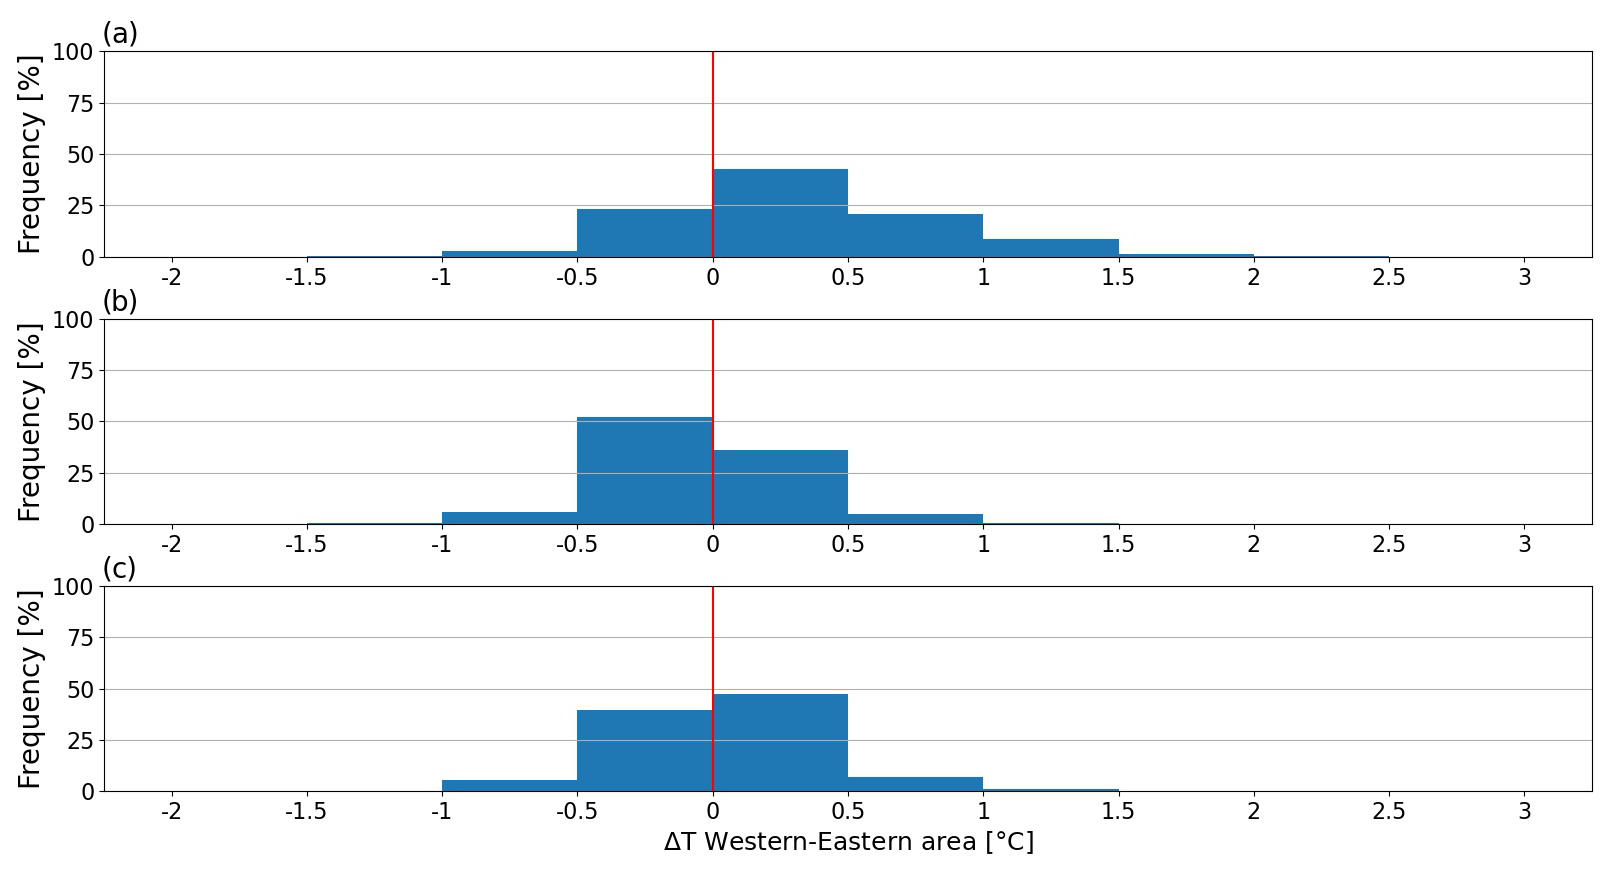
Figure 8Histograms of the satellite SST difference between the western and eastern areas for observations without fog and mist (a), with fog (b), and with mist (c).
The majority of fog and mist events occur with negative SAT − SST differences, indicating that the sea surface is warmer than the overlying air. Fog rarely forms during southerly winds, but mist is more common under these conditions, particularly with southeasterly winds (Fig. 6e). For southeasterly, southerly, and southwesterly winds with mist, the SAT − SST difference tends to approach 0. Of the fog events, 97.4 % occurred with negative SAT − SST differences, with only 2.6 % forming under conditions where SAT is equal to or warmer than SST. In mist cases, the proportion of positive or zero SAT − SST differences is slightly higher (7.4 %) but still strongly favors conditions with warm seas and cooler air. At Pula Airport, fog is more common at wind speeds above 3 m s−1 than in continental areas such as Zagreb Airport (Zoldoš and Jurković, 2016), but it is less common than in coastal regions such as California, where fog occurs at speeds above 10 m s−1 (Filonczuk et al., 1995). Fog rarely occurs under calm conditions (Fig. 4b), suggesting an optimal wind speed range for its formation and warranting further exploration, as the role of wind speed in turbulence and surface heat fluxes, as highlighted by Gultepe et al. (2007), significantly influences fog. While the influence of SST was initially assessed by comparing SAT measurements from the airport with SST data from the oceanographic station, a more comprehensive understanding is obtained by examining the effect of the sea to the west and east of the airport. To achieve this, satellite-derived SST values for the regions west and east of the airport (Fig. 1b) were analyzed. These areas correspond to the directions of the two prevailing winds most commonly associated with fog formation at Pula Airport. Scatterplots of SAT versus SST were generated for the eastern and western regions, encompassing all observations, as well as those specifically under fog and mist conditions (Fig. 7). A visual analysis indicates that fog and mist typically form when SAT–SST pairs are associated with lower values. A more detailed analysis reveals that fog data points (squares) in the western region are more dispersed, indicating greater variability in SST for the same SAT, while the eastern region shows a more consistent SST–SAT relationship. Statistical analysis supports this observation, with the standard deviation of SST for fog observations being 3.55 °C in the western area and 3.37 °C in the eastern area. For mist, the standard deviation is 4.03 °C in the western area and 3.83 °C in the eastern area. To further investigate the role of SST in fog formation, differences in SST between the western and eastern regions were analyzed under various conditions (Fig. 8). When neither fog nor mist is present, SST in the western area is slightly higher than in the eastern area. During fog events, however, the pattern reverses, with SST being higher in the eastern area. In contrast, mist typically occurs when SST is higher in the western area than in the eastern area. These differences align with the prevailing wind directions observed during fog and mist events (Fig. 4). During fog, winds that are predominantly from the west to northwest (W–NW) promote cooling in the western area. Winds from the east (E) during mist contribute to reduced SST in the eastern region. Despite these variations, the SST differences between the two areas are small, rarely exceeding 0.5 °C.
3.2 GNG analysis of synoptic weather patterns
In this analysis, the GNG method was applied to identify characteristic temporal and spatial patterns in wind and MSLP fields associated with the formation of fog and mist in the Pula region. The analysis was conducted on a monthly basis, processing data for each month (e.g., all January data or all February data) separately. This approach was chosen to improve the interpretability of the results, to take seasonality into account, and to reduce the computational effort, especially given the large size of the hourly dataset. To save resources, the GNG algorithm was applied exclusively to 10 m wind data from ERA5, with the derived pressure fields being extrapolated afterwards. The derived pressure field corresponds to the mean pressure field associated with each BMU. Once the BMUs were identified, all pressure fields corresponding to the time instances of each BMU were retrieved and averaged to calculate the mean pressure field for each BMU. To obtain an appropriate synoptic situation with large wind systems, such as anticyclones and cyclones affecting the northern Adriatic, a large area in the Mediterranean was selected for analysis (Fig. 1b). The analysis utilized 40 years of ERA5 data (1979–2019), providing extensive time series data to enable the GNG algorithm to derive robust and accurate spatiotemporal patterns. Notably, there is a 1-year discrepancy between the ERA5 dataset and the fog dataset (2020) due to the GNG analysis being completed before this study began, and the computational resources required for a new analysis were unavailable. Since the wind was the primary variable and the MSLP was derived by averaging numerous synoptic situations, the wind had the dominant influence. This approach excluded the occurrence of extreme cyclonic systems (MSLP<1000 hPa) or anticyclonic systems (MSLP>1030 hPa) from the results. For example, deep cyclones, which are extremes, are smoothed, and while BMUs can indicate their locations, the exact pressure values are not retained. However, from a conceptual point of view, the interaction between high- and low-pressure systems and the locations of these systems and their associated winds match well with the climatology of the region.
This process generated 9 BMUs for each month (a total of 108 BMUs) distributed across hourly data, representing the weather patterns with the highest variance. Hourly data were then aggregated into daily data by identifying the most frequently occurring BMU within a day. For the 2001–2019 period, each day with fog or mist was assigned to its corresponding dominant BMU, providing a synoptic weather pattern classification for fog and mist days at Pula Airport. To focus on the prevailing synoptic patterns that contribute to the formation of fog and mist, the months from October to March (Fig. 2b) were examined in more detail (Table 1). In this way, 85 % of the variability could be captured. Then, for each month, the first BMUs whose sum of their contributions to the variability exceeded the threshold of 60 % were selected. In this way, a total of 18 BMUs were included in the further analysis, which is significantly fewer than 54 BMUs (6 months multiplied by 9 BMUs). By selecting two to four BMUs for each month based on the criteria described above, the study captured more than 60 % of the events for each analyzed month.
Table 1Display of the most frequent best-matching units (BMUs) (the first BMUs for each month whose sum of their contributions to the variability exceeded the threshold of 60 %) describing the prevailing synoptic weather pattern during the days with fog and mist for the selected month at Pula Airport for 2001–2019. The slope coefficients describe the linear trends of the most common BMUs, i.e., the yearly change in frequency, and they are also used to generate the graphs of the linear trends in Fig. 14.
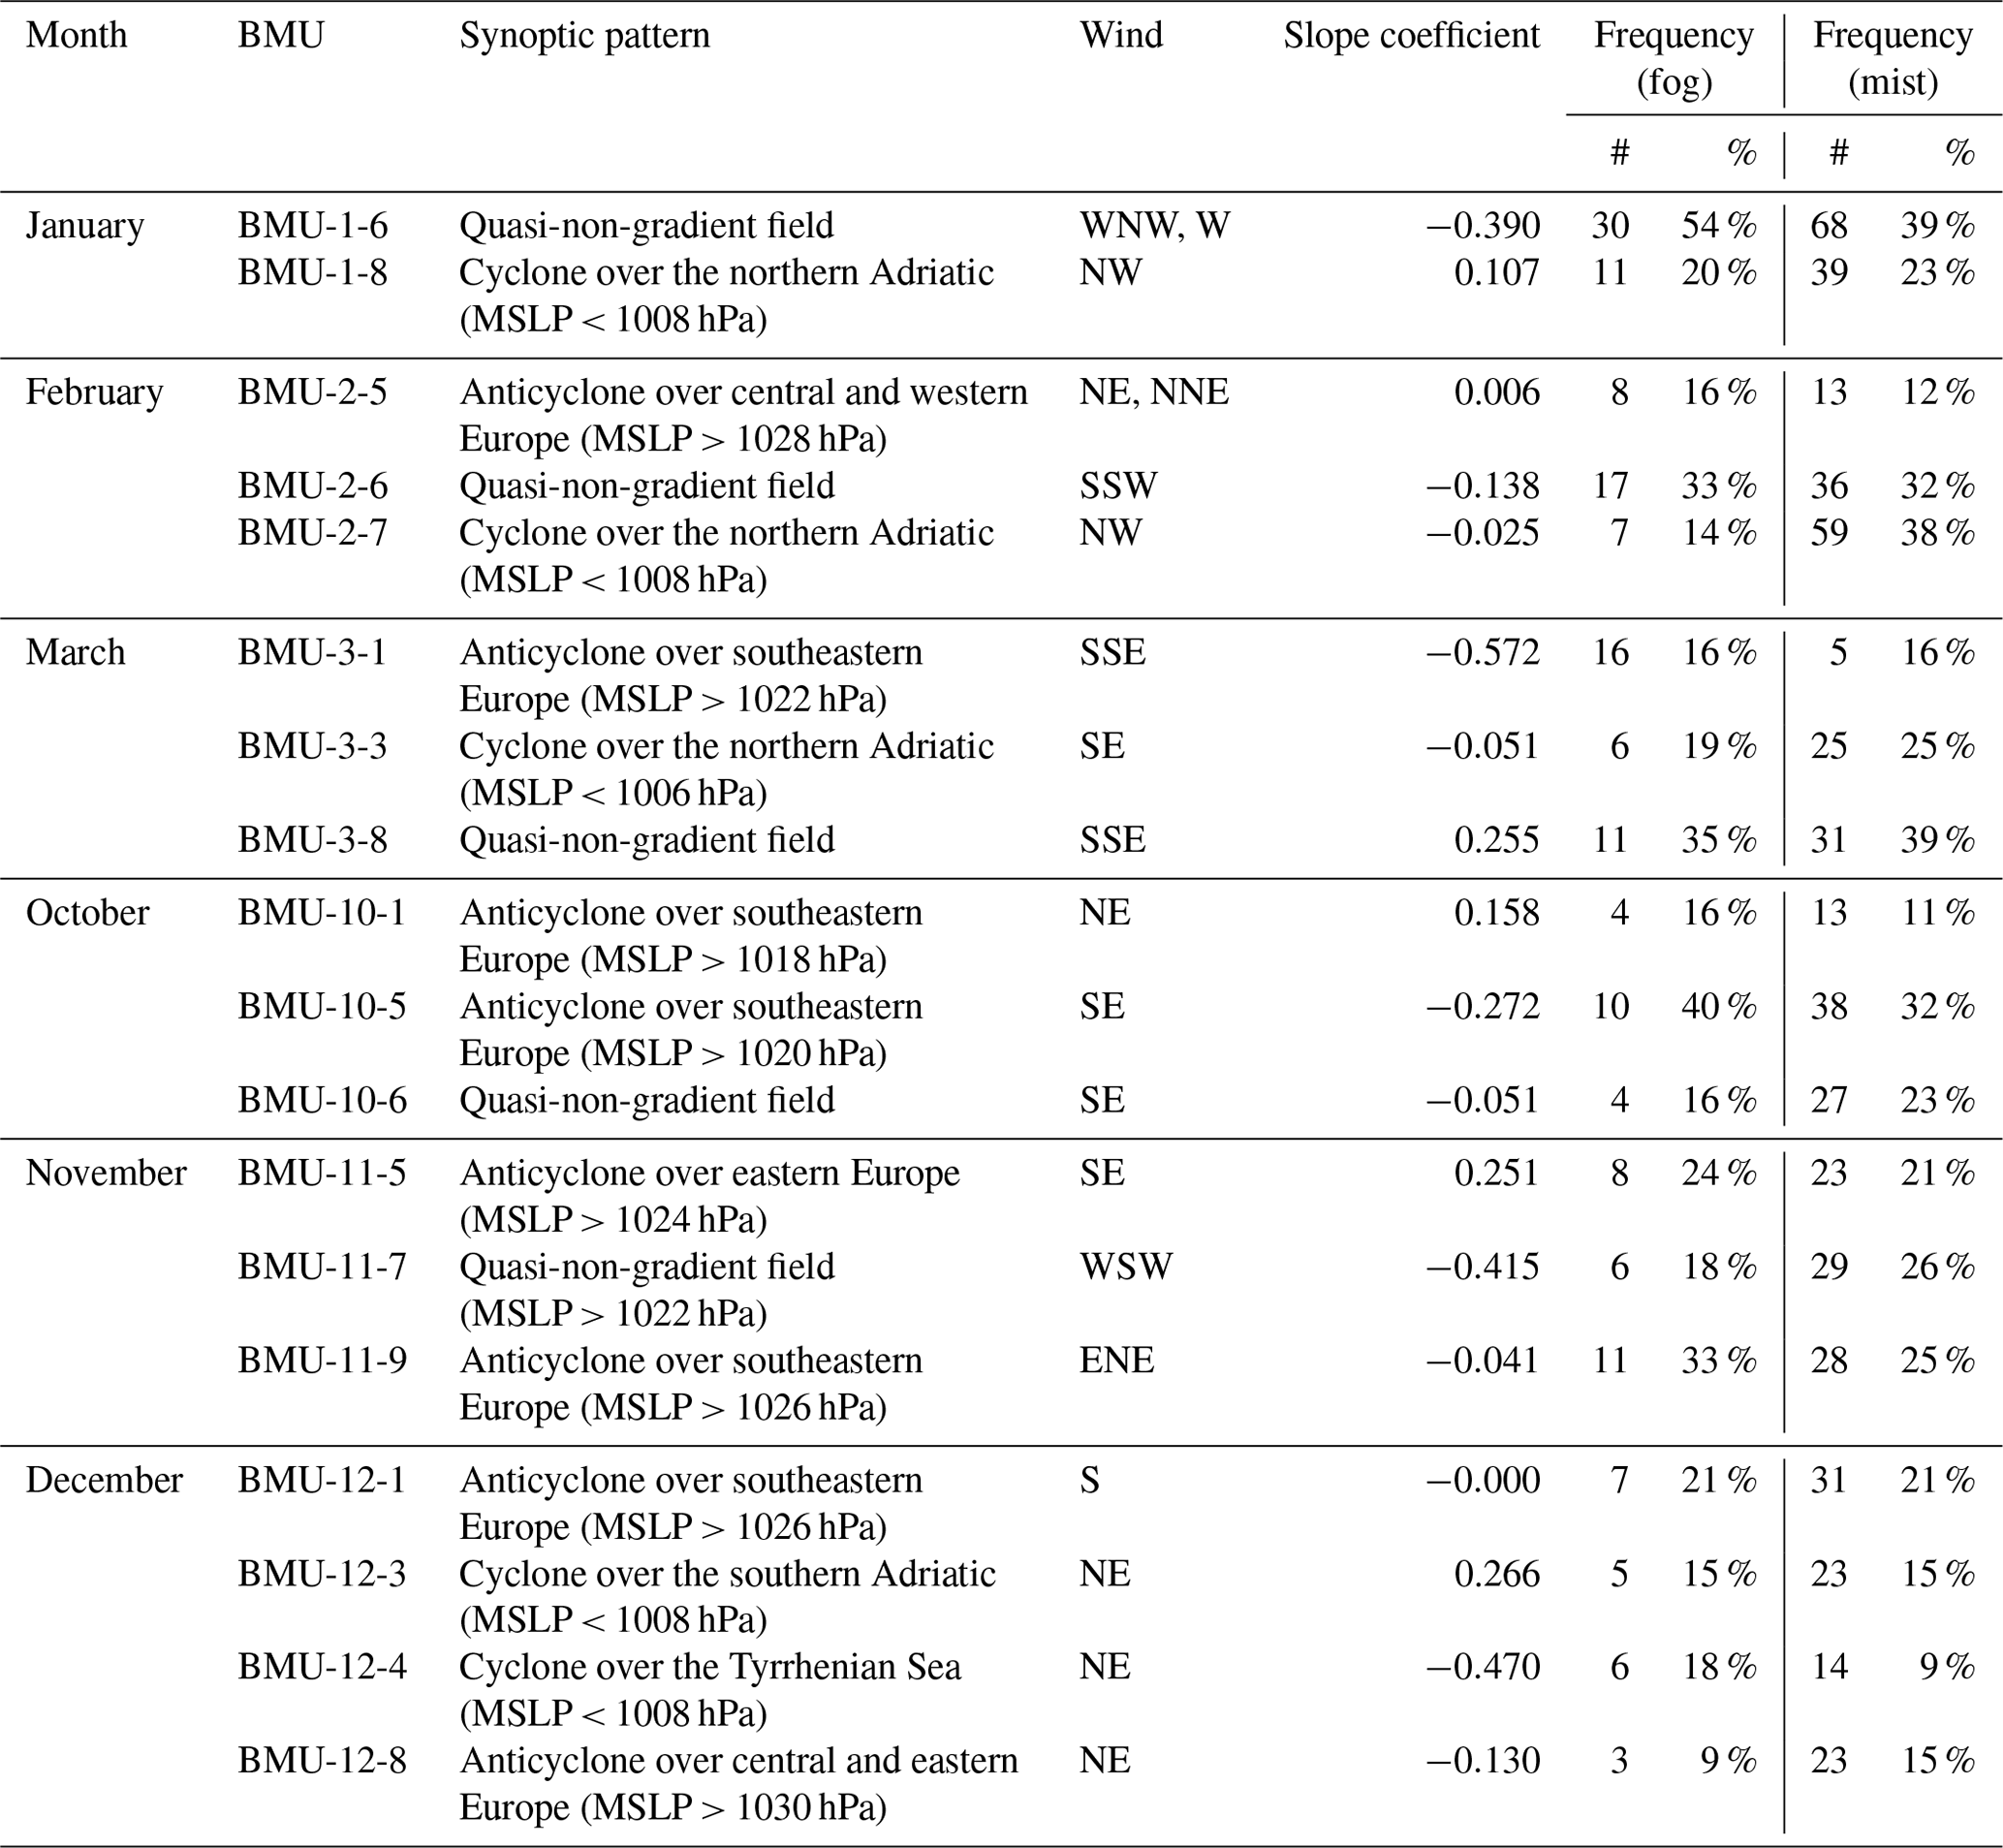
The analysis of synoptic patterns associated with fog formation (Table 1) indicates that, in January, the dominant conditions favoring fog and mist in Pula are characterized by a quasi-non-gradient field across the region (BMU-1-6, Fig. 9a), with a very weak mean pressure gradient (Belušić Vozila et al., 2021). This stable atmospheric pattern supports the persistence of calm and stagnant air masses over Pula, limiting the dispersion of moisture and pollutants and thereby enabling fog formation. The second most common synoptic pattern conducive to the formation of fog and mist features a cyclone over the northern Adriatic (BMU-1-8, Fig. 9c). Both synoptic patterns support weak west-northwesterly or northwesterly winds over the Istrian Peninsula (Fig. 9b and d). A similar synoptic pattern persists during the transition into February and March. The cyclone over the northern Adriatic is the most frequent pattern suitable for the formation of mist in February (BMU-2-7, Fig. 10a) and is the second most frequent one in March (BMU-3-3, Fig. 10e). The difference is the prevailing northwesterly wind in February (Fig. 10b), while March is characterized by southeasterly winds (Fig. 10f). The quasi-non-gradient pressure field is the most common pattern favorable for fog and mist formation in March (BMU-3-8, Fig. 10g), the second most common one for fog, and the most common one for mist in February (BMU-2-6, Fig. 9g). South-southwesterly winds are observed in February (Fig. 9h), whereas March is associated with weaker south-southeasterly winds (Fig. 10d). In addition to the quasi-non-gradient field, favorable synoptic patterns in both February and March also include anticyclones over continental Europe (BMU-2-5, Fig. 9e; BMU-3-1, Fig. 10c).
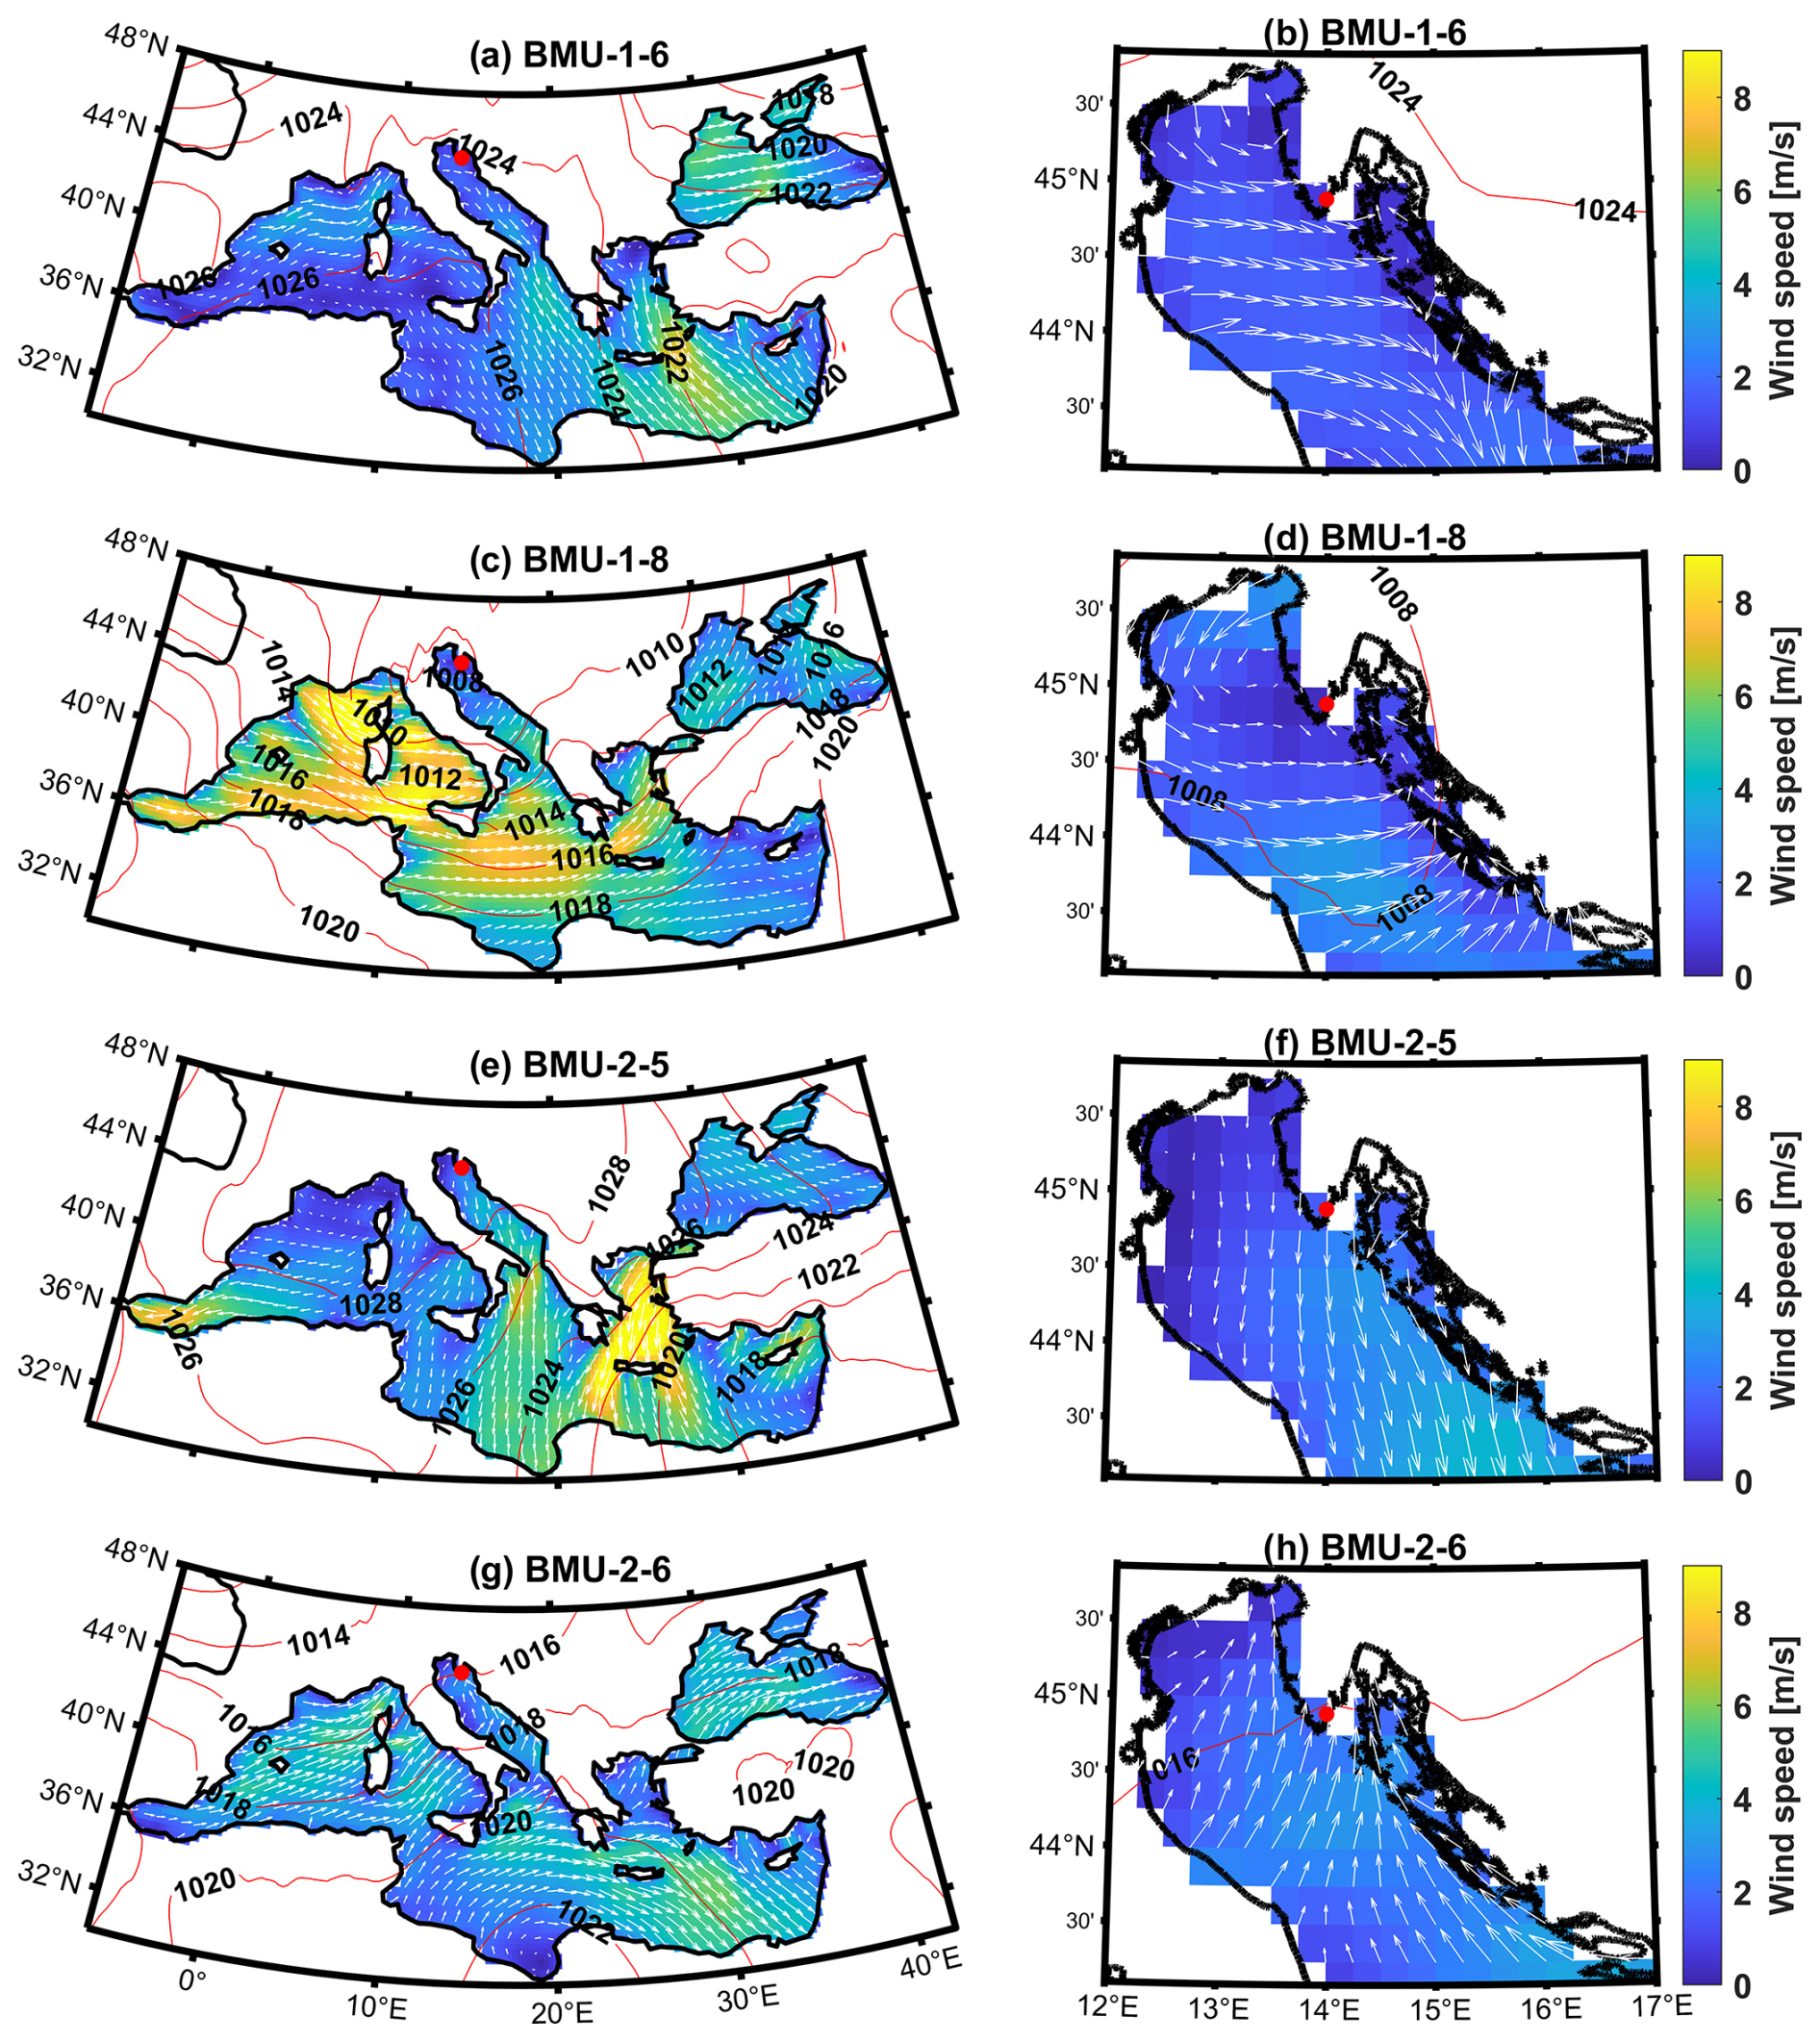
Figure 9Prevailing BMUs describing the synoptic patterns favoring the formation of fog and mist at Pula Airport in January (a, c) and February (e, g) for the wider Mediterranean region. The red dot marks the location of Pula Airport. The red contour lines show the mean sea level pressure (MSLP). The contours represent the amplitude of the wind speed, above which the wind vectors are represented by arrows (every third vector has been drawn). The same principle applies to the zoomed area of the northern and central Adriatic for January (b, d) and February (f, h), but here each vector is plotted.
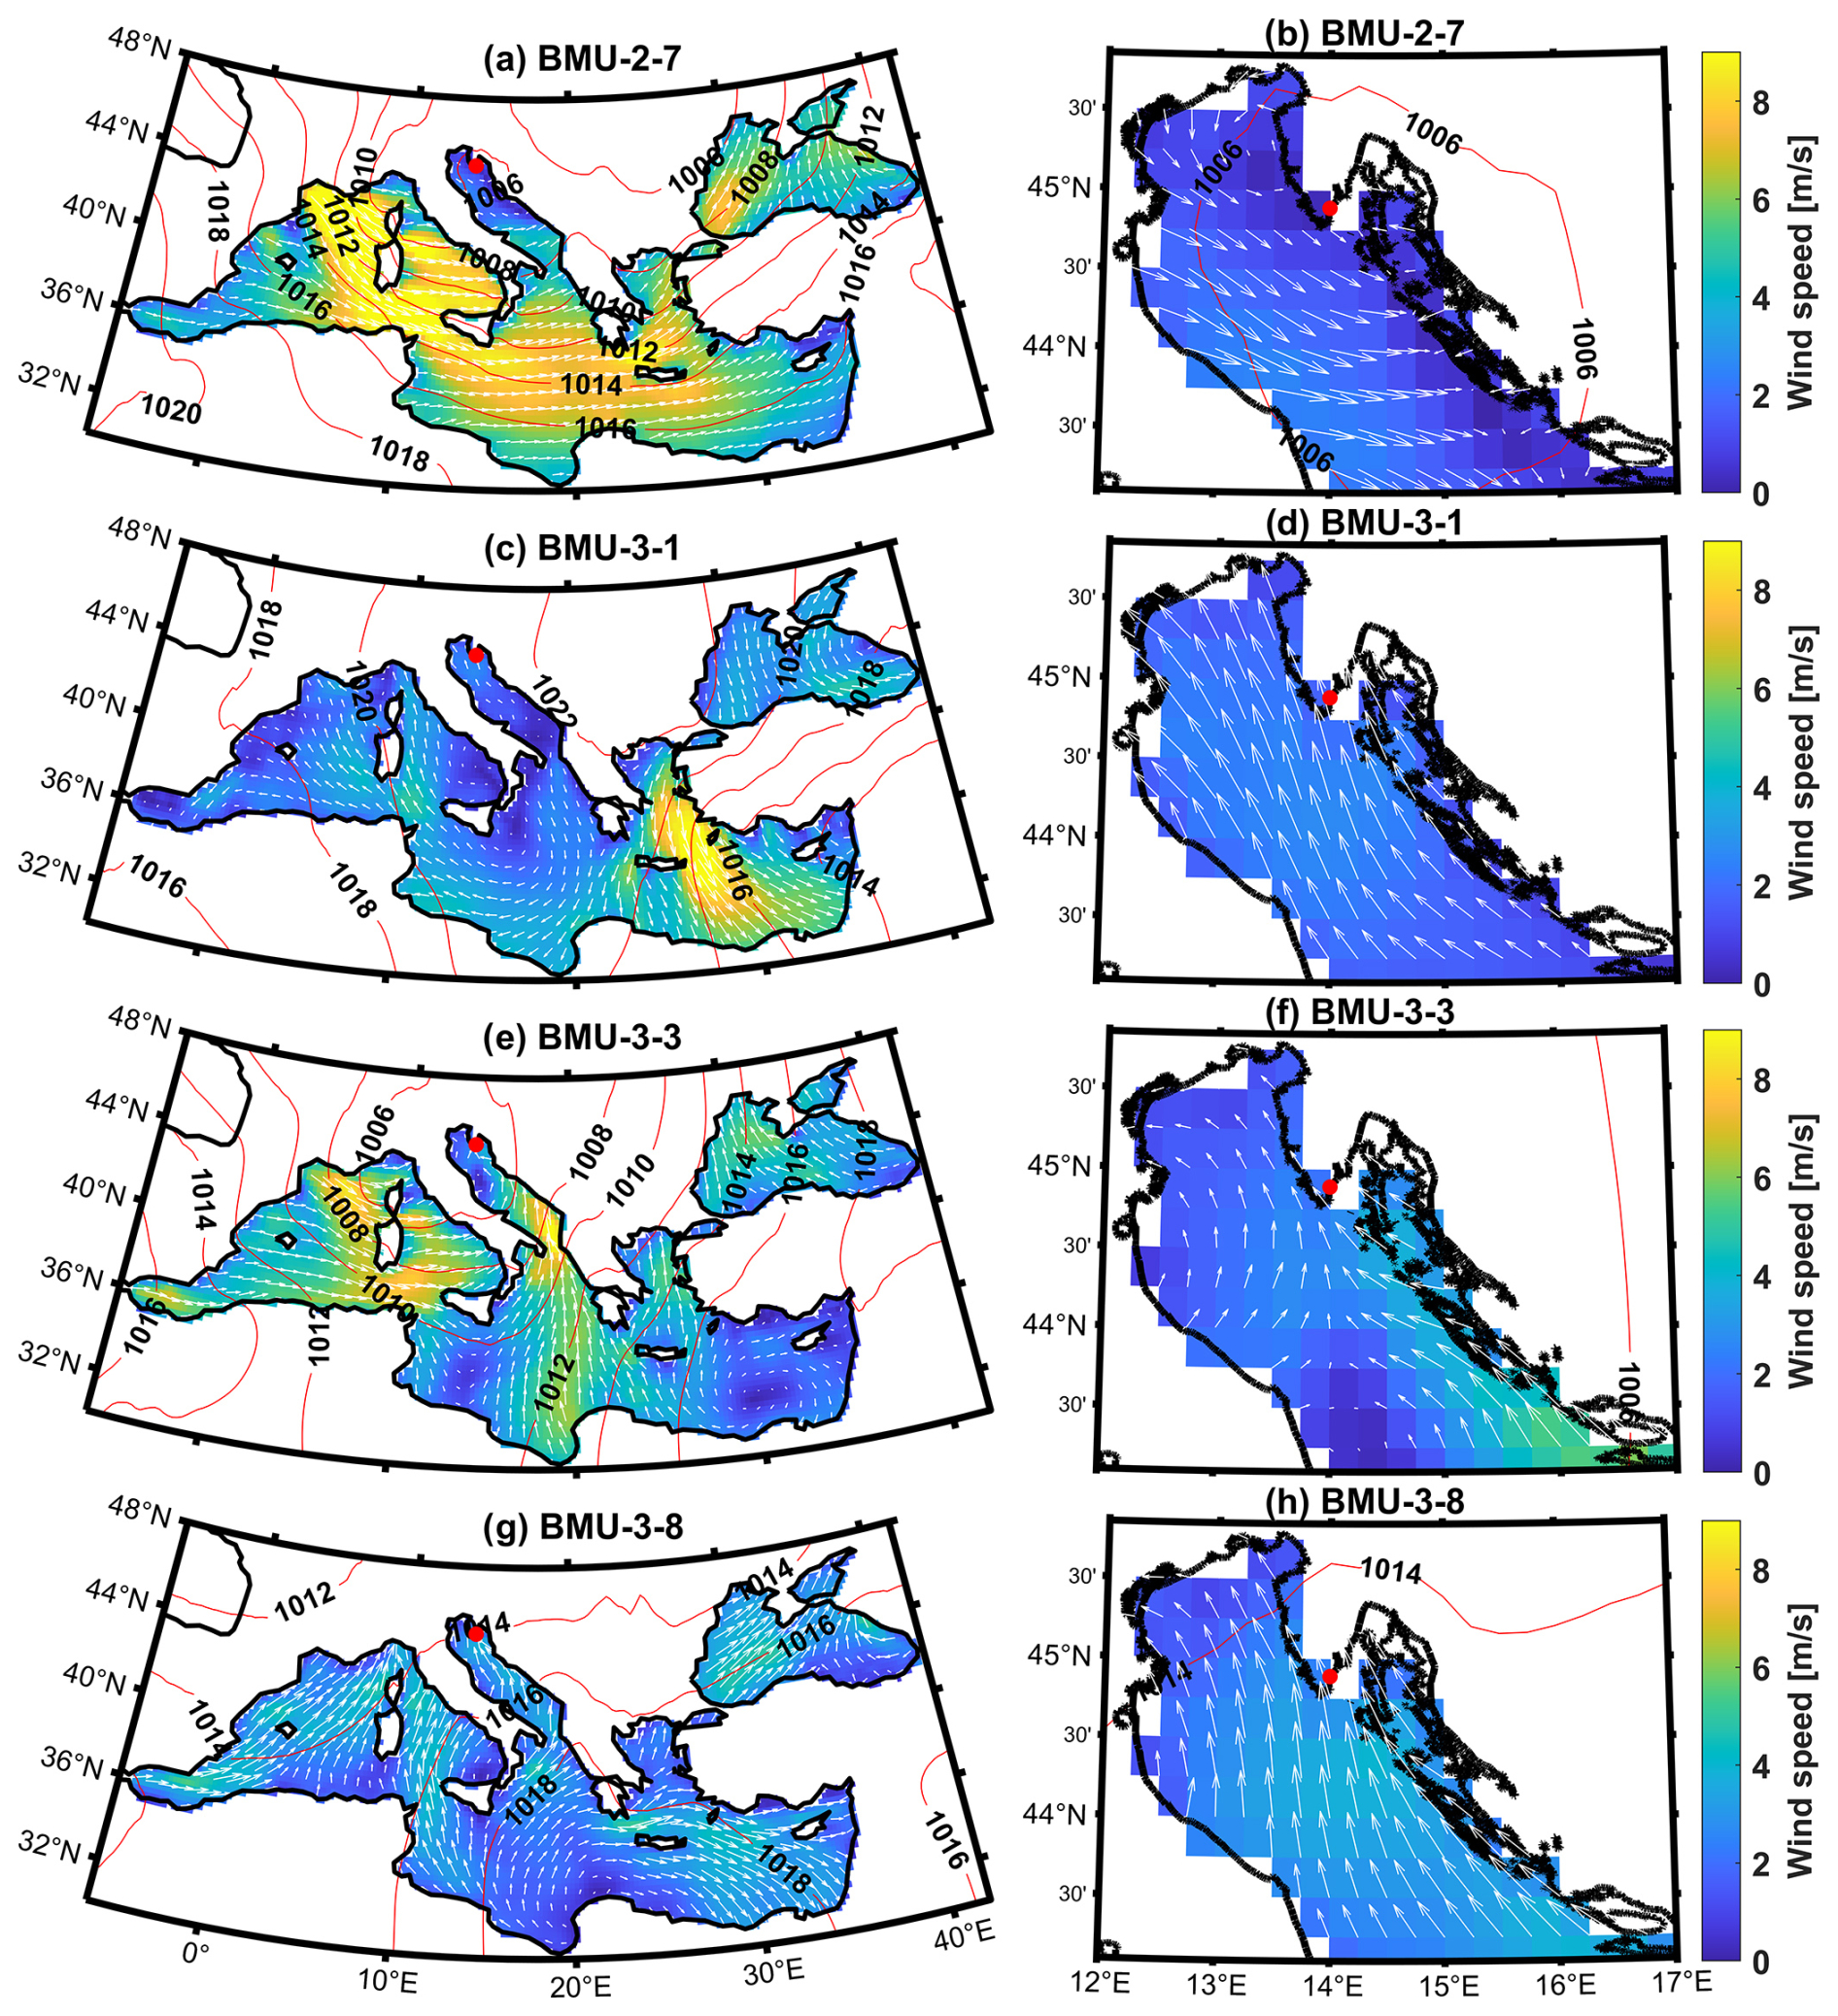
Figure 10Similar to Fig. 9 but for February (a) and March (c, e, g) in the wider Mediterranean area and for the northern and central Adriatic: February (b) and March (d, f, h) in the zoomed-in area.
Fog events are rare in Pula from April to September, and as a result the BMU analysis does not reveal clear patterns. The infrequent occurrence of fog during this period is attributed to lower relative humidity and the more stable atmospheric conditions typical of summer in the region. However, local factors, such as sea or land breeze, may influence fog formation. Therefore, any analysis based on data from these months should be interpreted with caution, as the number of recorded fog events is limited.
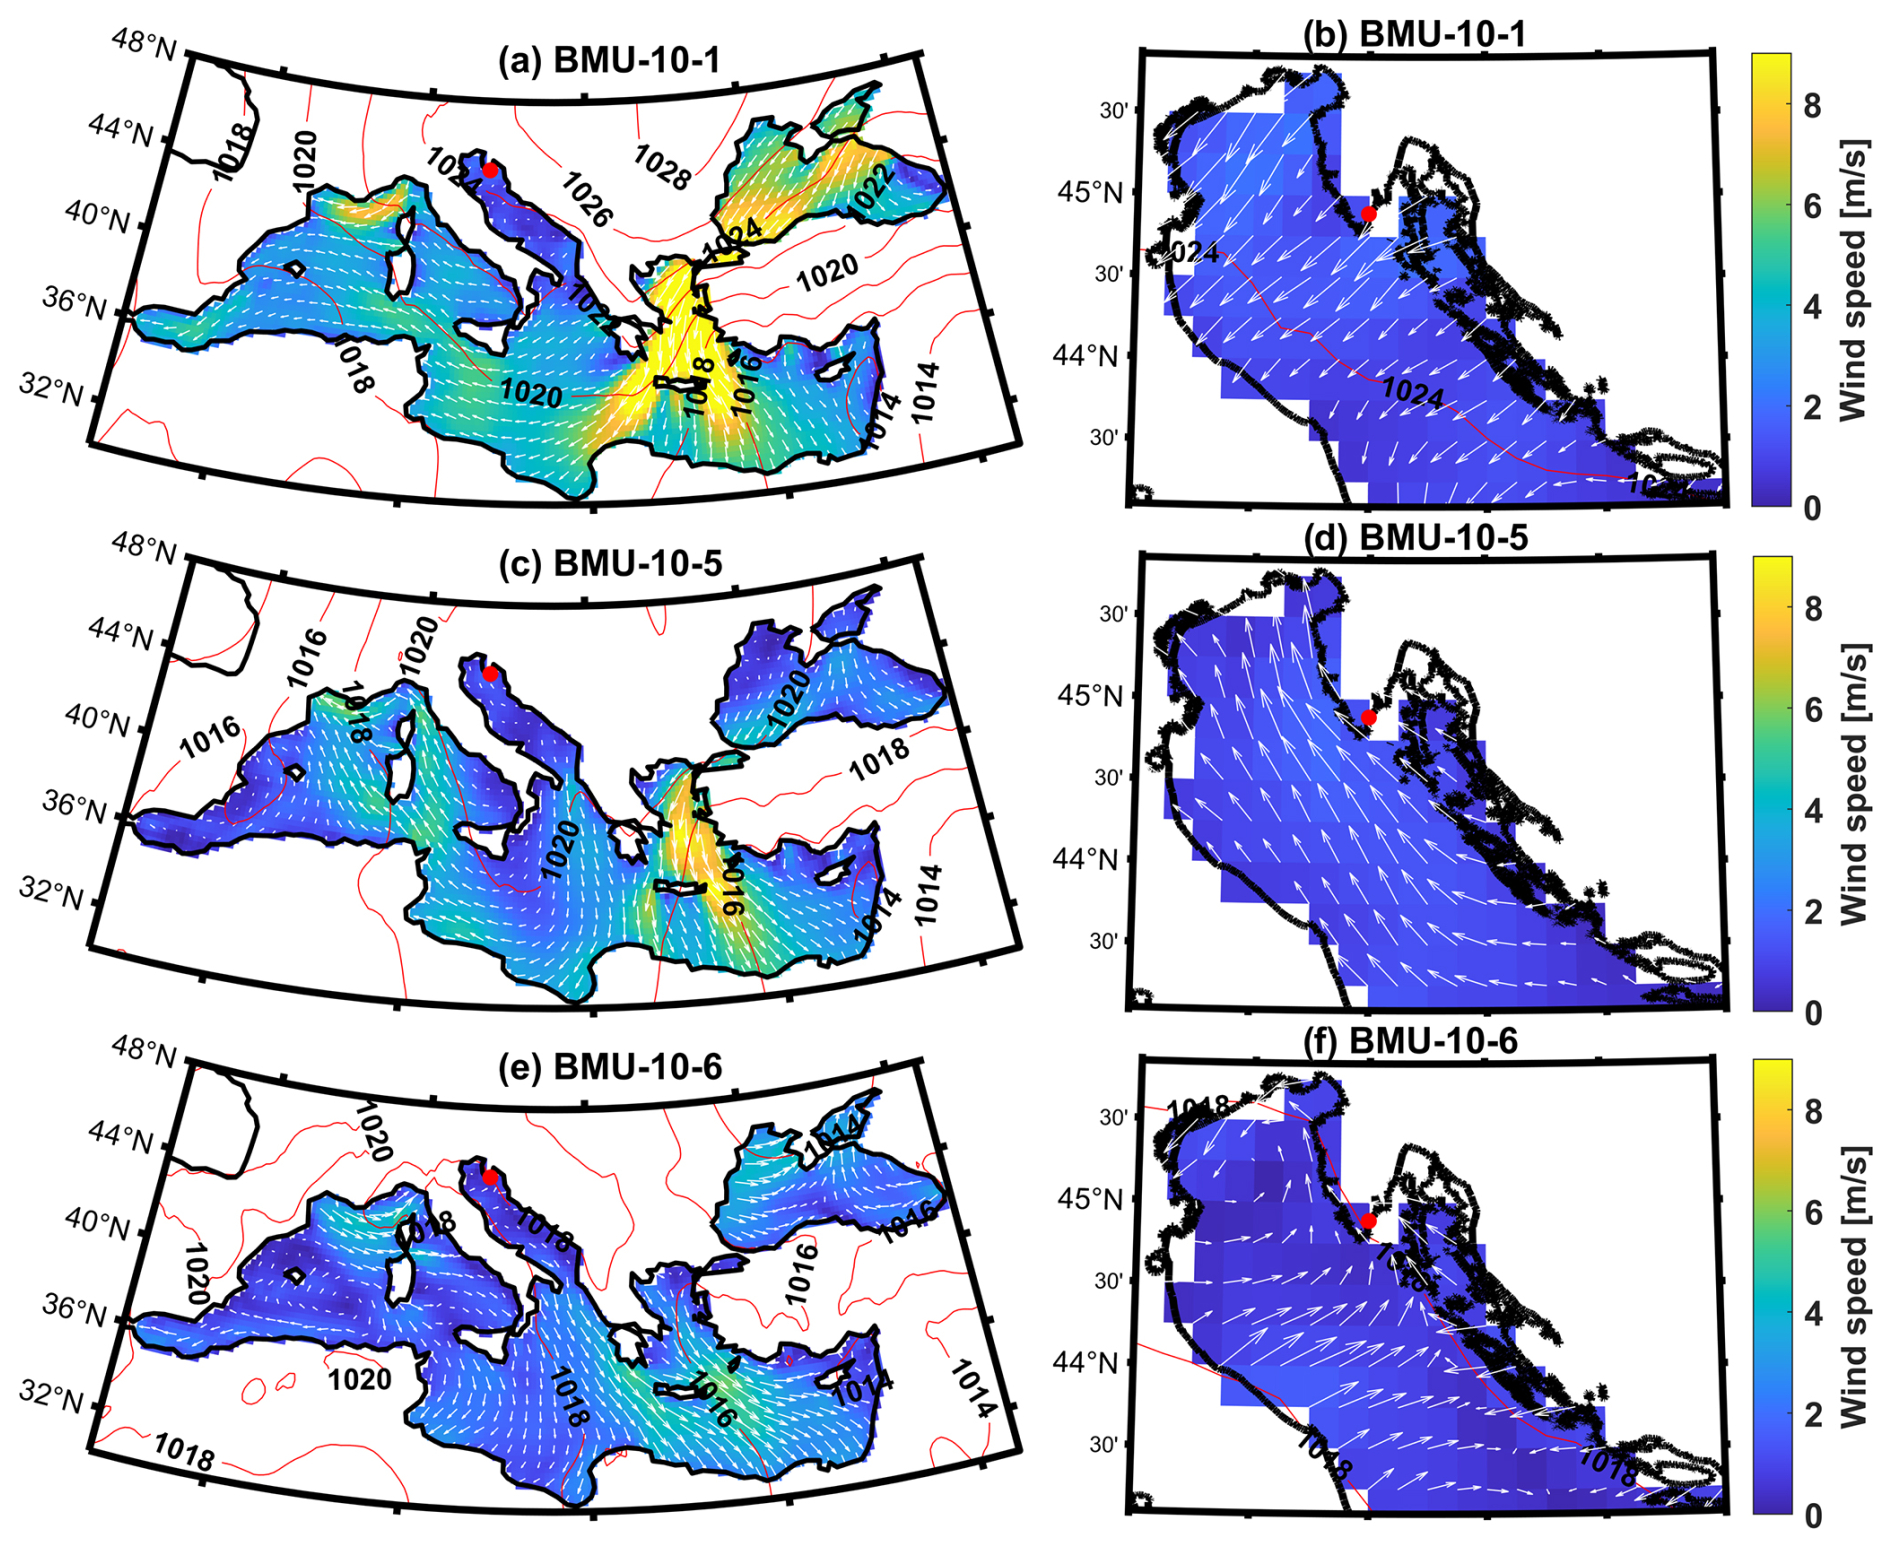
Figure 11Similar to Fig. 9 but for October: panels (a), (c), and (e) show the wider Mediterranean area, while panels (b), (d), and (f) focus on the northern and central Adriatic.
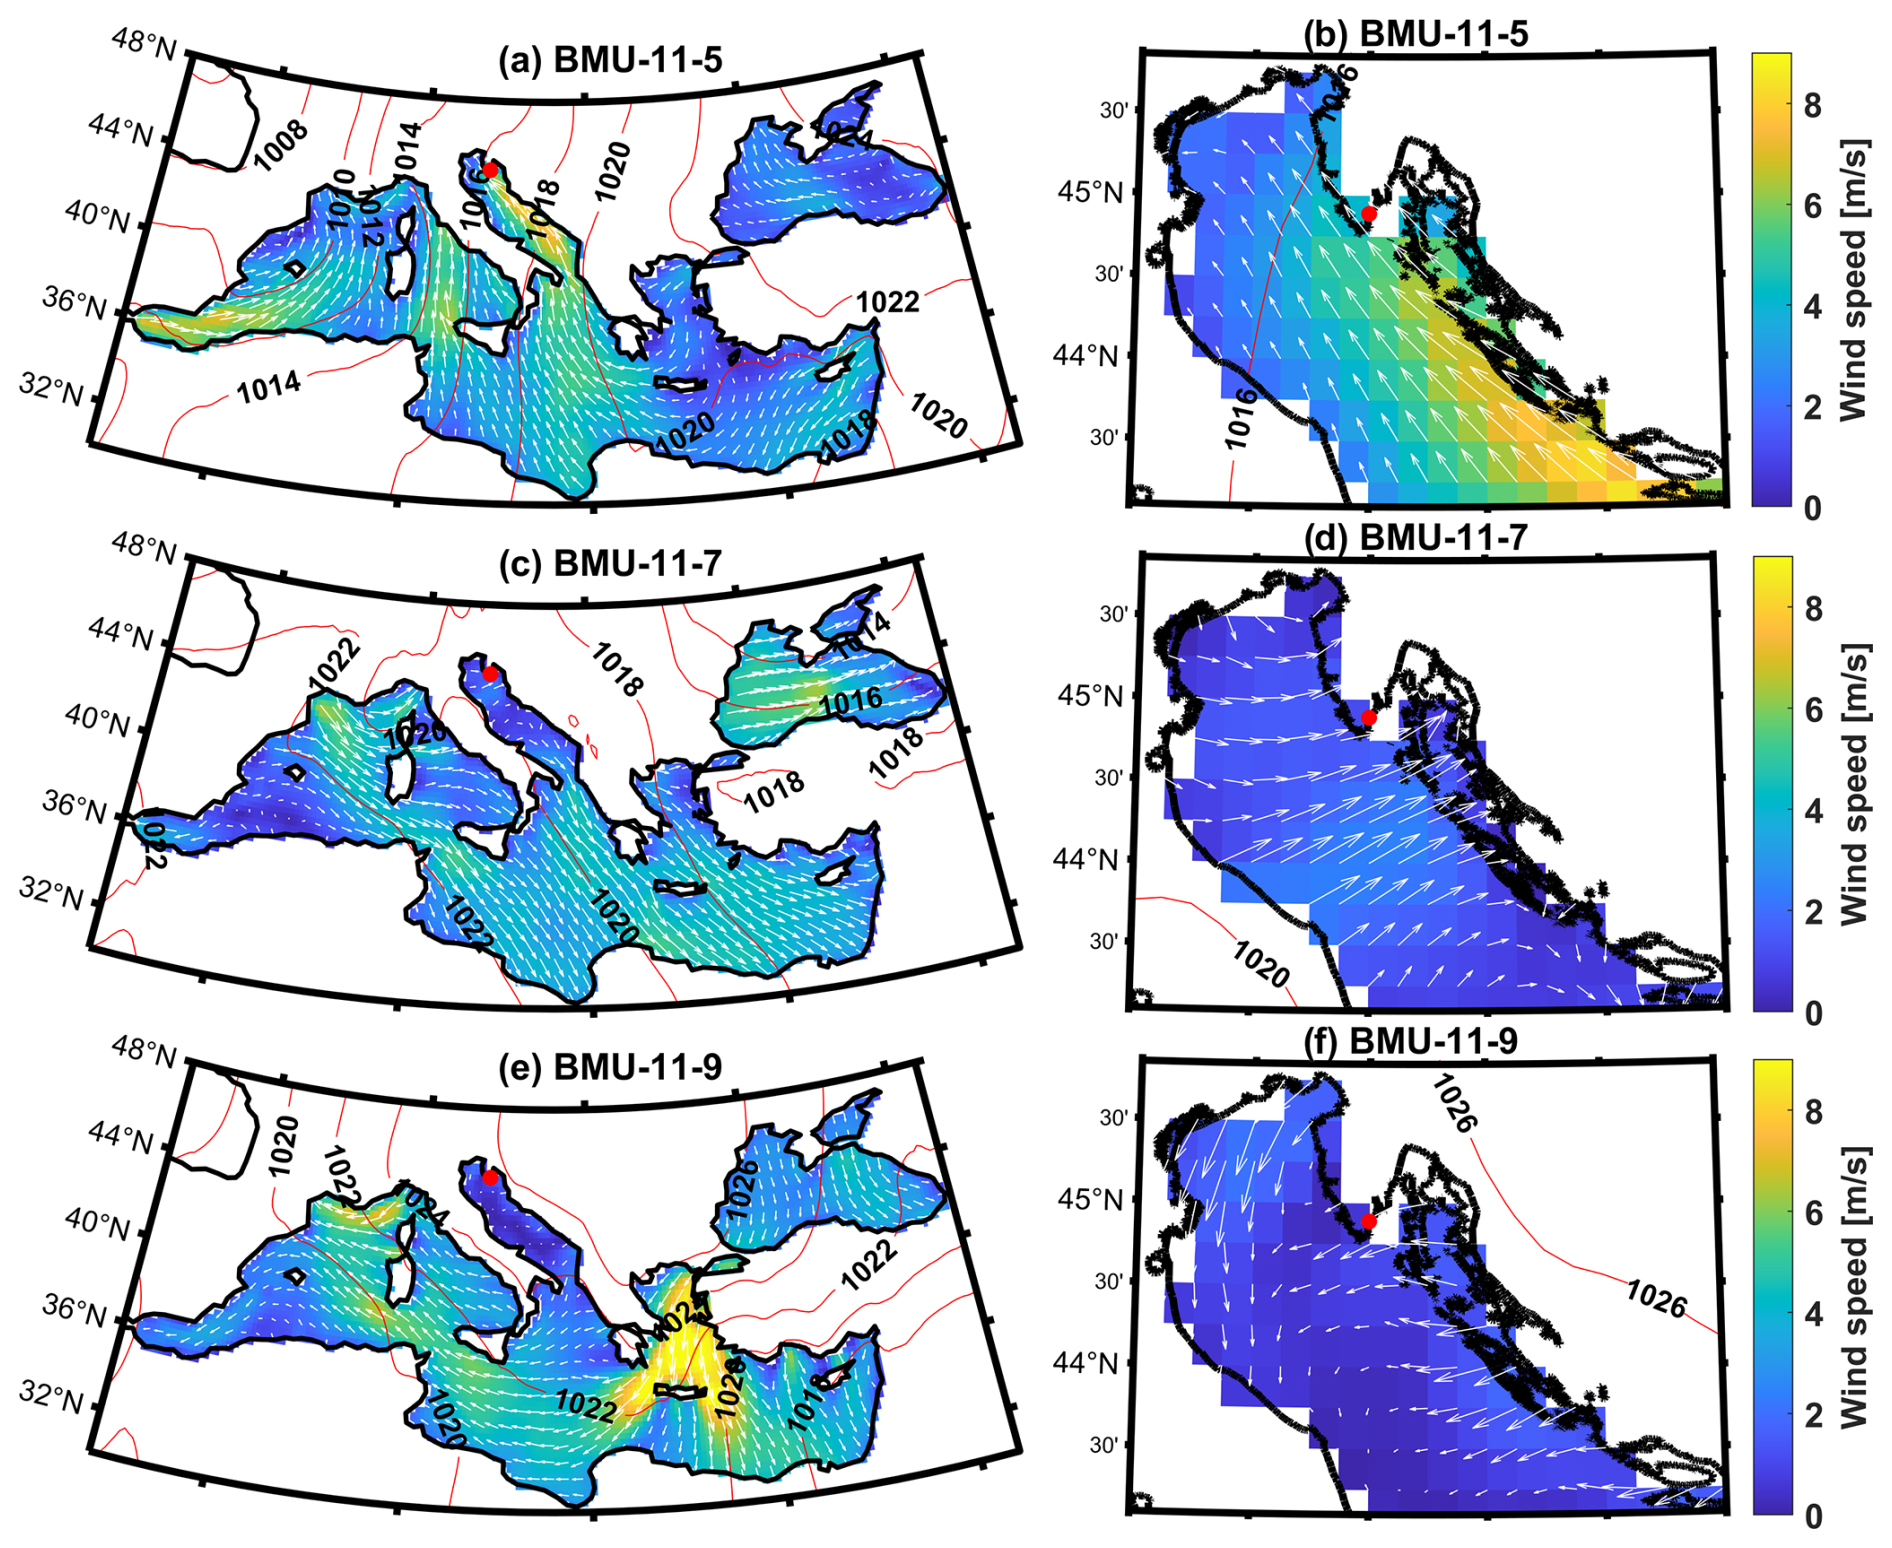
Figure 12Similar to Fig. 9 but for November: panels (a), (c), and (e) show the wider Mediterranean area, while panels (b), (d), and (f) focus on the northern and central Adriatic.
At the beginning of October, synoptic conditions favorable to the occurrence of fog and mist in Pula are typically characterized by high pressure over continental Europe, with the most common pattern being the center of the high-pressure system positioned over southeastern Europe, which supports southeasterly winds (BMU-10-5, Fig. 11c and d). This anticyclonic pattern persists into November, accompanied by a strengthened pressure field and intensified pressure gradients over the central Mediterranean, conditions which promote fog development in the region (BMU-11-9, Fig. 12e and f). The intensified synoptic pressure gradients over the central Mediterranean contribute to increased northeasterly wind patterns. This increased wind activity can result in moist air being transported from the sea into the coastal regions, providing an additional source of moisture for fog formation. The convergence of air masses along these enhanced pressure gradients likely induces upward motion of air, which can result in adiabatic cooling and an increase in relative humidity, creating conditions favorable to fog and mist formation. Pula's coastal location amplifies the influence of the anticyclone. Coastal areas are more prone to temperature inversions due to the sea's heat retention, which reduces temperature fluctuations. Anticyclonic conditions over eastern Europe combined with coastal geography create an environment where cool, moist air is trapped near the surface, favoring the formation of fog. The conditions that favor mist formation are varied; the most common synoptic pattern is the one where the high-pressure area is located over the western Mediterranean and west-southwesterly winds occur over the Istrian Peninsula. In addition to the anticyclone, a quasi-non-gradient field is also present in October and November (BMU-10-6, Fig. 11e, f; BMU-11-7, Fig. 12c and d). In December, the prevailing synoptic weather patterns associated with fog and mist become harder to identify, with BMUs more evenly distributed and with more dynamic conditions, similar to those in February and March. Nonetheless, the most frequent synoptic pattern for fog and mist (BMU-12-1, Fig. 13a; BMU-12-8, Fig. 13g) has anticyclonic characteristics. Under these conditions, the Pula region is under the influence of a pressure ridge, with the prevailing weak wind patterns from S and NE further increasing the probability of fog formation (Fig. 13b and h). Compared to earlier months, cyclones also play a more pronounced role in December's fog and mist formation. This influence is observed in two ways: weak northeasterly winds associated with cyclonic conditions in the southern Adriatic (BMU-12-3, Fig. 13c and d) and stronger northeasterly winds due to cyclonic conditions in the Tyrrhenian Sea (BMU-12-4, Fig. 13e and f).
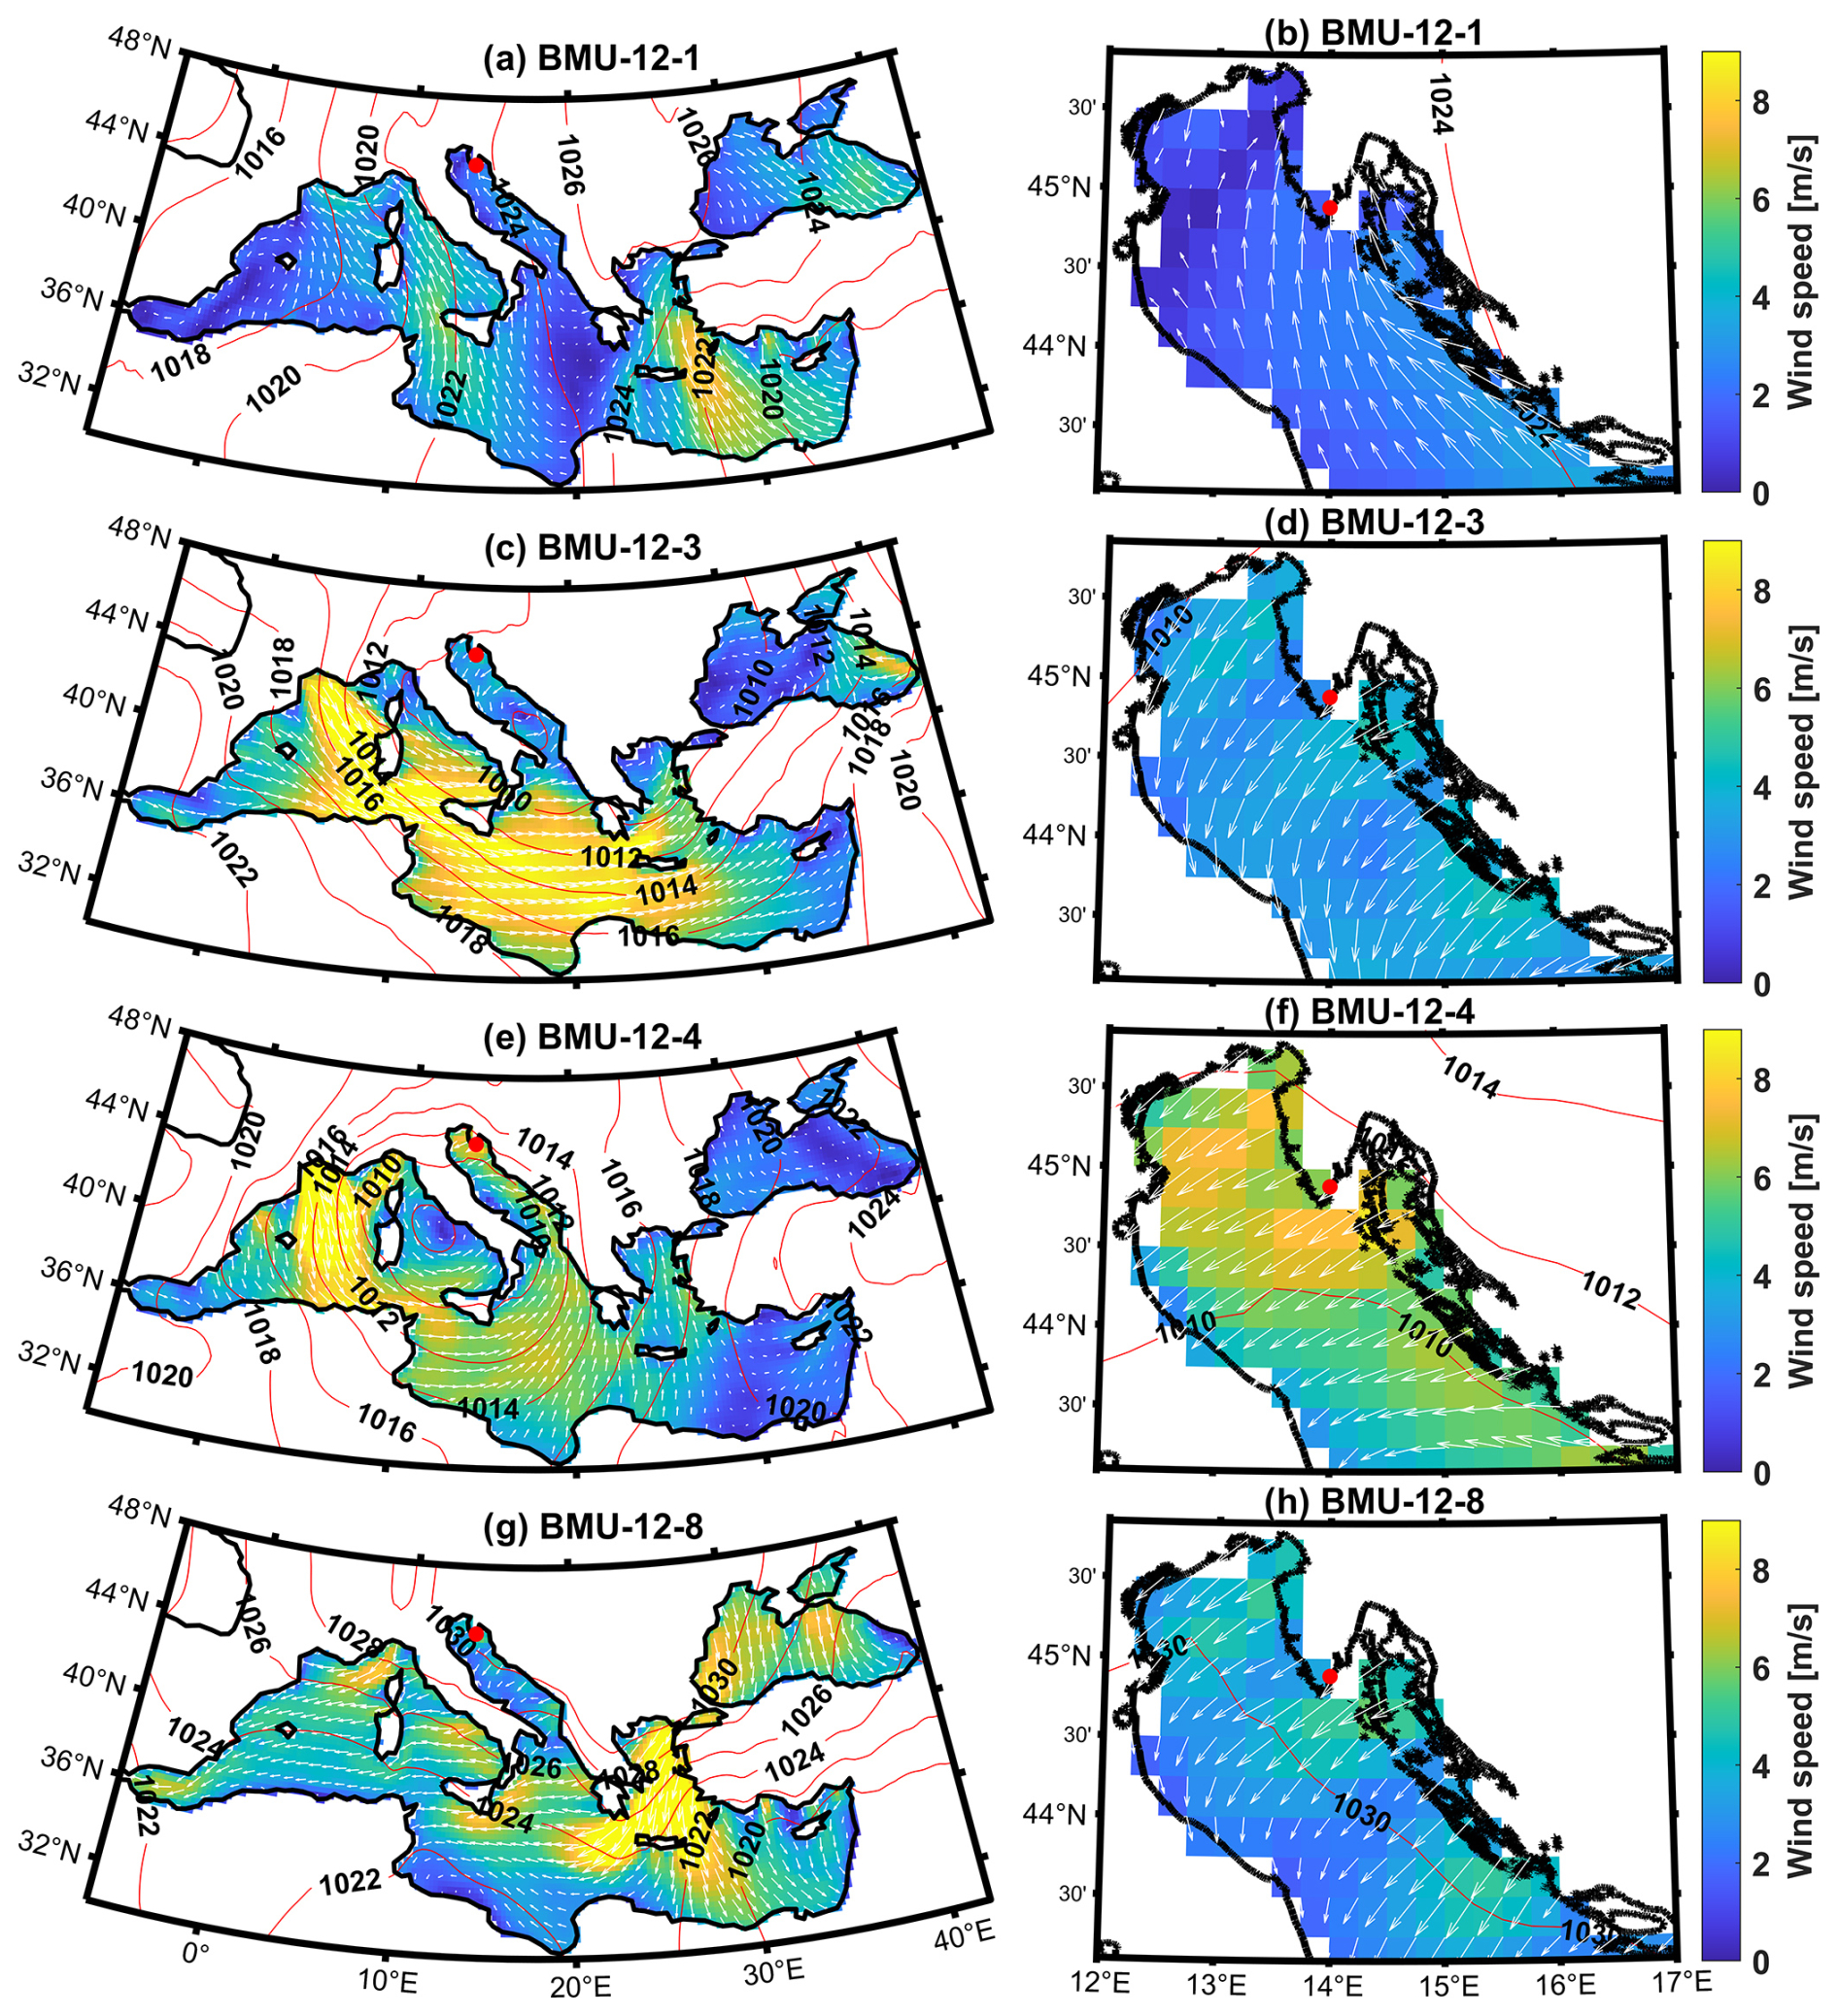
Figure 13Similar to Fig. 9 but for December: panels (a), (c), (e), and (g) show the wider Mediterranean, while panels (b), (d), (f), and (h) focus on the northern and central Adriatic.
In summary, most fog and mist events during the cold season occur under stable anticyclonic or quasi-non-gradient conditions (13 in total), though some events also occur under low-pressure conditions (5 in total). West-northwesterly winds are most common in January and February under quasi-non-gradient fields, and they contribute significantly to fog formation. Southeasterly winds dominate in March and October under anticyclonic conditions. Northeasterly winds are predominant in December, often in conjunction with anticyclones. The quasi-non-gradient field is the most frequent weather situation, accounting for 40 % of fog cases and 37 % of mist cases, followed by anticyclones, which account for 39 % of fog cases and 33 % of mist cases. Cyclones are less common, accounting for 21 % of fog cases and 30 % of mist cases.
In addition to examining the prevailing synoptic patterns during the occurrence of fog and mist, the GNG analysis also allows for the investigation of the time series of frequencies of individual BMUs. This was accomplished by first calculating the relative monthly frequency of each BMU for each year, followed by using linear regression to estimate trends and calculate slope coefficients. This process provides insights into changes in the frequency of each BMU over 2 decades (Table 1, Fig. 14). In January, the more frequent BMU-1-6 (Fig. 14a) has a strong negative trend of −0.390, while the less frequent BMU-1-8 (Fig. 14b) has a weaker positive trend of 0.107. In February, the most frequent BMU-2-7 (Fig. 14e) has a weak negative trend of −0.025. In March, the most frequent BMU, BMU-3-8 (Fig. 14h), has a positive trend of 0.255, while BMU-3-1 (Fig. 14f) has a strong negative trend of −0.572. In October, the most frequent BMU for fog and mist (BMU-10-5, Fig. 14j) has a negative trend (−0.272), while in November and December there is almost no trend for the most frequent BMUs (BMU-11-9, Fig. 14n; BMU-12-1, Fig. 14o). It can be summarized from the table that the BMUs most associated with the occurrence of fog and mist exhibit negative trends in the months with the highest share, i.e., January and February. Analyzing the data by counting positive and negative changes and grouping the synoptic patterns into three categories (cyclonic, anticyclonic, and quasi-non-gradient) reveals that, out of the 18 BMUs, 8 are anticyclonic, 5 are quasi-non-gradient, and 5 are cyclonic. There is no trend for BMU-12-1 in the anticyclonic group; three BMUs increase in frequency and four BMUs decrease in frequency. In the quasi-non-gradient group, there is one increase with four decreases. This decline in quasi-non-gradient synoptic situations has already been documented during the summer months (Belušić Vozila et al., 2021). Of the five cyclonic BMUs, two increase in frequency and three decrease. Additionally, a significant decrease (slope coefficient>0.3 or ) is observed in BMU-3-1 (anticyclonic), BMU-1-6 (quasi-non-gradient field), and BMU-12-4 (cyclonic). Positive trends do not show such large slope coefficients.
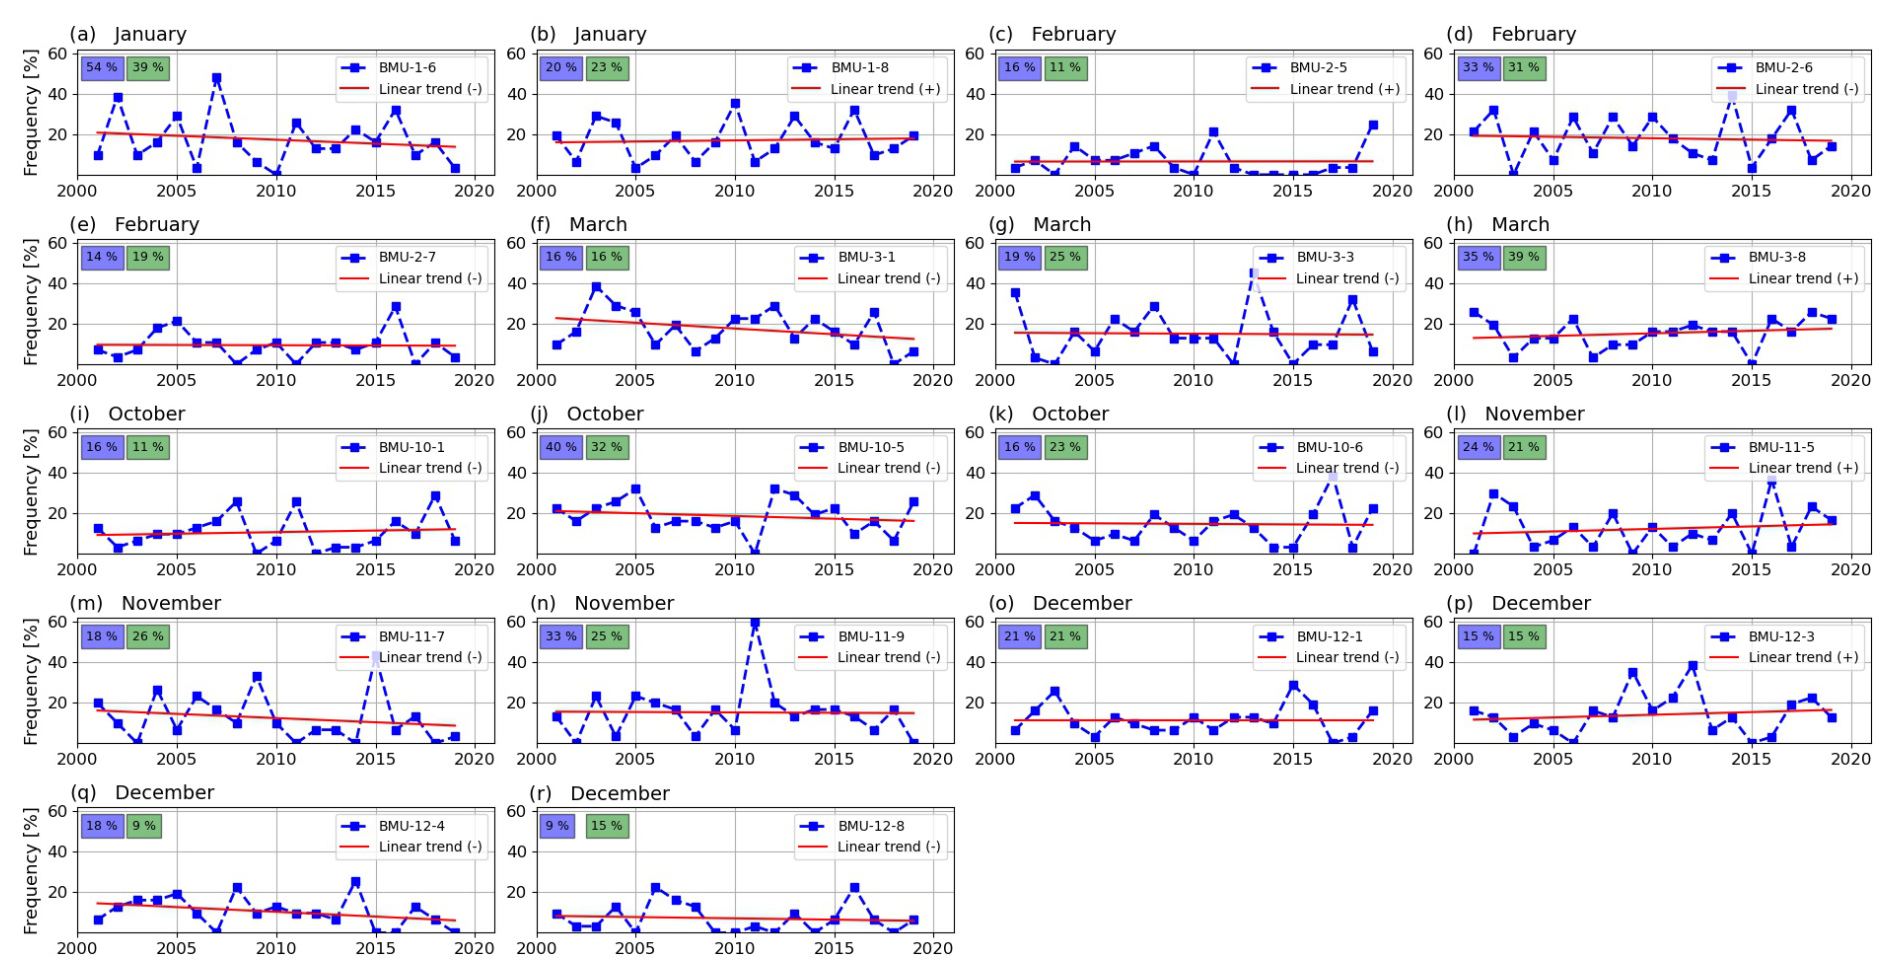
Figure 14Relative frequencies and trends of the most common (monthly share of days with fog or mist greater than 15 %) BMUs for fog and mist at Pula Airport for 2001–2019. Numbers shaded in blue denote the share of a BMU for fog days, and numbers shaded in green denote the share of a BMU for mist days. The slope coefficient values for the linear trends can be found in Table 1.
This comprehensive climatological analysis of fog and mist occurrences at Pula Airport from 2001 to 2020 has provided valuable insights into the changing patterns of these meteorological phenomena. By combining classical statistics and neural networks, the study produced noteworthy results.
The frequency of occurrence of fog and mist at Pula Airport has been decreasing, similar to trends observed in other European locations. While reduced air pollution explains the decline in cities like Zagreb and Milan, this is less applicable to Pula due to its smaller size and lower industrial impact. Climate change, including rising air temperatures and increased sea surface temperatures, is a key driver of this trend. Additionally, changing wind patterns influence fog formation by affecting temperature gradients and evaporation rates.
Fog at Pula Airport mainly occurs during the cold season (October–March) and is primarily associated with weak westerly and northwesterly winds. It is more likely to occur when the sea surface temperature is higher than the air temperature. Mist has similar characteristics to fog, although it is more likely to occur with easterly winds. Wind direction and SST variations between the sea to the west and east of the airport influence fog and mist formation.
Most fog and mist events during the cold season occur under stable anticyclonic or quasi-non-gradient conditions, with the latter being the most frequent. The wind patterns vary seasonally, with west-northwesterly and westerly winds in January and February aiding fog formation, southeasterly winds prevailing in March and October, and northeasterly winds dominating in December under anticyclones.
Synoptic patterns that promote fog and mist, especially quasi-non-gradient situations, are declining. This reduction weakens winds that transport moisture from the sea to the land and is influenced by rising sea surface and air temperatures. As a result, fog and mist frequency is expected to continue decreasing.
Overall, these findings provide a strong foundation for further research, facilitating a deeper understanding of the meteorological and oceanographic factors that influence fog and mist at Pula Airport, which is especially significant as this is the first scientific study on fog in the Pula region in over 50 years, a period during which climate change has noticeably impacted the local climate. This study has taken on the broad task of identifying synoptic patterns conducive to fog and mist formation. Since fog and mist are mainly influenced by wind speed and moisture advection, there is potential for coupled atmospheric–oceanographic modeling that incorporates local topography and enhances the parameterization of processes at finer temporal and spatial scales. Such advancements would provide a more comprehensive understanding of local meteorological phenomena and their implications for various applications, including aviation meteorology and environmental monitoring.
All the data and codes used in the analysis are available from the corresponding author on request.
MZ and TD contributed equally to the conception and design of the study, the material collection, the data preparation, the statistical and neural network analysis, the creation of the figures, and the writing. FM contributed to the neural network analysis. All the authors read and approved the final manuscript.
The contact author has declared that none of the authors has any competing interests.
Publisher's note: Copernicus Publications remains neutral with regard to jurisdictional claims made in the text, published maps, institutional affiliations, or any other geographical representation in this paper. While Copernicus Publications makes every effort to include appropriate place names, the final responsibility lies with the authors.
Measurements and observations for Pula Airport were provided by the Croatian Air Navigation Service (Crocontrol Ltd.). SST data for Pula were provided by the Meteorological and Hydrological Service of Croatia (DHMZ). The SST data for the Mediterranean region were downloaded from the Copernicus Marine Data Store (https://data.marine.copernicus.eu/, last access: 21 December 2023). The 10 m wind and MSLP data were adopted from ECMWF's ERA5 for global climate and weather. The final proofreading (grammar and spelling check) was done using ChatGPT from OpenAI.
This research has been supported in part by the European University of the Seas (SEA-EU) alliance through collaborative efforts and resources.
This paper was edited by Takemasa Miyoshi and reviewed by two anonymous referees.
Allan, S. S., Gaddy, S. G., and Evans, J. E.: Delay causality and reduction at the New York City airports using terminal weather information systems, Lincoln Laboratory, Massachusetts Institute of Technology, Cambridge, Massachussets, USA, https://archive.ll.mit.edu/mission/aviation/publications/publication-files/atc-reports/Allan_2001_ATC-291_WW-10183.pdf (last access: 19 August 2024), 2001.
Belo-Pereira, M. and Santos, J. A.: A persistent wintertime fog episode at Lisbon airport (Portugal): performance of ECMWF and AROME models, Meteorol. Appl., 23, 353–370, https://doi.org/10.1002/met.1560, 2016.
Bendix, J.: Fog climatology of the Po Valley, Riv. Meteorol. Aeronau., 54, 25–36, 1994.
Belušić, A., Prtenjak, M. T., Güttler, I., Ban, N., Leutwyler, D., and Schär, C.: Near-surface wind variability over the broader Adriatic region: insights from an ensemble of regional climate models, Clim. Dynam., 50, 4455–4480, https://doi.org/10.1007/s00382-017-3885-5, 2018.
Belušić Vozila, A., Telišman Prtenjak, M., and Güttler, I.: A weather-type classification and its application to near-surface wind climate change projections over the Adriatic region, Atmosphere-Basel, 12, 948, https://doi.org/10.3390/atmos12080948, 2021.
Bergot, T. and Koračin, D.: Observation, simulation and predictability of fog: review and perspectives, Atmosphere-Basel, 12, 235, https://doi.org/10.3390/atmos12020235, 2021.
Bonacci, O.: Analysis of mean annual temperature series in Croatia, Građevinar, 62, 781–791, https://hrcak.srce.hr/59611 (last access: 20 February 2025), 2010.
Duynkerke, P. G.: Radiation fog: A comparison of model simulation with detailed observations, Mon. Weather Rev., 119, 324–341, https://doi.org/10.1175/1520-0493(1991)119<0324:RFACOM>2.0.CO;2, 1991.
Džoić, T., Zorica, B., Matić, F., Šestanović, M., and Čikeš Keč, V.: Cataloguing environmental influences on the spatiotemporal variability of Adriatic anchovy early life stages in the eastern Adriatic Sea using an artificial neural network, Front. Mar. Sci., 9, 997937, https://doi.org/10.3389/fmars.2022.997937, 2022.
Filonczuk, M. K., Cayan, D. R., and Riddle, L. G.: Variability of marine fog along the California coast, Report 95-2, Scripps Institution of Oceanography, 102 pp., https://escholarship.org/uc/item/2kc7x97f (last access: 20 February 2025), 1995.
Fritzke, B.: A growing neural gas network learns topologies, in: Proceedings of Conference and Workshop on Neural Information Processing Systems, 28 November–3 December 1994, Denver, Colorado, USA, 625–632, https://proceedings.neurips.cc/paper/1994/file/d56b9fc4b0f1be8871f5e1c40c0067e7-Paper.pdf (last access: 20 February 2025), 1995.
Gultepe, I. and Milbrandt, J. A.: Microphysical observations and mesoscale model simulation of a warm fog case during FRAM project, Pure Appl. Geophys., 164, 1161–1178, https://doi.org/10.1007/s00024-007-0212-9, 2007.
Gultepe, I., Tardif, R., Michaelides, S. C., Cermak, I., Bott, A., Bendix, J., Müller, M. D., Pagowski, M., Hansen, B., Ellrod, G., Jacobs, W., Toth, S., and Cober, S. G.: Fog research: a review of past achievements and future perspectives, Pure Appl. Geophys., 164, 1121–1159, https://doi.org/10.1007/s00024-007-0211-x, 2007.
Hersbach, H., Bell, B., Berrisford, P., Hirahara, S., Horányi, A., Muñoz-Sabater, J., Nicolas, J., Peubey, C., Radu, R., Schepers, D., Simmons, A., Soci, C., Abdalla, S., Abellan, X., Balsamo, G., Bechtold, P., Biavati, G., Bidlot, J., Bonavita, M., De Chiara, G., Dahlgren, P., Dee, D., Diamantakis, M., Dragani, R., Flemming, J., Forbes, R., Fuentes, M., Geer, A., Haimberger, L., Healy, S., Hogan, R. J., Hólm, E., Janisková, M., Keeley, S., Laloyaux, P., Lopez, P., Lupu, C., Radnoti, G., de Rosnay, P., Rozum, I., Vamborg, F., Villaume, S., and Thépaut, J.-N.: The ERA5 global reanalysis, Q. J. Roy. Meteor. Soc., 146, 1999–2049, https://doi.org/10.1002/qj.3803, 2020a.
Hersbach, H., Bell, B., Berrisford, P., Hirahara, S., Horányi, A., Muñoz-Sabater, J., Nicolas, J., Peubey, C., Radu, R., Schepers, D., Simmons, A., Soci, C., Abdalla, S., Abellan, X., Balsamo, G., Bechtold, P., Biavati, G., Bidlot, J., Bonavita, M., De Chiara, G., Dahlgren, P., Dee, D., Diamantakis, M., Dragani, R., Flemming, J., Forbes, R., Fuentes, M., Geer, A., Haimberger, L., Healy, S., Hogan, R. J., Hólm, E., Janisková, M., Keeley, S., Laloyaux, P., Lopez, P., Lupu, C., Radnoti, G., de Rosnay, P., Rozum, I., Vamborg, F., Villaume, S., and Thépaut, J.-N.: ERA5 hourly data on pressure levels from 1979 to present, Copernicus Climate Change Service Climate Data Store [data set], https://doi.org/10.1002/qj.3803, 2020b.
Huang, B., Zhang, J., Cao, Y., Gao, X., Ma, S., and Sun, C.: Improvements of sea fog forecasting based on CMA-TYM, Front. Earth Sci., 10, 854438, https://doi.org/10.3389/feart.2022.854438, 2022.
Ju, T., Wu, B., Zhang, H., and Liu, J.: Parameterization of radiation fog-top height and methods evaluation in Tianjin, Atmosphere-Basel, 11, 480, https://doi.org/10.3390/atmos11050480, 2020.
Kawai, H., Koshiro, T., Endo, H., Arakawa, O., and Hagihara, Y.: Changes in marine fog in a warmer climate, Atmos. Sci. Lett., 17, 548–555, https://doi.org/10.1002/asl.691, 2016.
Klaić, Z. B., Pasarić, Z., and Tudor, M.: On the interplay between sea–land breezes and etesian winds over the Adriatic, J. Marine Syst., 78, 101–118, https://doi.org/10.1016/j.jmarsys.2009.01.016, 2009.
Klemm, O. and Lin, N.: What causes observed fog trends: air quality or climate change?, Aerosol Air Qual. Res., 16, 1131–1142, https://doi.org/10.4209/aaqr.2015.05.0353, 2016.
Koračin, D. and Dorman, C. E.: Marine fog: challenges and advancements in observations and forecasting, in: Springer Atmospheric Sciences Series, Springer International Publishing, Cham, 537 pp., ISBN 978-3-319-45227-2, https://doi.org/10.1007/978-3-319-45229-6, 2017.
Koračin, D., Lewis, J., Thompson, W. T., Dorman, C. E., and Businger, J. A.: Transition of stratus into fog along the California coast: observations and modeling, J. Atmos. Sci., 58, 1714–1731, https://doi.org/10.1175/1520-0469(2001)058%3C1714:TOSIFA%3E2.0.CO;2, 2001.
Kulkarni, R., Jenamani, R. K., Pithani, P., Konwar, M., Nigam, N., and Ghude, S. D.: Loss to aviation economy due to winter fog in New Delhi during the winter of 2011–2016, Atmosphere-Basel, 10, 198, https://doi.org/10.3390/atmos10040198, 2019.
Li, G., Cheng, L., Zhu, J., and Trenberth, K.: Increasing ocean stratification over the past half-century, Nat. Clim. Change, 10, 1116–1123, https://doi.org/10.1038/s41558-020-00918-2, 2020.
Li, X., Zhang, S., Koračin, D., Yi, L., and Zhang, Y.: Atmospheric conditions conducive to marine fog over the northeast Pacific in winters of 1979–'2019, Front. Earth Sci., 10, 942846, https://doi.org/10.3389/feart.2022.942846, 2022
Mariani, L.: Fog in the Po valley: Some meteo-climatic aspects, Ital. J. Agrometeorol., 3, 35–44, 2009.
Martinetz, T. and Schulten, K.: A neural-gas network learns topologies, in: Proceedings of the International Conference on Artificial Neural Networks (ICANN-91), 24–28 June 1991, Espoo, Finland, 397–402, https://www.ks.uiuc.edu/Publications/Papers/PDF/MART91B/MART91B.pdf (last access: 12 April 2025), 1991.
Matić, F., Džoić, T., Kalinić, H., Ćatipović, L., Udovičić, D., Juretić, T., Rakuljić, L., Sršen, D., and Tičina, V.: Observation of abrupt changes in the sea surface layer of the Adriatic Sea, J. Mar. Sci. Eng., 10, 848, https://doi.org/10.3390/jmse10070848, 2022.
Merchant, C. J., Embury, O., Bulgin, C. E., Block, T., Corlett, G. K., Fiedler, E., Good, S. A., Mittaz, J., Rayner, N. A., Berry, D., Eastwood, S., Taylor, M., Tsushima, Y., Waterfall, A., Wilson, R., and Donlon, C.: Satellite-based time-series of sea-surface temperature since 1981 for climate applications, Sci. Data, 11, 326, https://doi.org/10.1038/s41597-019-0236-x, 2019.
Omazić, B., Telišman Prtenjak, M., Prša, I., Belušić Vozila, A., Vučetić, V., Karoglan, M., Karoglan Kontić, J., Prša, Ž., Anić, M., Šimon, S., and Güttler, I.: Climate change impacts on viticulture in Croatia; viticultural zoning and future potential, Int. J. Climatol., 40, 5634–5655, https://doi.org/10.1002/joc.6541, 2020.
Oztaner, Y. B. and Yilmaz, A.: An examination of fog and PM10 Relationship for Ataturk and Esenboga International Airports of Turkey, in: Volume 1,Proceedings of the 6th Atmospheric Science Symposium – ATMOS 2013, 24–26 April 2013, Istanbul, Turkey, https://www.researchgate.net/publication/262780771_An_Examination_of_Fog_and_PM10_Relationship_for_Ataturk_and_Esenboga_International_Airports_of_Turkey (last access: 12 April 2025), 2013.
Pandžić, K. and Likso, T.: Eastern Adriatic typical wind field patterns and large-scale atmospheric conditions, Int. J. Climatol., 25, 81–98, https://doi.org/10.1002/joc.1085, 2005.
Pastor, F., Valiente, J. A., and Palau, J. L.: Sea surface temperature in the Mediterranean: trends and spatial patterns, Pure Appl. Geophys., 175, 4017–4029, https://doi.org/10.1007/s00024-017-1739-z, 2018.
Pawlowicz, R.: M_Map: A mapping package for MATLAB, version 1.4 m, The University of British Columbia [code], http://www.eoas.ubc.ca/~rich/map.html (last access: September 2023), 2020.
Popović, R., Kulović, M., and Stanivuk, T.: Meteorological safety of entering eastern Adriatic ports, Trans. Marit. Sci., 3, 53–60, https://doi.org/10.7225/toms.v03.n01.006, 2014.
Šantić, D., Piwosz, K., Matić, F., Vrdoljak Tomaš, A., Arapov, J., Dean, J. L., Šolić, M., Koblížek, M., Kušpilić, G., and Šestanović, S.: Artificial neural network analysis of microbial diversity in the central and southern Adriatic Sea, Sci. Rep.-UK, 11, 1–15, https://doi.org/10.1038/s41598-021-90863-7, 2021.
Šimunić, I., Likso, T., Husnjak, S., and Bubalo Kovačić, M.: Analysis of climate elements in central and western Istria for the purpose of determining irrigation requirements of agricultural crops, Agric. Conspec. Sci., 86, 225–233, 2021.
Stipaničić, V.: Magle na zapadnoj obali istarskog poluotoka, Vijesti Pomorske meteorološke službe, 7–10, https://library.foi.hr/dbook/cas.php?B=1&item=S02101&godina=1972&broj=00001 (last access: 20 February 2025), 1972.
Stolaki, S. N., Kazadzis, S. A., Foris, D. V., and Karacostas, Th. S.: Fog characteristics at the airport of Thessaloniki, Greece, Nat. Hazards Earth Syst. Sci., 9, 1541–1549, https://doi.org/10.5194/nhess-9-1541-2009, 2009.
Tardif, R. and Rasmussen, R. M.: Event-based climatology and typology of fog in the New York City region, J. Appl. Meteorol. Clim., 46, 1141–1168, https://doi.org/10.1175/JAM2516.1, 2007.
Telišman Prtenjak, M. and Grisogono, B.: Sea–land breeze climatological characteristics along the northern Croatian Adriatic coast, Theor. Appl. Climatol., 90, 201–215, https://doi.org/10.1007/s00704-006-0286-9, 2007.
Telišman Prtenjak, M., Viher, M., and Jurković, J.: Sea–land breeze development during a summer bora event along the north-eastern Adriatic coast, Q. J. Roy. Meteor. Soc., 136, 1554–1571, https://doi.org/10.1002/qj.649, 2010.
Tešić, M. and Brozinčević, K.: Magla na istočnoj obali Jadrana, Hidrografski godišnjak 1974, 91–116, 1974.
Tojčić, I., Denamiel, C., and Vilibić, I.: Kilometer-scale trends and variability of the Adriatic present climate (1987–2017), Clim. Dynam., 61, 2521–2545, https://doi.org/10.1007/s00382-023-06700-2, 2023.
Tojčić, I., Denamiel, C., and Vilibić, I.: Kilometer-scale trends, variability, and extremes of the Adriatic far-future climate (RCP 8.5, 2070–2100), Front. Mar. Sci., 16, 907–926, https://doi.org/10.3389/fmars.2024.1329020, 2024.
Vautard, R., Yiou, P., and van Oldenborgh, G.: The decline of fog, mist and haze in Europe during the last 30 years, Nat. Geosci., 2, 115–119, https://doi.org/10.1038/ngeo414, 2009.
Veljović, K., Vujović, D., and Lazić, L.: An analysis of fog events at Belgrade International Airport, Theor. Appl. Climatol., 119, 13–24, https://doi.org/10.1007/s00704-014-1090-6, 2015.
Wang, Y., Niu, S. J., Lv, J., Lu, C., Xu, X. Q., Wang, Y., Ding, J., Zhang, H., Wang, T., and Kang, B.: A new method for distinguishing unactivated particles in cloud condensation nuclei measurements: implications for aerosol indirect effect evaluation, Geophys. Res. Lett., 46, 14185–14194, https://doi.org/10.1029/2019gl085379, 2019.
WMO: International Meteorological Vocabulary, World Meteorological Organization, Geneva, 782 pp., ISBN 978–92-63–02182-3, 1992.
Zoldoš, M. and Jurković, J.: Fog event climatology for Zagreb Airport, Croat. Meteorol. J., 51, 13–26, 2016.